


 |
市場調查報告書
商品編碼
1934827
美國電信鐵塔:市場佔有率分析、產業趨勢與統計、成長預測(2026-2031)United States Telecom Towers - Market Share Analysis, Industry Trends & Statistics, Growth Forecasts (2026 - 2031) |
||||||
※ 本網頁內容可能與最新版本有所差異。詳細情況請與我們聯繫。
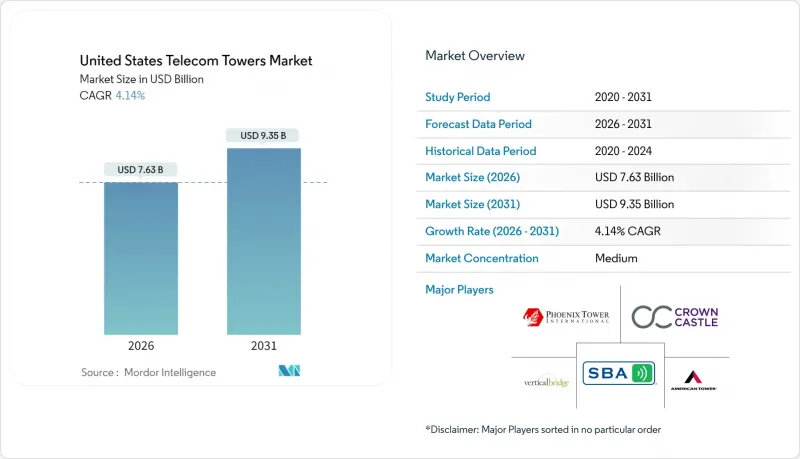
據估計,到 2026 年,美國電信鐵塔市值將達到 76.3 億美元,高於 2025 年的 73.3 億美元。
預計到 2031 年將達到 93.5 億美元,2026 年至 2031 年的複合年成長率為 4.14%。
長期成長依賴中頻段和C頻段5G網路密度的提升,而非大規模建設新基地台。因此,營運商正透過先進的天線系統和多租戶租賃模式,從現有資產中獲取更多收益。獨立鐵塔公司擴張最為迅速,主要得益於通訊業者出售資產並將資金再投資於頻寬。能源現代化,尤其是太陽能混合動力,是另一個大結構性利多因素,因為燃料成本波動和環境法規的推動,加速了可再生能源的普及。同時,優惠的聯邦稅收政策和國防支出的開放式無線接入網(Open-RAN)試點項目,即使在高利率環境下,也確保了資金持續流入現代化計劃。
美國電信鐵塔市場趨勢與洞察
5G中頻段和C頻段密集化波
通訊業者在2025年投入約350億美元的資本支出用於3.5GHz和C頻段的升級改造,這些升級將在現有設施中加裝天線、無線電設備和電力系統,而非新建設。這種轉變使得擁有維修經驗的鐵塔公司能夠獲得更高的租金,並更快地增加租戶。 T-Mobile迅速部署原Sprint的中頻寬頻譜就是一個典型的例子,它展示了在數千個共享站點上進行高密度部署如何創造新的收入來源。即使在受分區法規限制新建設的地區,對站點升級的重視也推動了美國電信鐵塔市場的成長。技術複雜性增加了通訊業者轉換營運商的門檻,從而增強了長期租賃的穩定性,並為大型鐵塔房地產投資信託基金(REIT)帶來了可預測的現金流。
美國國稅局「安全港」特殊折舊
加速折舊政策允許鐵塔所有者在第一年累計,從而提高稅後收益並釋放資金用於其他計劃。獨立營運商可以透過具有競爭力的租金遞增機制將部分收益轉讓給通訊業者,從而增強其自有鐵塔的價值提案。符合條件的資產範圍已從鋼筋混凝土擴展到光纖回程傳輸、電池和加固設備,使得該激勵措施在多輪升級中均有效。這項政策尤其有利於農村地區,因為這些地區的租戶收入較低,但現代化成本是固定的,從而維持了美國電信鐵塔市場的全國成長動能。
地方政府的高度限制(低於 150 英尺)
許多郊區市政當局現在將建築物高度限制在 150 英尺以內,這延長了核准週期並增加了設計複雜性。營運商要么必須採用更昂貴的隱藏式桿塔,要么必須增設屋頂小型基站,通常需要將站點數量增加一倍才能達到類似的覆蓋範圍。核准時間可能超過 24 個月,這會延遲現金流並減緩美國電信鐵塔市場的成長速度。
細分市場分析
預計到2025年,獨立鐵塔公司將佔據美國電信鐵塔市場75.02%的佔有率,並在2031年之前保持4.66%的複合年成長率。通訊業者資產出售所得資金正用於頻譜競標,Verizon向Vertical Bridge出售6339個基地台(價值33億美元)的案例,正是營運商向輕資產戰略轉型多年戰略的典型代表。每個鐵塔擁有多個租戶可以提高獲利能力,而維護、能源和許可方面的規模綜效則能帶來結構性的成本優勢。
在需要直接控制以保障關鍵任務涵蓋的地區,業者自有站點仍具有重要的策略意義,但其相對成長速度較為緩慢。在農村和軍事建設領域,合資企業應運而生,使通訊業者能夠在利用獨立專業知識的同時保持影響力。
在美國電信塔市場,預計到 2025 年,地面安裝式塔架將佔收入的 74.15%,而屋頂安裝式塔架預計到 2031 年將以 5.24% 的複合年成長率成長。由於在人口密集的城市地區安裝新的宏塔很困難,與業主達成的協議可以快速安裝屋頂塔架,從而填補毫米波覆蓋的空白。
地面基地台的平均租戶密度仍然最高,根據Crown Castle報告,平均每座塔樓有2.4個租戶。因此,它們仍然是核心收入來源。然而,分區限制和美觀方面的考慮正在推動對隱藏式建築幕牆、筒桿式和女兒牆式小型基地台的需求成長。這些都市區設施的開發週期較短,即使租金較低,也能更快實現收入。
美國電信鐵塔市場報告按所有權類型(通訊業者擁有、獨立鐵塔公司等)、安裝類型(屋頂安裝、地面安裝)、燃料類型(可再生能源供電、電網/柴油混合供電)和鐵塔類型(單極塔、格構塔、拉線塔、隱蔽式/暗裝塔)進行細分。市場預測以價值(美元)和數量(已安裝基數)為單位。
其他福利:
- Excel格式的市場預測(ME)表
- 3個月的分析師支持
目錄
第1章 引言
- 研究假設和市場定義
- 調查範圍
- 分類系統
第2章調查方法
第3章執行摘要
- 電信鐵塔數量預測(單位數量,2023-2030 年)
- 電信鐵塔租賃收入預測(美元,2023-2030 年)
- 電信鐵塔建設收入預測(美元,2023-2030 年)
第4章 市場情勢
- 市場概覽
- 市場促進因素
- 5G中頻段和C頻段密度增強波
- 根據美國國稅局「安全港」條款,塔樓維修可享有特殊折舊。
- 美國國防部資助各軍事基地進行開放式無線接取網路(Open-RAN)試點項目
- T-Mobile與Crown Castle續約12年主租賃協議
- CHIPS 和科學法案光纖塔稅額扣抵
- 省級太陽能混合發電淨計量
- 市場限制
- 地方政府的高度限制(低於 150 英尺)
- 資本成本較高(聯邦基金利率 > 4.75%)
- 有線 MVNO CBRS小型基地台卸載
- 柴油發電機加油禁令(2028 年後)
- 生態系分析
- 電訊基礎設施相關法規
- 技術展望
- 波特五力分析
- 供應商的議價能力
- 買方的議價能力
- 新進入者的威脅
- 替代品的威脅
- 競爭對手之間的競爭
- 宏觀經濟因素如何影響市場
第5章 市場規模及成長預測(價值與數量,2023-2030 年)
- 依所有權類型
- 企業所有
- 獨立鐵塔公司
- 合資塔樓公司
- MNO獨家
- 透過安裝
- 屋頂安裝類型
- 地面安裝
- 按燃料類型
- 可再生能源
- 電網/柴油混合動力
- 按塔類型
- 單極子
- 格子
- 包含拉線
- 隱蔽/隱藏
第6章 競爭情勢
- 市場集中度
- 重大併購詳情
- 主要供應商市佔率分析
- 公司簡介
- TowerCos
- American Tower Corporation
- Crown Castle Inc.
- SBA Communications Corp.
- Vertical Bridge, REIT, LLC
- Phoenix Tower International(PTI)
- Mobile Network Operator
- Verizon Communications Inc.
- AT&T Inc.
- T-Mobile US, Inc.
- Dish Wireless(DISH Network LLC)
- TowerCos
第7章 市場機會與未來展望
United States Telecom Towers Market size in 2026 is estimated at USD 7.63 billion, growing from 2025 value of USD 7.33 billion with 2031 projections showing USD 9.35 billion, growing at 4.14% CAGR over 2026-2031.
Long-term growth hinges on densifying mid-band and C-band 5G rather than erecting large volumes of new structures, so operators are extracting more revenue from existing assets through advanced antenna systems and multi-tenant lease-up. Independent tower companies have scaled fastest, helped by carrier asset divestitures that recycle capital into spectrum. Energy modernization, particularly solar-hybrid power, is another structural tailwind as fuel cost volatility and environmental rules accelerate renewable deployments. Simultaneously, favorable federal tax incentives and defense-funded Open-RAN pilots keep capital flowing into modernization projects even as borrowing rates stay elevated.
United States Telecom Towers Market Trends and Insights
5G Mid-Band and C-Band Densification Wave
Carriers are channeling roughly USD 35 billion of 2025 capex into 3.5 GHz and C-band upgrades that bolt additional antennas, radios, and power systems onto existing structures rather than funding green-field builds. This shift allows tower companies with proven modification expertise to command higher amendment rents and quicker tenant additions. T-Mobile's rapid deployment of ex-Sprint mid-band spectrum exemplifies how densification generates fresh revenue streams across thousands of co-located sites. The emphasis on site upgrades keeps the United States telecom towers market growing, even where new construction is zoning-constrained. Engineering complexity also raises switching barriers for carriers, reinforcing long leases and predictable cash flows for leading tower REITs.
IRS "Safe-Harbor" Bonus Depreciation
Accelerated depreciation lets tower owners expense a large share of upgrade costs in year one, boosting after-tax returns and freeing cash for additional projects. Independent operators pass part of this benefit to carrier tenants through competitive rent escalators, thereby strengthening their value proposition versus self-owned towers. Qualifying assets extend beyond steel and concrete to fiber backhaul, batteries, and environmental hardening, making the incentive relevant across multiple upgrade waves. The policy particularly supports rural sites where revenue per tenant is lower, yet modernization costs remain fixed, sustaining nationwide momentum for the United States telecom towers market.
Municipal Height Caps (<150 ft)
Many suburban councils now cap structure height at 150 ft, lengthening permitting cycles and raising design complexity . Operators must adopt costlier stealth poles or add rooftop small cells, often doubling site counts for equivalent coverage. Approval timelines can exceed 24 months, deferring cash flows and tempering the growth trajectory of the United States telecom towers market.
Other drivers and restraints analyzed in the detailed report include:
- DoD Open-RAN Pilot Funding
- Fiber-to-Tower tax credits in CHIPS and Science Act
- High Cost of Capital
For complete list of drivers and restraints, kindly check the Table Of Contents.
Segment Analysis
Independent tower companies dominated the United States telecom towers market with a 75.02% share in 2025 and are on track for a 4.66% CAGR through 2031. Carrier divestitures free up funds for spectrum auctions, so Verizon's USD 3.3 billion sale of 6,339 sites to Vertical Bridge capped a multi-year shift to asset-light strategies. Multiple tenants per structure lift returns, and scale synergies in maintenance, energy, and permitting create structural cost advantages.
Operator-owned sites remain strategically important where mission-critical coverage demands direct control, yet their relative growth lags. Joint-venture vehicles emerge for rural or military builds where carriers retain influence while leveraging independent expertise.
Ground-based structures accounted for 74.15% of 2025 revenue within the United States telecom towers market; rooftops, however, carry a 5.24% CAGR outlook to 2031. Dense downtown corridors often prohibit new macro towers, so property-owner agreements enable quicker rooftop deployments that fill millimeter-wave coverage gaps.
Ground sites still drive the highest average tenancy, Crown Castle reports 2.4 tenants per tower, so they remain core revenue engines . Yet zoning pushback and aesthetics tilt incremental demand toward concealed facades, canister poles, and parapet-mounted small cells. These urban installations carry shorter development cycles, supporting faster revenue realization even if per-site rent is lower.
The United States Telecom Towers Market Report is Segmented by Ownership (Operator-Owned, Independent TowerCo, and More), Installation (Rooftop, Ground-Based), Fuel Type (Renewable-Powered, Grid/Diesel Hybrid), and Tower Type (Monopole, Lattice, Guyed, Stealth/Concealed). The Market Forecasts are Provided in Terms of Value (USD) and Volume (Installed Base).
List of Companies Covered in this Report:
- TowerCos
- Mobile Network Operator
Additional Benefits:
- The market estimate (ME) sheet in Excel format
- 3 months of analyst support
TABLE OF CONTENTS
1 INTRODUCTION
- 1.1 Study Assumptions and Market Definition
- 1.2 Scope of the Study
- 1.3 Taxonomy
2 RESEARCH METHODOLOGY
3 EXECUTIVE SUMMARY
- 3.1 Telecom Tower Volume Estimates (Units, 2023-2030)
- 3.2 Telecom Tower Leasing Revenue Estimates (USD, 2023-2030)
- 3.3 Telecom Tower Construction Revenue Estimates (USD, 2023-2030)
4 MARKET LANDSCAPE
- 4.1 Market Overview
- 4.2 Market Drivers
- 4.2.1 5G mid-band and C-band densification wave
- 4.2.2 IRS "safe-harbor" bonus depreciation on tower upgrades
- 4.2.3 DoD Open-RAN pilot funding across military bases
- 4.2.4 T-Mobile and Crown Castle 12-yr master-lease renewal
- 4.2.5 Fiber-to-Tower tax credits in CHIPS and Science Act
- 4.2.6 State-level net-metering for solar-hybrid power
- 4.3 Market Restraints
- 4.3.1 Municipal height caps (<150 ft)
- 4.3.2 High cost of capital (Fed Funds >4.75 %)
- 4.3.3 Cable-MVNO CBRS small-cell off-load
- 4.3.4 Diesel-genset refueling moratoria (post-2028)
- 4.4 Ecosystem Analysis
- 4.5 Regulatory Landscape Related to Telecom Infrastructure
- 4.6 Technological Outlook
- 4.7 Porter's Five Forces Analysis
- 4.7.1 Bargaining Power of Suppliers
- 4.7.2 Bargaining Power of Buyers
- 4.7.3 Threat of New Entrants
- 4.7.4 Threat of Substitutes
- 4.7.5 Intensity of Competitive Rivalry
- 4.8 Impact of Macroeconomic Factors on the Market
5 MARKET SIZE AND GROWTH FORECASTS (VALUE AND VOLUME, 2023-2030)
- 5.1 By Ownership
- 5.1.1 Operator-owned
- 5.1.2 Independent TowerCo
- 5.1.3 Joint-Venture TowerCo
- 5.1.4 MNO Captive
- 5.2 By Installation
- 5.2.1 Rooftop
- 5.2.2 Ground-based
- 5.3 By Fuel Type
- 5.3.1 Renewable-powered
- 5.3.2 Grid/Diesel Hybrid
- 5.4 By Tower Type
- 5.4.1 Monopole
- 5.4.2 Lattice
- 5.4.3 Guyed
- 5.4.4 Stealth / Concealed
6 COMPETITIVE LANDSCAPE
- 6.1 Market Concentration
- 6.2 Details of Major Mergers and Acquisitions
- 6.3 Market Share Analysis for Top Vendors
- 6.4 Company Profiles (includes Global level Overview, Market level overview, Core Segments, Financials, Strategic Information,Products and Services, Recent Developments)
- 6.4.1 TowerCos
- 6.4.1.1 American Tower Corporation
- 6.4.1.2 Crown Castle Inc.
- 6.4.1.3 SBA Communications Corp.
- 6.4.1.4 Vertical Bridge, REIT, LLC
- 6.4.1.5 Phoenix Tower International (PTI)
- 6.4.2 Mobile Network Operator
- 6.4.2.1 Verizon Communications Inc.
- 6.4.2.2 AT&T Inc.
- 6.4.2.3 T-Mobile US, Inc.
- 6.4.2.4 Dish Wireless (DISH Network L.L.C)
- 6.4.1 TowerCos
7 MARKET OPPORTUNITIES AND FUTURE OUTLOOK
- 7.1 White-space and Unmet-need Assessment
- 7.2 Investment Analysis
- 7.3 Analyst Suggestions and Recommendations
 通訊塔市場規模、佔有率、趨勢和預測:按塔型、燃料類型、安裝方式、所有權方式和地區分類,2026-2034 年
 隱蔽通訊塔市場規模、佔有率和成長分析:按偽裝設計/類型、塔架結構、頻率/頻段相容性、安裝位置和地區分類-2026-2033年產業預測
 行動電話基地台管理市場:依接取技術、塔型、安裝方式、服務類型、高度等級、組件類型及最終用戶產業分類-2026-2032年全球市場預測
 2026年全球數位雙胞胎市場報告
 2026-2030年全球電信塔市場2026年全球通訊塔市場報告
 非洲電信塔及相關產業:市場佔有率分析、產業趨勢與統計、成長預測(2026-2031)電信塔:市場佔有率分析、產業趨勢與統計資料、成長預測(2026-2031 年)
 塔架管理軟體市場 - 全球產業規模、佔有率、趨勢、機會及預測(按部署類型、塔架類型、功能、最終用戶、地區和競爭格局分類,2021-2031 年)電信塔供電系統市場-全球產業規模、佔有率、趨勢、機會與預測:電源、電網、組件、區域和競爭格局,2021-2031年