


 |
市場調查報告書
商品編碼
1934899
美國汽車貸款:市場佔有率分析、行業趨勢和統計數據以及成長預測(2026-2031 年)US Auto Loan - Market Share Analysis, Industry Trends & Statistics, Growth Forecasts (2026 - 2031) |
||||||
※ 本網頁內容可能與最新版本有所差異。詳細情況請與我們聯繫。
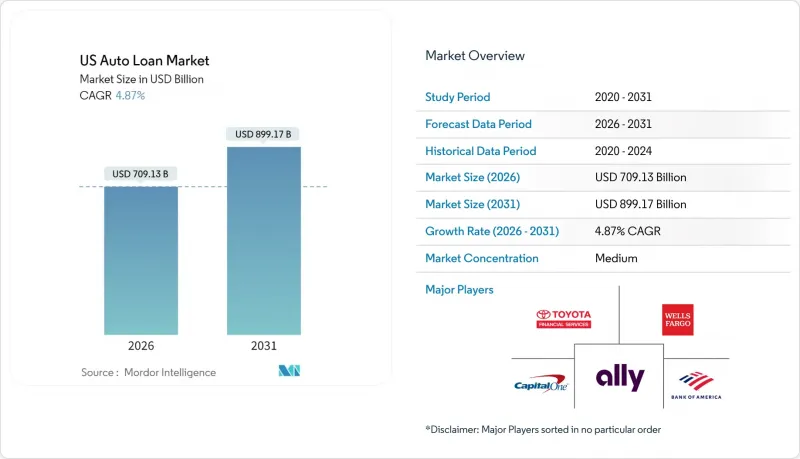
美國汽車貸款市場預計將從 2025 年的 6,762 億美元成長到 2026 年的 7,091.3 億美元,到 2031 年達到 8,991.7 億美元,2026 年至 2031 年的複合年成長率為 4.87%。
儘管信貸標準日益收緊,但不斷上漲的車輛價格、下降的聯邦基金利率以及快速的數位化,仍然維持了汽車融資的需求。二手車融資仍然是市場主導,因為新車的平均價格已經超出了許多中等收入家庭的負擔範圍。隨著替代性數據驅動型信用評估方法的出現,金融科技參與企業正經歷著快速成長,這些方法為信用評級接近優質和次級的借款人提供了更多貸款機會。輕型卡車的普及推高了平均貸款額,而負責最後一公里配送的車隊營運商對商用車的需求也不斷增加。由於借款人希望在總利息成本上升的情況下仍能控制每月還款額,五年以上的長期貸款變得越來越普遍。
美國汽車貸款市場趨勢與分析
車輛價格上漲推高了平均貸款額。
到2024年,平均交易價格將超過48,000美元,迫使借款人將還款期限延長至72個月以上,以確保其償還能力。雖然貸款機構樂見本金餘額增加,因為這能提供終身利息收入,但他們也在累積儲備金,以彌補違約時面臨的更大損失。價格上漲正加速消費者轉向二手車,二手車以大幅折扣提供類似的實用性。半導體等關鍵零件的供不應求將持續限制新車生產至2025年,加劇價格壓力。為了控制風險,貸款機構現在越來越依賴收入驗證演算法,當房價收入比超過15%時,這些演算法會發出警告。
貸款執行和篩選流程的數位化
機器學習引擎可在兩分鐘內做出信貸決策,從而將人工審核成本降低 30%。與人工審核相比,它可將貸款盈利提高 10.2%,同時將逾期率降低 6.8%。貸款機構、分銷商和電商平台之間的 API 整合實現了「一站式」購買和貸款流程,顯著降低了放棄率。數位化工作流程還有助於擴大地域覆蓋範圍,使社區銀行無需建立分店網路即可在多個州獲取客戶。在經濟低迷時期,雲端原生貸款發起流程的成本優勢有助於貸款機構抵禦競爭對手的折扣,從而保護其淨利差。這些平台中的合規模組會隨著聯邦指南的變更自動更新,從而降低法律風險和審核發現。
聯準會升息推高借貸成本
一波又一波的升息浪潮已將汽車貸款的平均年利率(APR)推高至2024年底的7%以上,導致合格的借款人數量減少近五分之一。次級貸款申請人如今面臨兩位數的利率,迫使許多人轉向本地商店和共乘服務。貸款機構的因應措施是將還款期限延長至84個月,但這抑制了借款人的資本積累,並導致貸款價值比(LTV)在發放時超過110%。信用合作社利用低成本存款資金維持低於大型銀行的利率,從而刺激了本地再融資需求的成長。經銷商則透過增加廠商現金獎勵來應對,再次將成本轉嫁給汽車製造商的專屬融資子公司。
細分市場分析
到2025年,乘用車貸款將占美國汽車貸款市場的86.25%,這主要得益於家庭對私家車的持續依賴。然而,受電子商務擴張和零工經濟叫車平台蓬勃發展帶來的小包裹量成長的推動,商用車市場預計到2031年將以6.08%的複合年成長率成長。需求主要集中在用於最後一公里配送、宅配服務和行動維修的3-5級卡車和貨車上。專業貸款機構正在將遠端資訊處理技術納入貸款契約,以追蹤運作週期並促進預防性維護,從而保障抵押品的價值。柴油燃料成本的上漲和排放氣體嚴格的排放法規正在推動車隊電氣化,這為電池租賃輔助服務創造了一個新的細分市場。
商業貸款承銷涵蓋個人和企業信用,除了FICO信用評分外,還需要進行現金流量分析。銀行利用與小型企業的財務關係,交叉銷售設備貸款和企業支票帳戶,以確保穩定的存款。金融科技公司利用即時銷售點資料的現金流量抓取技術,評估沒有傳統財務報表的個體經營者的承銷資格。提供停工保障的補充保險越來越普遍,即使運作運作也能穩定償付能力。受郊區和農村地區物流需求成長的推動,美國商業資產汽車貸款市場預計將比乘用車貸款餘額增加更快。
到2025年,包括轎車、掀背車和跨界車在內的乘用車將占美國汽車貸款市場的87.35%,而皮卡和小型貨車到2031年將以7.05%的複合年成長率成長。由於半導體短缺導致需求延遲,經銷商的預訂名單一直延續到2025年交付,從而保持了強勁的銷售管道。生活方式行銷將皮卡定位為家庭用車和週末探險裝備,有助於擴大其客戶群。為此,汽車製造商旗下的金融公司正在推出按車型分類的殘值表,並為選擇高殘值選配包的購車者提供優惠待遇。
燃油經濟法規促使汽車製造商為皮卡配備更小的渦輪增壓引擎和混合動力傳動系統,雖然略微降低了營運成本,但也使得更高的廠商建議零售價(MSRP)更容易被消費者接受。二手市場分析顯示,三年車齡的雙排座皮卡仍能維持新車價值的65%至70%,而大型轎車的保值率僅為50%至55%,降低了貸款機構的損失風險。因此,隨著風險回報比仍然具有吸引力,皮卡在美國汽車貸款市場的佔有率自然而然地不斷成長。同時,由於季節性使用限制和保險公司的約束,摩托車和三輪車的融資仍然是一個小眾市場。
其他福利:
- Excel格式的市場預測(ME)表
- 分析師支持(3個月)
目錄
第1章 引言
- 研究假設和市場定義
- 調查範圍
第2章調查方法
第3章執行摘要
第4章 市場情勢
- 市場概覽
- 市場促進因素
- 車輛價格上漲推高了平均貸款額。
- 貸款篩選和核准流程的數位化
- 電動車銷量的成長將推動對新型金融產品的需求。
- 輕型卡車的優勢推高了平均購買價格。
- 線上汽車交易平台中的嵌入式金融
- 基於遠端資訊處理的風險定價推動次貸市場成長
- 市場限制
- 聯準會升息導致借貸成本上升
- 拖欠率和違約率上升
- 出行訂閱服務會抑制汽車擁有率。
- 消費者金融保護局(CFPB)的資料共用和收費規定擠壓了輔助收入。
- 價值/供應鏈分析
- 監管環境
- 技術展望
- 波特五力模型
- 買方的議價能力
- 供應商的議價能力
- 新進入者的威脅
- 替代品的威脅
- 競爭對手之間的競爭
第5章 市場規模與成長預測
- 按車輛類型
- 搭乘用車
- 商用車輛
- 按車型
- 摩托車和Scooter
- 乘用車(掀背車、轎車、SUV 等)
- 皮卡和小型貨車
- 卡車和巴士
- 其他
- 依所有權類型
- 新車
- 二手車
- 按提供者類型
- 銀行
- 非銀行金融機構
- OEM
- 其他類型的服務提供者(金融科技公司)
- 持有期間
- 不到3年
- 3-5年
- 5年或以上
第6章 競爭情勢
- 市場集中度
- 策略趨勢
- 市佔率分析
- 公司簡介
- Ally Financial
- Capital One Auto Finance
- Bank of America
- Toyota Financial Services
- Wells Fargo Dealer Services
- Chase Auto
- Santander Consumer USA
- GM Financial
- Ford Credit
- US Bank
- PNC Bank
- Nissan-Infiniti Finance
- TD Auto Finance
- Hyundai Capital America
- Subaru Motors Finance
- Credit Acceptance Corp
- CarMax Auto Finance
- DriveTime
- LendingTree
- Carvana Finance
第7章 市場機會與未來展望
The US Auto Loan Market is expected to grow from USD 676.20 billion in 2025 to USD 709.13 billion in 2026 and is forecast to reach USD 899.17 billion by 2031 at 4.87% CAGR over 2026-2031.
Rising vehicle prices, lower federal funds rates, and rapid digitalization keep demand for vehicle financing steady, even as credit standards tighten. Used-vehicle financing maintains clear leadership because average new-vehicle prices have climbed beyond the reach of many middle-income households. Fintech entrants grow briskly on the back of alternative data underwriting that opens credit access to near-prime and sub-prime borrowers. Commercial vehicles attract heightened interest from fleets serving last-mile delivery, while light-truck popularity pushes average ticket size up. Longer loan tenures above five years are gaining traction as borrowers try to keep monthly instalments manageable despite higher total interest outlays.
US Auto Loan Market Trends and Insights
Rising Vehicle Prices Inflating Average Loan Amounts
Average transaction prices climbed above USD 48,000 in 2024, forcing borrowers to stretch repayment horizons beyond 72 months for affordability[. Lenders welcome the higher principal balances because lifetime interest income rises, yet they also raise reserves as loss severity grows when defaults occur. Higher pricing accelerates the consumer pivot toward used vehicles, where comparable utility is available at sizeable discounts. Supply shortages of critical components such as semiconductors continue to constrain new-vehicle output through 2025, keeping price pressure elevated. Lenders now rely more heavily on income-verification algorithms that flag price-to-income ratios breaching 15% to limit exposure.
Digitization of Loan Origination & Approval Processes
Machine-learning engines deliver credit decisions in under two minutes and cut manual underwriting costs by 30%, producing 10.2% higher loan profitability with 6.8% fewer defaults than human review. API links among lenders, dealerships, and e-commerce portals enable a single-screen "shop-and-finance" journey that slashes abandonment rates. Digital workflows also boost geographic reach, letting regional banks acquire customers several states away without branch infrastructure. During economic slowdowns, the cost advantage of cloud-native origination helps lenders protect net-interest margins against competitive discounting. Compliance modules within these platforms auto-update when federal guidance changes, reducing legal risk and audit findings.
Federal Reserve Rate Hikes Raising Borrowing Costs
Successive rate hikes pushed average auto-loan APRs beyond 7% by late 2024, shrinking the qualified borrower pool by roughly one-fifth. Sub-prime applicants now face double-digit pricing, driving many toward buy-here-pay-here outlets or ride-sharing alternatives. Lenders counter by lengthening terms to 84 months, though that undermines equity build-up and raises loan-to-value ratios above 110% at origination. Credit unions leverage cheaper deposit funding to hold rates lower than large banks, fuelling regional refinancing waves. Dealers respond with bigger manufacturer cash incentives that shift the cost burden back onto OEMs' captive finance subsidiaries.
Other drivers and restraints analyzed in the detailed report include:
- Growth in EV Sales Demanding New Financing Products
- Light-Truck Dominance Boosting Average Ticket Size
- Rising Delinquency & Default Rates
For complete list of drivers and restraints, kindly check the Table Of Contents.
Segment Analysis
Passenger-vehicle loans accounted for 86.25% of the US auto loan market size in 2025 because households still rely heavily on private mobility. Nonetheless, the commercial-vehicle slice is set to expand at a 6.08% CAGR through 2031 as e-commerce accelerates parcel volumes and gig-driving platforms proliferate. Demand concentrates on Class 3-5 trucks and cargo vans used for last-mile delivery, courier services, and mobile workshops. Specialized lenders integrate telematics into loan covenants, tracking duty cycles and encouraging preventive maintenance that preserves collateral value. Rising diesel expenses and emissions regulations encourage fleet electrification, opening an adjacent niche for battery-lease overlays.
Commercial underwriting straddles personal and business credit, requiring cash-flow analyses alongside FICO scores. Banks leverage treasury relationships with small firms to cross-sell equipment loans and business checking accounts, locking in sticky deposits. Fintechs deploy cash-flow scraping of real-time POS data to evaluate sole-proprietor applicants who lack traditional statements. Insurance add-ons that guarantee downtime coverage gain popularity, smoothing payment capacity if trucks sit idle. The US auto loan market size for commercial assets will therefore compound faster than passenger balances as logistics intensity rises across suburban and rural ZIP codes.
Cars-including sedans, hatchbacks, and crossovers-accounted for 87.35% of the US auto loan market size in 2025, yet pickup trucks and small vans will expand at 7.05% CAGR through 2031. Pent-up demand from semiconductor shortages means dealerships carry reservation lists that still roll into 2025 deliveries, sustaining pipeline visibility. Lifestyle marketing frames pickups as family haulers and weekend adventure gear, broadening their demographic appeal. Captive finance units respond with trim-level-specific residual-value tables that reward buyers choosing option packages with historically strong resale.
Fuel economy regulations push OEMs to fit smaller turbo engines and hybrid powertrains into pickups, slightly improving operating costs and making higher MSRPs more palatable. Secondary-market analytics show three-year-old crew-cab trucks retaining 65-70% of their original value, superior to large sedans at 50-55%, reducing lender loss severity. The US auto loan market share of pickups thus grows organically as risk-reward metrics stay attractive. Conversely, motorcycle and three-wheeler financing remains niche, limited by seasonal usage and insurer constraints.
The US Auto Loan Market Report is Segmented by Vehicle Type (Passenger Vehicle, Commercial Vehicle), Vehicle Model (Motorcycles/Scooters, Cars, and More), Ownership (New Vehicles, Used Vehicles), Provider Type (Banks, Non-Banking Financial Institutions, and More), and Tenure (Less Than 3 Years, 3-5 Years, and More). The Market Forecasts are Provided in Terms of Value (USD).
List of Companies Covered in this Report:
- Ally Financial
- Capital One Auto Finance
- Bank of America
- Toyota Financial Services
- Wells Fargo Dealer Services
- Chase Auto
- Santander Consumer USA
- GM Financial
- Ford Credit
- US Bank
- PNC Bank
- Nissan-Infiniti Finance
- TD Auto Finance
- Hyundai Capital America
- Subaru Motors Finance
- Credit Acceptance Corp
- CarMax Auto Finance
- DriveTime
- LendingTree
- Carvana Finance
Additional Benefits:
- The market estimate (ME) sheet in Excel format
- 3 months of analyst support
TABLE OF CONTENTS
1 Introduction
- 1.1 Study Assumptions & Market Definition
- 1.2 Scope of the Study
2 Research Methodology
3 Executive Summary
4 Market Landscape
- 4.1 Market Overview
- 4.2 Market Drivers
- 4.2.1 Rising vehicle prices inflating average loan amounts
- 4.2.2 Digitization of loan origination & approval processes
- 4.2.3 Growth in EV sales demanding new financing products
- 4.2.4 Light-truck dominance boosting average ticket size
- 4.2.5 Embedded finance within online car marketplaces
- 4.2.6 Telematics-based risk pricing unlocking sub-prime growth
- 4.3 Market Restraints
- 4.3.1 Federal-Reserve rate hikes raising borrowing costs
- 4.3.2 Rising delinquency & default rates
- 4.3.3 Mobility subscriptions reducing auto-ownership appetite
- 4.3.4 CFPB data-sharing & fee rules squeezing ancillary income
- 4.4 Value / Supply-Chain Analysis
- 4.5 Regulatory Landscape
- 4.6 Technological Outlook
- 4.7 Porter's Five Forces
- 4.7.1 Bargaining Power of Buyers
- 4.7.2 Bargaining Power of Suppliers
- 4.7.3 Threat of New Entrants
- 4.7.4 Threat of Substitutes
- 4.7.5 Intensity of Competitive Rivalry
5 Market Size & Growth Forecasts (Value)
- 5.1 By Vehicle Type
- 5.1.1 Passenger Vehicle
- 5.1.2 Commercial Vehicle
- 5.2 By Vehicle Model
- 5.2.1 Motorcycles/Scooters
- 5.2.2 Cars (Hatchbacks, Sedans, SUVs, etc.)
- 5.2.3 Pickups and Small Vans
- 5.2.4 Trucks and Buses
- 5.2.5 Others
- 5.3 By Ownership
- 5.3.1 New Vehicles
- 5.3.2 Used Vehicles
- 5.4 By Provider Type
- 5.4.1 Banks
- 5.4.2 Non-Banking Financial Institutions
- 5.4.3 Original Equipment Manufacturers
- 5.4.4 Other Provider Types (Fintech Companies)
- 5.5 By Tenure
- 5.5.1 Less than 3 Years
- 5.5.2 3-5 Years
- 5.5.3 More than 5 years
6 Competitive Landscape
- 6.1 Market Concentration
- 6.2 Strategic Moves
- 6.3 Market Share Analysis
- 6.4 Company Profiles (includes Global Level Overview, Market Level Overview, Core Segments, Financials as available, Strategic Information, Market Rank/Share for Key Companies, Products & Services, and Recent Developments)
- 6.4.1 Ally Financial
- 6.4.2 Capital One Auto Finance
- 6.4.3 Bank of America
- 6.4.4 Toyota Financial Services
- 6.4.5 Wells Fargo Dealer Services
- 6.4.6 Chase Auto
- 6.4.7 Santander Consumer USA
- 6.4.8 GM Financial
- 6.4.9 Ford Credit
- 6.4.10 US Bank
- 6.4.11 PNC Bank
- 6.4.12 Nissan-Infiniti Finance
- 6.4.13 TD Auto Finance
- 6.4.14 Hyundai Capital America
- 6.4.15 Subaru Motors Finance
- 6.4.16 Credit Acceptance Corp
- 6.4.17 CarMax Auto Finance
- 6.4.18 DriveTime
- 6.4.19 LendingTree
- 6.4.20 Carvana Finance
7 Market Opportunities & Future Outlook
- 7.1 White-Space & Unmet-Need Assessment
 汽車金融市場-全球產業規模、佔有率、趨勢、機會與預測:按車輛類型、供應商、地區和競爭對手分類,2021-2031年
 汽車金融市場預測至2034年-全球分析(按提供者、用途、融資方式、資金來源、服務、車輛類型和地區分類)
 汽車金融市場:2026-2032年全球市場預測(依客戶類型、貸款形式、信用評級、車輛類型及銷售管道)
 全球汽車金融市場規模、佔有率、趨勢和成長分析報告(2026-2034)汽車金融市場規模、佔有率、成長及全球產業分析:按類型、應用和地區分類的洞察,2026-2034 年預測人工智慧驅動的殘值預測市場:策略洞察與預測(2026-2031)汽車里程融資市場:策略性洞察與預測(2026-2031 年)租賃,2035:未來出行金融
 汽車金融:市場佔有率分析、產業趨勢與統計、成長預測(2026-2031)全球汽車租賃服務市場規模、佔有率、趨勢和成長分析報告(2026-2034)