


 |
市場調查報告書
商品編碼
1934610
汽車金融:市場佔有率分析、產業趨勢與統計、成長預測(2026-2031)Automotive Financing - Market Share Analysis, Industry Trends & Statistics, Growth Forecasts (2026 - 2031) |
||||||
※ 本網頁內容可能與最新版本有所差異。詳細情況請與我們聯繫。
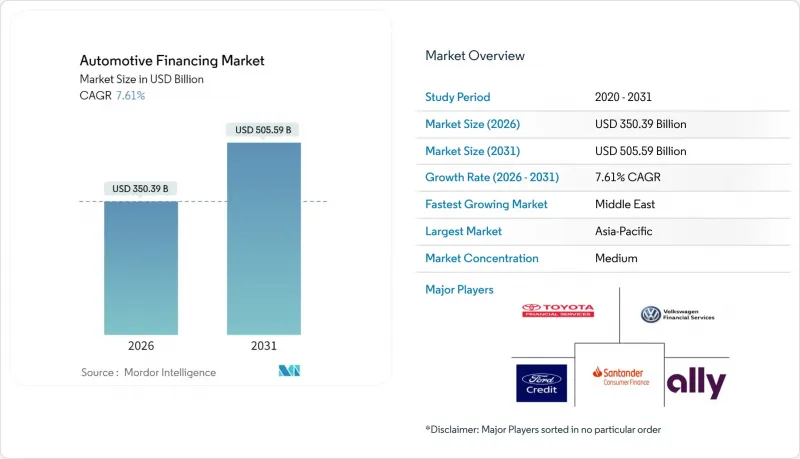
預計汽車金融市場規模將從 2025 年的 3,256.2 億美元成長到 2026 年的 3,503.9 億美元,預計到 2031 年將達到 5055.9 億美元,2026 年至 2031 年的複合年成長率為 7.61%。
二手車貸款目前已佔汽車金融市場的53.40%,並以9.2%的快速成長,預計到2030年仍將是主要的成長引擎。儘管基準利率居高不下,但數位借貸平台的激增、消費者對靈活支付方式日益成長的需求以及汽車電氣化程度的提高,共同推動了二手車貸款市場的成長勢頭。 [1] 貸款機構正透過深化分析能力、拓展基於風險的定價模式以及與線上汽車零售平台合作來維持貸款業務的穩定。此外,將融資與增值出行服務(例如訂閱套餐和電池租賃)相結合的能力,也正成為銀行、汽車製造商金融公司和新興金融科技參與企業的關鍵競爭優勢。
全球汽車金融市場趨勢與洞察
快速發展的線上汽車銷售平台推動即時數位貸款
2024年,北美經銷商和貸款機構的數位化交易量較去年同期成長顯著。消費者現在預期線上購車後10分鐘內即可獲得貸款即時核准,與2023年常見的1至2天核准時間相比,數字大幅下降。整合利率比較Widgets的引入提高了價格透明度,擠壓了那些沒有自動定價工具的貸款機構的利潤空間。這一趨勢也蔓延至歐洲,在歐洲,多貸款機構API的引入使豪華車領域的平均貸款發放時間縮短了48%。在汽車製造商金融領域,將專有的金融計算器嵌入到OEM(原始設備製造商)的電子商務入口網站中,促進了保險和維護合約的交叉銷售,提高了附加率和客戶終身價值。
二手車交易量的增加催生了新的融資需求。
認證二手車專案正在改變消費者對二手車的認知,使貸款機構能夠提供更接近新車的貸款額價值比 (LTV) 和利率。例如,起亞的六年全險認證二手車保固服務使其在美國的二手車銷售佔比在 2024 年提高了 5 個百分點。在歐洲,供應鏈中斷後庫存恢復正常,二手車供應量也隨之回升,推動二手車平均貸款額年增 14%。將即時融資服務整合到二手車市場,使消費者能夠在到店前鎖定利率,從而縮短銷售流程,降低貸款放棄率,並提高貸款成交率。
央行升息給淨利差帶來壓力
截至2025年5月,美國政策利率徘徊在4.25%至4.5%的區間。不斷上升的資金籌措成本擠壓了貸款利差,導致銀行2024年新增汽車貸款餘額下降了3.4%。傳統上提供具有競爭力利率的信用合作社縮減了72個月固定利率產品的供應,引導借款人選擇更短的還款期限。在製造商獎勵的支持下,汽車金融公司承擔了部分利率壓力以維持展示室客流量,從而擴大了市場佔有率。在歐洲,歐洲央行升息的滯後影響同樣抑制了淨利息收入,迫使貸款機構採用分級利率結構,將風險成本轉移給信用評等較低的借款人。
細分市場分析
預計二手車在汽車金融市場中的佔有率將繼續擴大,到2025年將佔整個市場的53.10%,複合年成長率(CAGR)為9.02%,超過整體市場成長率。認證二手專案正在使保固服務普及化,讓貸款機構將準新車視為低風險抵押品。數位化市場規模的進一步擴大,貸款Widgets整合到主要入口網站後,申請到核准的轉換率提高了30%以上。因此,預計到2031年,二手車市場規模將超過2,917億美元。
不斷上漲的購車成本令一些優質借款人對購買新車望而卻步。 2025年初,新車的平均月供已達742美元。為了因應價格上漲,經銷商紛紛提案長期融資和租賃方案。然而,股權(即資產價值低於貸款餘額)的置換車輛比例不斷增加,使得殘值計算變得更加複雜。儘管新車通路仍佔據46.90%的市場佔有率,但成長放緩迫使貸款機構調整風險調整後的定價策略,並考慮捆綁保險產品,以在二手內燃機汽車(ICE)市場二手的情況下保障車輛的轉售價值。
到2025年,銀行將佔據汽車金融市場46.05%的佔有率,但隨著汽車製造商(OEM)旗下金融子公司的崛起,其主導地位正在下降。預計2026年至2031年,汽車製造商金融業務將以8.02%的複合年成長率成長,這主要得益於購車流程的整合以及優惠年利率的促銷活動。光是大眾汽車金融服務公司預計在2024年就將簽署1,030萬份新契約,使其市場滲透率提升至34.1%。信用合作社在汽車金融市場的佔有率預計將維持在20.10%左右,這主要得益於會員忠誠度和二手車貸款的優惠價格。
非銀行金融公司佔剩餘的15.05%,它們利用另類資料觸達信用記錄不佳的客戶。與分店銀行相比,低成本的數位化模式可將貸款發放成本降低高達40%,而內建的金融API則使電商平台能夠快速推出自有品牌的汽車貸款服務,從而推動業務量成長。對於傳統銀行而言,成本收入比仍將受到密切關注,而諸如承保自動化、簡化文件工作流程以及與專業金融科技公司合作等戰略舉措,對於其在更廣泛的汽車金融行業中保持競爭力至關重要。
區域分析
亞太地區仍將是最具影響力的地區,到2025年將佔據全球汽車金融市場41.00%的佔有率。中國電動車的蓬勃發展(預計到2024年將佔新車銷售的近一半)以及印度在FAME計畫下推出的500億美元電動車融資藍圖,確保了信貸需求的持續成長。數位化優先的信用評估、即時信用數據以及基於人工智慧的詐欺防範措施,使得先前缺乏正式信用記錄的借款人也能獲得貸款。隨著政府對報廢車輛的誘因不斷擴大,貸款規模也變得更加穩健。例如,中國在推出10%的補貼計畫僅六個月後,汽車更換購買量就成長了14%。
到2024年第四季,汽車貸款餘額將達到1.66兆美元,拖欠率將達2.96%。貸款機構正在收緊信貸標準、提高首付比例,並投資預測分析以防止貸款損失。同時,美國汽車金融市場正受益於創新的金融科技合作,這些合作縮短了資金籌措週期,並將銷售點融資服務擴展到了線上市場。專屬貸款機構正在將遠端維護合約與預測性服務提醒捆綁在一起,以保護抵押品價值並提高轉售價值。
中東是成長最快的地區,預計到2031年將以10.29%的複合年成長率成長。沙烏地阿拉伯的銀行信貸在2025年3月達到8,272億美元,其符合伊斯蘭教法的汽車貸款組合也持續以兩位數的速度成長。政府的經濟多元化政策優先發展交通出行,推動了對個人貸款和經營租賃產品的需求。數位化正在加速,沿岸地區35%的新車融資申請目前都是透過行動優先平台完成的。該地區的汽車金融業也受惠於其年輕的人口結構,海灣合作理事會成員國超過55%的公民年齡在35歲以下。靈活的訂閱模式深受這群人青睞,正在改變產品設計。
歐洲的法規環境正在改變。英國最高法院對未揭露佣金做法的審查可能會改變經銷商和租賃公司之間的經濟關係,從而縮小利率差。電池租賃專案正在興起,該專案將高價值電池組的所有權與車輛的所有權分離,有助於金融機構降低殘值風險。斯堪地那維亞國家採用與融資合約掛鉤的按收費付費保險,顯示遠端資訊處理數據可以作為風險調整定價的基礎。
在南美洲和非洲,政策利率上升和貨幣波動正在抑制消費者的購買意願,而基於人工智慧的替代信用評分系統則正在開拓新的借款人群體。在撒哈拉以南非洲,由於分店分行稀少,行動支付的普及正在加速貸款償還。隨著全球金融機構向這些地區擴張,它們正與當地的小額信貸機構和電信業者錢包服務商合作,建立混合融資結構,將風險分散到多個出資方。在汽車金融市場,面向叫車駕駛人的輕資產訂閱車隊預計將會普及,這將有助於建立正式的信用記錄,從而為未來的個人購車提供支援。
其他福利:
- Excel格式的市場預測(ME)表
- 3個月的分析師支持
目錄
第1章 引言
- 研究假設和市場定義
- 調查範圍
第2章調查方法
第3章執行摘要
第4章 市場情勢
- 市場概覽
- 市場促進因素
- 北美線上汽車銷售平台的快速成長推動了對即時數位貸款的需求
- 歐洲二手車交易量的成長和認證二手車專案的推出,帶動了新的貸款業務量。
- 亞太地區電動汽車租賃和訂閱模式的快速成長將推動專屬融資服務的普及。
- 政府的報廢獎勵和綠色金融補貼促進了中國和歐盟的汽車貸款發放。
- OEM直接融資公司「先買後付」和靈活的尾款支付產品在新興市場的擴張
- 另類數據和基於人工智慧的信用評分系統正在幫助南美洲的次級貸款借款人。
- 市場限制
- 2023年起,央行升息將對汽車貸款機構的淨利差構成壓力。
- 美國次級汽車貸款違約率上升正在限制銀行的信貸風險接受度。
- 印度和巴西的汽車貸款價值比(LTV)上限限制了貸款規模。
- 在電動車轉型過程中,內燃機(ICE)的折舊風險削弱了殘值假設。
- 波特五力分析
- 新進入者的威脅
- 買方的議價能力
- 供應商的議價能力
- 替代品的威脅
- 競爭對手之間的競爭
第5章 市場規模與成長預測
- 按類型
- 新車
- 二手車
- 按來源類型
- 專屬原廠金融方案
- 銀行
- 信用社
- 非銀行金融機構
- 按車輛類型
- 搭乘用車
- 商用車輛
- 透過貸款產品
- 貸款
- 租
- 氣球式付款
- 訂閱
- 按地區
- 北美洲
- 美國
- 加拿大
- 北美其他地區
- 南美洲
- 巴西
- 阿根廷
- 其他南美洲
- 歐洲
- 德國
- 英國
- 法國
- 義大利
- 西班牙
- 俄羅斯
- 其他歐洲地區
- 亞太地區
- 中國
- 日本
- 印度
- 韓國
- 印尼
- 越南
- 菲律賓
- 澳洲
- 紐西蘭
- 亞太其他地區
- 中東
- 沙烏地阿拉伯
- 阿拉伯聯合大公國
- 土耳其
- 其他中東地區
- 非洲
- 南非
- 奈及利亞
- 埃及
- 其他非洲地區
- 北美洲
第6章 競爭情勢
- 市場集中度
- 策略趨勢
- 市佔率分析
- 公司簡介
- Bank of America Corp.
- Ally Financial Inc.
- Hitachi Capital Corp.
- HDFC Bank Ltd.
- Bank of China
- Capital One Financial Corp.
- Wells Fargo & Co.
- Toyota Financial Services
- BNP Paribas SA
- Volkswagen Financial Services AG
- Mercedes-Benz Financial Services
- Standard Bank Group
- Mahindra Finance Ltd.
- Santander Consumer Finance
- General Motors Financial Company, Inc.
- Ford Motor Credit Co.
- Mitsubishi UFJ Lease & Finance Ltd.
- DBS Bank Ltd.
- Hyundai Capital Ltd.
第7章 市場機會與未來展望
The Automotive Finance market is expected to grow from USD 325.62 billion in 2025 to USD 350.39 billion in 2026 and is forecast to reach USD 505.59 billion by 2031 at 7.61% CAGR over 2026-2031.
Used-car financing, which already commands 53.40% of the automotive financing market, is growing at a rapid 9.2% pace and is set to remain the key growth engine through 2030. Digital origination platforms, heightened consumer appetite for flexible payment structures, and the continued electrification of vehicle fleets are together sustaining momentum even while benchmark rates remain elevated.[1]Lenders are responding by deepening analytics capabilities, widening risk-based pricing, and partnering with online auto-retail marketplaces to keep credit flowing. The ability to combine financing with value-added mobility services, such as subscription packages and battery leasing, is also becoming a decisive competitive lever for banks, OEM captives, and fintech entrants alike.
Global Automotive Financing Market Trends and Insights
Surging Online Auto-Retail Platforms Driving Instant Digital Financing
Digitized contracting volumes among dealers and lenders in North America surged year-on-year in 2024. Consumers now expect real-time credit approvals delivered inside a 10-minute online purchase journey, a dramatic acceleration from the 1-2-day turnaround common in 2023. Integrated rate-shopping widgets have heightened price transparency, squeezing margins for lenders that lack automated pricing tools. The trend is spreading to Europe, where multi-lender APIs have cut average time-to-funding by 48% in premium segments. For captive finance arms, embedding proprietary finance calculators inside OEM e-commerce portals is improving cross-selling of insurance and maintenance contracts, thereby lifting attachment rates and customer lifetime value.
Rising Used-Car Transactions Creating New Lending Volume
Certified pre-owned programs are reshaping consumer perceptions of second-hand vehicles, enabling lenders to offer loan-to-value ratios and rates closer to those on new cars. Kia's six-year bumper-to-bumper CPO warranty, for example, bolstered used-car penetration in the marque's U.S. portfolio by five percentage points in 2024. In Europe, inventory normalization after supply-chain shocks has restored late-model availability, pushing the average financed ticket size for used vehicles up 14% year-on-year. As used-car marketplaces integrate instant finance offers, origination conversion improves because consumers can lock rates before visiting a dealership, thereby shortening the sales funnel and reducing loan abandonment rates.
Central-Bank Rate Hikes Compressing Net-Interest Margins
Policy rates in the United States remain in a 4.25-4.5% corridor as of May 2025. The higher funding cost has squeezed lender spreads; new-auto loan balances at banks fell 3.4% in 2024. Credit unions, traditionally rate-competitive, cut long-term fixed offers for 72-month terms, nudging borrowers toward shorter tenors. Captive finance entities, cushioned by manufacturer incentives, absorbed part of the rate pressure to sustain showroom traffic, explaining their share gains. In Europe, the lagged pass-through of European Central Bank hikes is similarly dampening net-interest income, forcing originators to introduce tiered-rate structures that pass risk costs to lower-quality borrowers.
Other drivers and restraints analyzed in the detailed report include:
- Rapid Growth of EV Leasing & Subscription Models Catalyzing Finance Penetration
- Government Scrappage Incentives & Green-Finance Subsidies
- Rising Delinquency Rates Constraining Credit Appetite
For complete list of drivers and restraints, kindly check the Table Of Contents.
Segment Analysis
The used-vehicle slice of the automotive financing market generated 53.10% of the automotive financing market in 2025 and will continue to widen its lead because its 9.02% CAGR exceeds overall market growth. Certified pre-owned programs have mainstreamed warranty coverage, letting lenders treat near-new units more like prime-risk collateral. Digital marketplaces further amplify scale: integrated loan widgets on leading portals lift application-to-approval conversion by more than 30%. As a result, the automotive financing market size for the used-segment is projected to top USD 291.7 billion by 2031.
Affordability headwinds are steering some prime borrowers away from new vehicles; average new-car payments hit USD 742 early in 2025. To mitigate sticker shock, dealers are pitching longer-term loans and leasing packages. However, the proportion of negative-equity trade-ins is rising, complicating residual-value mathematics. Although the new-vehicle channel retains 46.90% share, its slower growth will compel lenders to refine risk-adjusted pricing and to consider bundled insurance products that protect resale values in a softening ICE resale environment.
Banks generated 46.05% of the automotive financing market size in 2025, yet captive finance arms are eroding that lead. Captives are forecast to post an 8.02% CAGR from 2026 to 2031 as they leverage purchase-journey integration and subsidized APR promotions. Volkswagen Financial Services alone wrote 10.3 million new contracts in 2024, boosting penetration to 34.1%. The automotive financing market share of credit unions hovers near 20.10%, helped by member loyalty and competitive pricing on used-vehicle loans.
Non-bank financial companies contribute the balance 15.05%, using alternative data to expand into thin-file demographics. Their low-overhead digital models cut origination expense by up to 40% versus branch-centric banks. Embedded-finance APIs also allow e-commerce players to launch branded auto-loan offerings rapidly, driving incremental volume. For traditional banks, cost-to-income ratios will remain under scrutiny, setting a strategic imperative to automate underwriting, streamline document workflows and partner with fintech specialists to stay relevant in the broader automotive finance industry.
The Automotive Financing Market Report is Segmented by Type (New Vehicle and Used Vehicle), Source Type (OEM Captive Finance, Banks, and More), Vehicle Type (Passenger Cars and Commercial Vehicles), Financing Product (Loan, Lease, and More), and Geography (North America, South America, and More). The Market Sizes and Forecasts are Provided in Terms of Value (USD).
Geography Analysis
Asia-Pacific retained a 41.00% share of the automotive financing market in 2025 and remains the most influential region. China's EV boom, with EVs capturing nearly half of new-car sales in 2024, coupled with India's USD 50 billion EV-finance roadmap under the FAME scheme, ensures prolonged credit-demand growth. Digital-first underwriting, real-time bureau data, and AI-based fraud controls enable lenders to serve borrowers who previously lacked formal credit files. As governments expand scrappage incentives, loan volume elasticity is rising; a 10% rebate in China triggered a 14% jump in financed replacement purchases in just six months.
Auto-loan balances climbed to USD 1.66 trillion by Q4 2024, even as delinquency transitions reached 2.96%. Lenders are tightening credit tiers, boosting down-payment requests, and investing in predictive analytics to pre-empt charge-offs. The automotive financing market size in the United States nonetheless benefits from innovative fintech collaborations that shorten funding cycles and extend point-of-sale loan offers into online marketplaces. Captive lenders are bundling tele-maintenance subscriptions that send predictive service reminders, protecting collateral, and improving resale values.
The Middle East is the fastest-growing territory, projected to advance at a 10.29% CAGR to 2031. Saudi banking credit reached USD 827.2 billion in March 2025, with Shariah-compliant auto-loan portfolios expanding in double digits. Government diversification agendas prioritize mobility, sparking demand for both personal loans and operating-lease products. Digitalization levels are accelerating; mobile-first platforms now account for 35% of new auto applications in the Gulf. The automotive finance industry in the region also benefits from a young demographic, more than 55% of GCC citizens are under 35, whose preference for flexible subscription models is reshaping product design.
Europe region's regulatory environment is evolving; the UK Supreme Court's review of undisclosed commission practices could alter dealer-lender economics, potentially lowering rate spreads. Battery-lease programs that detach ownership of high-value packs from the vehicle are emerging, helping finance providers de-risk residual-value exposure. Scandinavia's embrace of pay-per-kilometre insurance tied to finance contracts illustrates how telematics data can underpin risk-adjusted pricing.
South America and Africa elevated policy rates and currency volatility pose affordability challenges, yet AI-driven alternative credit scoring is unlocking new borrower pools. Mobile money integration accelerates loan payments in sub-Saharan Africa, where branch infrastructure remains thin. For global lenders, entering these regions often requires partnering with local microfinance institutions or telco wallets, creating blended-finance structures that dilute risk across multiple capital providers. The automotive financing market is expected to see wider adoption of asset-light subscription fleets for ride-hail drivers, fostering formal credit histories that can support future personal-vehicle purchases.
- Bank of America Corp.
- Ally Financial Inc.
- Hitachi Capital Corp.
- HDFC Bank Ltd.
- Bank of China
- Capital One Financial Corp.
- Wells Fargo & Co.
- Toyota Financial Services
- BNP Paribas SA
- Volkswagen Financial Services AG
- Mercedes-Benz Financial Services
- Standard Bank Group
- Mahindra Finance Ltd.
- Santander Consumer Finance
- General Motors Financial Company, Inc.
- Ford Motor Credit Co.
- Mitsubishi UFJ Lease & Finance Ltd.
- DBS Bank Ltd.
- Hyundai Capital Ltd.
Additional Benefits:
- The market estimate (ME) sheet in Excel format
- 3 months of analyst support
TABLE OF CONTENTS
1 Introduction
- 1.1 Study Assumptions & Market Definition
- 1.2 Scope of the Study
2 Research Methodology
3 Executive Summary
4 Market Landscape
- 4.1 Market Overview
- 4.2 Market Drivers
- 4.2.1 Surging Online Auto-Retail Platforms Driving Demand for Instant Digital Financing in North America
- 4.2.2 Rising Used-Car Transactions and Certified Pre-Owned Programs in Europe Creating New Lending Volume
- 4.2.3 Rapid Growth of EV Leasing and Subscription Models in Asia-Pacific Catalyzing Captive Finance Penetration
- 4.2.4 Government Scrappage Incentives and Green-Finance Subsidies Accelerating Auto Loan Originations in China and EU
- 4.2.5 OEM Captives Expanding Buy-Now-Pay-Later and Flexible Balloon Payment Products in Emerging Markets
- 4.2.6 Alternative Data and AI-Based Credit Scoring Opening Sub-prime Borrower Segments in South America
- 4.3 Market Restraints
- 4.3.1 Central-Bank Rate Hikes Compressing Net Interest Margins for Auto Lenders Since 2023
- 4.3.2 Rising Delinquency Rates in U.S. Sub-prime Auto Segment Constraining Banks' Credit Appetite
- 4.3.3 Regulatory Caps on Vehicle Loan-to-Value Ratios in India and Brazil Limiting Financing Volumes
- 4.3.4 Depreciation Risk of ICE Vehicles Undermining Residual Value Assumptions amid EV Shift
- 4.4 Porter's Five Forces Analysis
- 4.4.1 Threat of New Entrants
- 4.4.2 Bargaining Power of Buyers
- 4.4.3 Bargaining Power of Suppliers
- 4.4.4 Threat of Substitutes
- 4.4.5 Intensity of Competitive Rivalry
5 Market Size & Growth Forecasts (Value, USD)
- 5.1 By Type
- 5.1.1 New Vehicle
- 5.1.2 Used Vehicle
- 5.2 By Source Type
- 5.2.1 OEM Captive Finance
- 5.2.2 Banks
- 5.2.3 Credit Unions
- 5.2.4 Non-Bank Financial Institutions
- 5.3 By Vehicle Type
- 5.3.1 Passenger Cars
- 5.3.2 Commercial Vehicles
- 5.4 By Financing Product
- 5.4.1 Loan
- 5.4.2 Lease
- 5.4.3 Balloon Payment
- 5.4.4 Subscription
- 5.5 By Geography
- 5.5.1 North America
- 5.5.1.1 United States
- 5.5.1.2 Canada
- 5.5.1.3 Rest of North America
- 5.5.2 South America
- 5.5.2.1 Brazil
- 5.5.2.2 Argentina
- 5.5.2.3 Rest of South America
- 5.5.3 Europe
- 5.5.3.1 Germany
- 5.5.3.2 United Kingdom
- 5.5.3.3 France
- 5.5.3.4 Italy
- 5.5.3.5 Spain
- 5.5.3.6 Russia
- 5.5.3.7 Rest of Europe
- 5.5.4 Asia-Pacific
- 5.5.4.1 China
- 5.5.4.2 Japan
- 5.5.4.3 India
- 5.5.4.4 South Korea
- 5.5.4.5 Indonesia
- 5.5.4.6 Vietnam
- 5.5.4.7 Philippines
- 5.5.4.8 Australia
- 5.5.4.9 New Zealand
- 5.5.4.10 Rest of Asia-Pacific
- 5.5.5 Middle East
- 5.5.5.1 Saudi Arabia
- 5.5.5.2 United Arab Emirates
- 5.5.5.3 Turkey
- 5.5.5.4 Rest of Middle East
- 5.5.6 Africa
- 5.5.6.1 South Africa
- 5.5.6.2 Nigeria
- 5.5.6.3 Egypt
- 5.5.6.4 Rest of Africa
- 5.5.1 North America
6 Competitive Landscape
- 6.1 Market Concentration
- 6.2 Strategic Moves
- 6.3 Market Share Analysis
- 6.4 Company Profiles (includes Global Level Overview, Market Level Overview, Core Segments, Financials as Available, Strategic Information, Market Rank/Share for Key Companies, Products and Services, SWOT Analysis, and Recent Developments)
- 6.4.1 Bank of America Corp.
- 6.4.2 Ally Financial Inc.
- 6.4.3 Hitachi Capital Corp.
- 6.4.4 HDFC Bank Ltd.
- 6.4.5 Bank of China
- 6.4.6 Capital One Financial Corp.
- 6.4.7 Wells Fargo & Co.
- 6.4.8 Toyota Financial Services
- 6.4.9 BNP Paribas SA
- 6.4.10 Volkswagen Financial Services AG
- 6.4.11 Mercedes-Benz Financial Services
- 6.4.12 Standard Bank Group
- 6.4.13 Mahindra Finance Ltd.
- 6.4.14 Santander Consumer Finance
- 6.4.15 General Motors Financial Company, Inc.
- 6.4.16 Ford Motor Credit Co.
- 6.4.17 Mitsubishi UFJ Lease & Finance Ltd.
- 6.4.18 DBS Bank Ltd.
- 6.4.19 Hyundai Capital Ltd.
7 Market Opportunities & Future Outlook
- 7.1 White-space & Unmet-Need Assessment
 汽車金融市場規模、佔有率和成長分析:按交易類型、資金提供來源、車輛類型、金融工具類型、用途和地區分類-2026-2033年產業預測
 汽車金融市場-全球產業規模、佔有率、趨勢、機會與預測:按車輛類型、供應商、地區和競爭對手分類,2021-2031年
 汽車金融市場預測至2034年-全球分析(按提供者、用途、融資方式、資金來源、服務、車輛類型和地區分類)
 汽車金融市場:2026-2032年全球市場預測(依客戶類型、貸款形式、信用評級、車輛類型及銷售管道)
 全球汽車金融市場規模、佔有率、趨勢和成長分析報告(2026-2034)汽車金融市場規模、佔有率、成長及全球產業分析:按類型、應用和地區分類的洞察,2026-2034 年預測人工智慧驅動的殘值預測市場:策略洞察與預測(2026-2031)汽車里程融資市場:策略性洞察與預測(2026-2031 年)租賃,2035:未來出行金融
 美國汽車貸款:市場佔有率分析、行業趨勢和統計數據以及成長預測(2026-2031 年)