

 |
市場調查報告書
商品編碼
1934763
銅:市場佔有率分析、行業趨勢和統計數據、成長預測(2026-2031 年)Copper - Market Share Analysis, Industry Trends & Statistics, Growth Forecasts (2026 - 2031) |
||||||
※ 本網頁內容可能與最新版本有所差異。詳細情況請與我們聯繫。
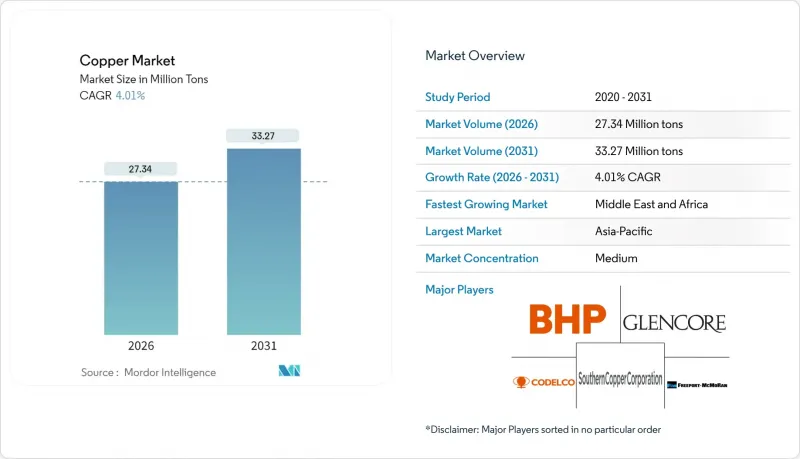
預計到 2026 年,銅市場規模將達到 2,734 萬噸,高於 2025 年的 2,629 萬噸。
預計到 2031 年產量將達到 3,327 萬噸,2026 年至 2031 年的複合年成長率為 4.01%。
此次擴張受結構性電氣化趨勢、可再生能源計劃銅用量成長五倍以及電網現代化專案等因素共同推動,這些因素進一步加劇了本已緊張的供應體系。電動車、資料中心建設和智慧城市發展帶來的日益成長的需求,促使礦業公司加快現有礦場的擴張,即便礦石品位正在下降。回收的能源效率高、碳足跡低,使得二次供應成為公用事業公司、汽車製造商和電子產品製造商尋求穩定採購方案時極具吸引力的經濟和信譽保障之選。此外,銅市場也面臨投機交易和關稅不確定性帶來的價格波動,促使製造商在避險成本高時簽訂長期合約或轉向廢銅原料。
全球銅市場趨勢與洞察
可再生能源和電網電氣化帶來的需求成長
1兆瓦的風能或太陽能發電裝置容量所需的銅量約為傳統發電的五倍,這使得可再生能源的擴張成為銅市場最強勁的結構性需求促進因素。一台3兆瓦的陸域風力發電機消耗4.7短噸(約4.3噸)銅,而一塊1兆瓦的太陽能板消耗5.5短噸(約5.1噸)銅。電網升級進一步放大了這一影響,因為每條高壓直流(HVDC)線路都需要數千噸銅,而且各大洲都在同步實施電網強化項目。中國的國家電網投資計畫和歐洲的跨境離岸風力發電骨幹網就是很好的例子,它們透過多年採購週期為銅市場帶來可預測的供應。
電動汽車中銅的使用量正在快速成長。
一輛普通電池式電動車(BEV) 平均消耗 183 磅銅,而內燃機 (ICE) 車型僅消耗 51 磅銅,這意味著電動交通工具對銅市場的需求量是傳統燃油車的 3.6 倍。這種車輛層面的需求與充電基礎設施的需求相輔相成,單一直流快速充電器就需要消耗高達 17 磅銅。原始設備製造商 (OEM) 正在洽談多年期承購協議,以確保在礦山開發週期結束後,生產擴張之前,銅供應能夠得到保障。
嚴格的環境法規和核准流程的延誤
在經濟合作暨發展組織成員國,完整的礦場開發週期可能需要 20 多年,期間會設定許多建設前里程碑,包括環境影響評估、水資源管理計畫、區域諮詢通訊協定等。合規成本可能會使計劃預算增加 5,000 萬美元以上,並阻礙新的開發計劃,導致生產商優先考慮擴大現有礦場或收購已獲許可的礦床。
細分市場分析
到2025年,礦產銅供應量將佔全球總量的84.15%,而再生原料的複合年成長率(CAGR)為5.42%,超過了原生銅的生產速度。隨著電子垃圾的品位遠高於礦石品位,城市採礦的經濟效益日益提升,銅回收市場的成長速度也超過了礦產供應量。再生銅生產可實現高達90%的節能,符合企業淨零排放目標以及環境、社會和管治(ESG)相關的融資獎勵。
擴大回收規模面臨許多挑戰,因為鋁和鋼的污染會推高檢驗成本。半成品加工商每月在品質檢驗上花費 28,000 美元,但每年仍拒絕約 25 批貨物。儘管有這些營運挑戰,預計 2024 年廢銅供應量將成長 4.2%,是礦場產量成長的兩倍,這標誌著銅市場正持續向循環經濟原料供應模式轉變。
銅市場報告按來源(採礦和回收)、終端用戶行業(建築、基礎設施、工業、交通運輸、消費品和電子產品等)以及地區(亞太地區、北美地區、歐洲地區、南美地區以及中東和非洲地區)進行細分。市場預測以噸為單位。
區域分析
到2025年,亞太地區將佔全球消費量的70.30%,這主要得益於中國一體化的冶煉加工生態系統和印度電網建設的加速發展。中國擁有全球44%的提煉產能,賦予了該地區定價權,並使其能夠在期貨曲線倒掛時囤積陰極材料。
北美和歐洲是成熟市場,目前處於更新階段。自2000年以來,美國已關閉四家提煉,並於2023年出口了34.1萬噸精礦用於海外加工。但《通膨控制法案》已確保了冶煉產能回流的資金。歐洲的離岸風力發電計畫需要採購高壓直流電纜以支援高品質陰極鋼的進口,而嚴格的回收規定有利於二次冶煉廠,從而幫助下游製造商減少範圍3排放。
中東和非洲地區預計將成為成長最快的市場,年複合成長率將達到5.21%,這主要得益於主權財富基金向尚比亞、剛果民主共和國和奈米比亞的計劃投入巨資。海灣國家也增加對國內下游產能的投入,以對沖石油收入波動帶來的風險,並透過將非洲原料與當地的鋼筋和鋼管廠連接起來,在銅市場打造新的南南供應鏈。
其他福利:
- Excel格式的市場預測(ME)表
- 3個月的分析師支持
目錄
第1章 引言
- 研究假設和市場定義
- 調查範圍
第2章調查方法
第3章執行摘要
第4章 市場情勢
- 市場概覽
- 市場促進因素
- 可再生能源和電網電氣化需求不斷成長
- 電動車中銅的使用量迅速成長
- 新興市場城市基礎設施的擴建
- 用於離岸風電的高壓直流(HVDC)海底電纜
- 抗菌銅在醫療領域的應用
- 市場限制
- 嚴格的環境法規和核准流程的延誤
- 銅價波動源自投機交易
- 來自輕質替代導體的競爭
- 價值鏈分析
- 波特五力分析
- 新進入者的威脅
- 買方的議價能力
- 供應商的議價能力
- 替代品的威脅
- 競爭程度
第5章 市場規模與成長預測
- 按來源
- 礦業
- 回收利用
- 按最終用途行業分類
- 建築施工
- 基礎設施
- 產業
- 運輸
- 消費品和電子產品
- 其他
- 按地區
- 亞太地區
- 中國
- 日本
- 印度
- 韓國
- 亞太其他地區
- 北美洲
- 美國
- 加拿大
- 墨西哥
- 歐洲
- 德國
- 英國
- 法國
- 義大利
- 其他歐洲地區
- 南美洲
- 巴西
- 阿根廷
- 其他南美洲
- 中東和非洲
- 沙烏地阿拉伯
- 南非
- 其他中東和非洲地區
- 亞太地區
第6章 競爭情勢
- 市場集中度
- 策略趨勢
- 市佔率(%)/排名分析
- 公司簡介
- Antofagasta plc
- Aurubis AG
- BHP
- Codelco
- First Quantum Minerals
- Freeport-McMoRan
- Glencore
- Grupo Mexico(Southern Copper Corporation)
- Hindustan Copper Limited
- Jiangxi Copper Corporation
- Kaz Minerals
- KGHM
第7章 市場機會與未來展望
Copper Market size in 2026 is estimated at 27.34 million tons, growing from 2025 value of 26.29 million tons with 2031 projections showing 33.27 million tons, growing at 4.01% CAGR over 2026-2031.
This expansion is shaped by structural electrification trends, the fivefold copper intensity of renewable-energy projects, and grid-modernization programs that collectively strain an already tight supply pipeline. Heightened demand from electric vehicles, data-center construction, and smart-city rollouts is pushing miners to accelerate brownfield expansions even as ore grades fall. Recycling's energy-efficiency advantages and lower carbon footprint make secondary supply economically and reputationally attractive to utilities, automakers, and electronics manufacturers seeking resilient procurement options. The copper market also navigates price swings triggered by speculative trading and tariff uncertainty, prompting manufacturers to lock in long-term contracts or diversify toward scrap feedstock when hedging options appear costly.
Global Copper Market Trends and Insights
Expanding Demand from Renewable Energy and Grid Electrification
A single megawatt of wind or solar capacity demands roughly five times the copper used in conventional generation, turning renewable build-outs into the strongest structural pull on the copper market. A 3 MW onshore turbine requires 4.7 short tons of copper, while a 1 MW solar array consumes 5.5 short tons. Transmission upgrades magnify the effect because High Voltage Direct Current (HVDC) links draw thousands of tons each, and grid-strengthening programs run in parallel on every continent. China's State Grid investment plan and Europe's cross-border offshore-wind backbones exemplify multi-year procurement cycles that add predictable volume to the copper market.
Rapid Growth in EV Copper Intensity
Battery-electric cars average 183 lb of copper versus 51 lb in internal-combustion models, making electrified transport a 3.6X intensity lever on the copper market. This vehicle-level demand compounds with charging infrastructure, where a single direct-current fast charger incorporates up to 17 lb of the metal. Automotive original equipment manufacturers (OEMs) are negotiating multi-year offtake contracts to secure supply ahead of production ramps surpassing mine-development timelines.
Stringent Environmental Regulations and Permitting Delays
Full-cycle mine development stretches past two decades in the Organisation for Economic Co-operation and Development (OECD) jurisdictions because environmental impact assessments, water-management plans, and community-consultation protocols impose extensive pre-construction milestones. Compliance outlays can add USD 50 million or more to project budgets and discourage greenfield proposals, motivating producers to favor brownfield expansions or acquire permitted deposits.
Other drivers and restraints analyzed in the detailed report include:
- Urban Infrastructure Expansion in Emerging Markets
- HVDC Submarine Cables for Offshore Wind
- Copper Price Volatility Driven by Speculative Trading
For complete list of drivers and restraints, kindly check the Table Of Contents.
Segment Analysis
Mining supplied 84.15% of global volume in 2025, but secondary feedstock is expanding at a 5.42% CAGR that outstrips primary output growth. The Copper market size for recycled material is rising faster than mined supply as the economics of urban mining improve once scrap grades in obsolete electronics exceed ore grades by an order of magnitude. Secondary copper production requires up to 90% less energy, aligning with corporate net-zero mandates and Environmental, Social, and Governance (ESG)-linked financing incentives.
Scaling recycling is not trivial because contamination from aluminum and iron inflates testing costs-semi-finished fabricators spend USD 28,000 per month on quality checks and still reject roughly 25 shipments annually. Despite these operational challenges, scrap supply grew 4.2% in 2024, double the rate of mined output, signaling a durable pivot toward circular-economy inputs for the copper market.
The Copper Market Report is Segmented by Source (Mining and Recycling), End-Use Industry (Building Construction, Infrastructure, Industrial, Transportation, Consumer Products and Electronic Equipment, and Others), and Geography (Asia-Pacific, North America, Europe, South America, and Middle East and Africa). The Market Forecasts are Provided in Terms of Volume (Tons).
Geography Analysis
Asia-Pacific commanded 70.30% of 2025 consumption, propelled by China's integrated smelting-to-fabrication ecosystem and India's accelerating grid build-out. China also houses 44% of global refining capacity, giving the region price-setting clout and the ability to stockpile cathode when futures curves turn backwardated.
North America and Europe remain mature but are entering renewal phases. The United States has closed four refineries since 2000, exporting 341,000 t of concentrate for overseas processing in 2023, yet the Inflation Reduction Act has earmarked funds to reshore smelting capacity. Europe's offshore-wind agenda mandates HVDC cable procurement that supports premium-grade cathode imports, while stringent recycling directives favor secondary smelters that lower Scope 3 emissions for downstream manufacturers.
The Middle East & Africa represents the fastest-growing arena, with a 5.21% CAGR forecast as sovereign-wealth investors channel capital into Zambian, DRC, and Namibian projects. Gulf states are also funding domestic downstream capacity to hedge against oil-revenue volatility, linking African feedstock with local rod and tube mills to create an emergent south-south supply chain for the copper market.
- Antofagasta plc
- Aurubis AG
- BHP
- Codelco
- First Quantum Minerals
- Freeport-McMoRan
- Glencore
- Grupo Mexico (Southern Copper Corporation)
- Hindustan Copper Limited
- Jiangxi Copper Corporation
- Kaz Minerals
- KGHM
Additional Benefits:
- The market estimate (ME) sheet in Excel format
- 3 months of analyst support
TABLE OF CONTENTS
1 Introduction
- 1.1 Study Assumptions & Market Definition
- 1.2 Scope of the Study
2 Research Methodology
3 Executive Summary
4 Market Landscape
- 4.1 Market Overview
- 4.2 Market Drivers
- 4.2.1 Expanding Demand from Renewable Energy and Grid Electrification
- 4.2.2 Rapid Growth in EV Copper Intensity
- 4.2.3 Urban Infrastructure Expansion in Emerging Markets
- 4.2.4 HVDC Submarine Cables for Offshore Wind
- 4.2.5 Antimicrobial Copper Adoption in Healthcare
- 4.3 Market Restraints
- 4.3.1 Stringent Environmental Regulations and Permitting Delays
- 4.3.2 Copper Price Volatility Driven by Speculative Trading
- 4.3.3 Competition from Lightweight Alternative Conductors
- 4.4 Value Chain Analysis
- 4.5 Porter's Five Forces Analysis
- 4.5.1 Threat of New Entrants
- 4.5.2 Bargaining Power of Buyers
- 4.5.3 Bargaining Power of Suppliers
- 4.5.4 Threat of Substitute Products
- 4.5.5 Degree of Competition
5 Market Size & Growth Forecasts (Volume)
- 5.1 By Source
- 5.1.1 Mining
- 5.1.2 Recycling
- 5.2 By End-use Industry
- 5.2.1 Building Construction
- 5.2.2 Infrastructure
- 5.2.3 Industrial
- 5.2.4 Transportation
- 5.2.5 Consumer Products and Electronic Equipment
- 5.2.6 Others
- 5.3 By Geography
- 5.3.1 Asia-Pacific
- 5.3.1.1 China
- 5.3.1.2 Japan
- 5.3.1.3 India
- 5.3.1.4 South Korea
- 5.3.1.5 Rest of Asia-Pacific
- 5.3.2 North America
- 5.3.2.1 United States
- 5.3.2.2 Canada
- 5.3.2.3 Mexico
- 5.3.3 Europe
- 5.3.3.1 Germany
- 5.3.3.2 United Kingdom
- 5.3.3.3 France
- 5.3.3.4 Italy
- 5.3.3.5 Rest of Europe
- 5.3.4 South America
- 5.3.4.1 Brazil
- 5.3.4.2 Argentina
- 5.3.4.3 Rest of South America
- 5.3.5 Middle East and Africa
- 5.3.5.1 Saudi Arabia
- 5.3.5.2 South Africa
- 5.3.5.3 Rest of Middle East and Africa
- 5.3.1 Asia-Pacific
6 Competitive Landscape
- 6.1 Market Concentration
- 6.2 Strategic Moves
- 6.3 Market Share (%)**/Ranking Analysis
- 6.4 Company Profiles (includes Global level Overview, Market level overview, Core Segments, Financials as available, Strategic Information, Market Rank/Share for key companies, Products & Services, and Recent Developments)
- 6.4.1 Antofagasta plc
- 6.4.2 Aurubis AG
- 6.4.3 BHP
- 6.4.4 Codelco
- 6.4.5 First Quantum Minerals
- 6.4.6 Freeport-McMoRan
- 6.4.7 Glencore
- 6.4.8 Grupo Mexico (Southern Copper Corporation)
- 6.4.9 Hindustan Copper Limited
- 6.4.10 Jiangxi Copper Corporation
- 6.4.11 Kaz Minerals
- 6.4.12 KGHM
7 Market Opportunities & Future Outlook
- 7.1 White-space & Unmet-need Assessment
 全球航空航太與國防工業銅需求(2026-2036 年)
 2026年全球銅市場報告
 2026-2030年全球銅市場
 全球銀塗層銅粉市場(按粒徑、顆粒形狀、製造流程、包裝類型、應用和最終用途行業分類)預測(2026-2032年)銅導體材料市場(依導體類型、電壓等級、形狀和最終用途分類)-2026-2032年全球預測
 黃銅箔市場規模、佔有率和成長分析(按產品類型、材質等級、應用、最終用途產業和地區分類)-2026-2033年產業預測
 超細銅粉市場規模、佔有率及成長分析(按生產方法、粒度、應用、終端用戶產業及地區分類)-產業預測,2026-2033年
 銅市場規模、佔有率和成長分析(按類型、形態、開採方法、應用和地區分類)-2026-2033年產業預測電力及工業市場銅銀元件:依材料、類型、元件、國家及地區分類-全球產業分析、市場規模、市場佔有率及2025-2032年預測
 全球再生銅市場-2025-2030年預測