


 |
市場調查報告書
商品編碼
1911828
可填充和可重複使用包裝:市場佔有率分析、行業趨勢和統計數據、成長預測(2026-2031 年)Refillable And Reusable Packaging - Market Share Analysis, Industry Trends & Statistics, Growth Forecasts (2026 - 2031) |
||||||
※ 本網頁內容可能與最新版本有所差異。詳細情況請與我們聯繫。
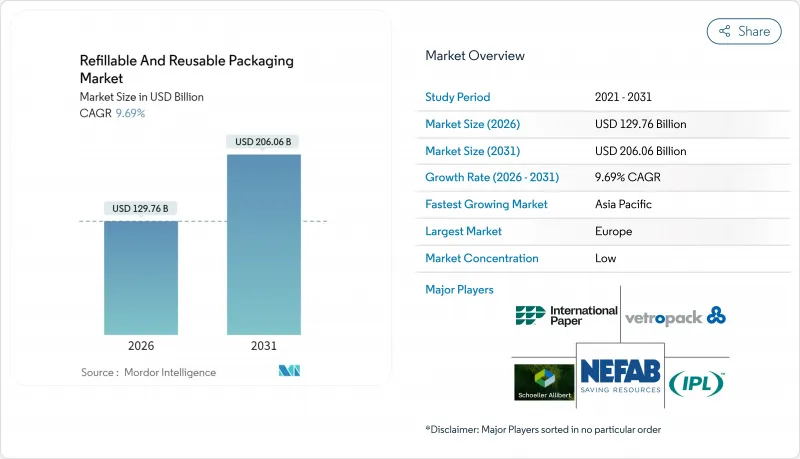
預計可填充和可重複使用包裝市場將從 2025 年的 1183 億美元成長到 2026 年的 1297.6 億美元,預計到 2031 年將達到 2060.6 億美元,2026 年至 2031 年的複合年成長率為 9.69%。
隨著循環經濟法規、供應鏈成本壓力和消費者對永續性的偏好在已開發經濟體和新興經濟體中趨於一致,可重複填充和可重複使用的包裝市場正在加速發展。歐洲立法的確定性、中國的綠色小包裹強制令以及清潔和追蹤解決方案的技術突破正在加速其普及,儘管基礎設施方面仍有不足。企業將可回收資產定位為降低整體物流成本、緩解原物料價格波動和提升品牌價值的途徑,而投資人則為可衡量的廢棄物減量項目提供低成本資金。競爭的焦點在於整合物聯網感測器、預測分析技術,並提供承包清潔服務,以最大限度地提高資產利用率和合規報告。
全球可重複填充及可重複使用包裝市場趨勢及洞察
推動強制性循環經濟的法律動力
生產者延伸責任制要求企業承擔產品報廢成本。歐盟規定,2025年材料回收率達65%,到2030年運輸包裝的再利用率達90%。中國的宅配法規要求物流業者對95%的市內小包裹使用可重複使用的包裝,使得可回收包裝的潛在市場規模擴大至120億美元。隨著處置成本和碳價格的上漲,這些法規正推動總體擁有成本模式轉向可重複使用包裝模式。
透過閉合迴路供應鏈降低成本
營運數據證實,可重複使用的資產能夠降低貨運成本、工時成本和折舊成本。 CHEP 的汽車專案將卡車運轉率提升至 95%,裝載時間縮短了 75%,並為一級供應商節省了每年 230 萬美元。 CEVA物流報告稱,使用物聯網可追蹤容器取代一次性紙盒後,排放減少了 60%,且投資回報迅速。借助快速回收系統,這項投資通常可在 18 個月內收回成本。
高額的逆向物流成本
與運輸流程相比,退貨網路的處理成本可能高達三倍,尤其是在路線密度較低的地區。低溫運輸退貨會增加成本,迫使一些品牌將其再利用計畫限制在主要大都會圈的關鍵路線上。
細分市場分析
截至2025年,塑膠將佔可重複填充和可重複使用包裝市場的48.85%,這主要得益於聚丙烯和聚乙烯容器,它們能夠承受高循環次數,同時與自動化系統相容。輕量化設計可減少運輸排放和整體成本。由於玻璃重量較重,預計其複合年成長率將達到12.18%,而高階飲料和護膚品則更注重純度和奢華感。 Vetropack的輕質玻璃技術在彌補運輸成本差距的同時,也能保護品牌形象。金屬桶和周轉箱仍然是化學工業的主力軍,因為在該行業,耐用性比重量更為重要;而紙基瓦楞紙板則在汽車零件運輸中發揮著特殊作用。
儘管回收食品接觸塑膠的永續性檢驗可能會促使一些品牌轉向玻璃或金屬包裝,但嵌入物聯網標籤的先進聚合物將鞏固塑膠在快速循環系統中的地位。因此,隨著材料科學的進步,可填充和可重複使用的包裝市場正在努力平衡成本效益、品牌需求和法規遵循。
區域分析
到2025年,歐洲將佔據可重複使用和可填充包裝市場34.08%的佔有率,這得益於數十年來在政策和基礎設施方面的投資。歐盟要求在2030年實現90%的運輸包裝重複利用,為企業的長期預算規劃奠定了基礎。德國的一項合作計畫將包裝箱的周轉時間縮短至2.4天,而法國則與奢侈品牌合作,試點高階玻璃瓶可重複填充系統。英國正在投資5,000萬美元建立柔軟性塑膠回收能力,以加強該國的循環經濟。
到2031年,亞太地區將以10.55%的複合年成長率推動成長。中國95%的城市小包裹再利用政策將催生一個價值120億美元的可折疊托特包市場,適用於末端配送自行車。日本的生產者責任制將擴展至電子產品領域,從而推動可重複使用運輸包裝的需求。印度製造業的擴張將增加對可回收汽車貨架的需求。韓國將在無塵室貨櫃池中引入物聯網標籤和區塊鏈追蹤系統。東南亞將迎來大量外資湧入區域清潔中心。
在北美,企業對氣候的承諾和各州層級的生產者延伸責任制法律正在推動穩步進展。 Dispatch Goods公司已籌集創業投資資金,旨在透過為餐廳提供容器共用服務來解決價值3,350億美元的包裝廢棄物問題。在加拿大,資源產業正在試驗可重複填充服務,而墨西哥則正在將其擁有百年歷史的玻璃瓶回收系統擴展為基於應用程式的收集系統。巴西和墨西哥使用木製飲料箱的傳統以及都市區日益增強的環保意識正在推動拉丁美洲的新發展。雖然中東和非洲地區仍在發展中,但零售商正在試點使用閉合迴路水桶。
其他福利:
- Excel格式的市場預測(ME)表
- 3個月的分析師支持
目錄
第1章 引言
- 研究假設和市場定義
- 調查範圍
第2章調查方法
第3章執行摘要
第4章 市場情勢
- 市場概覽
- 市場促進因素
- 推動循環經濟政策的立法舉措
- 閉合迴路供應鏈的成本降低效益
- 消費者對永續品牌的偏好
- 新興的物聯網賦能型行動補貨零售
- 與環境、社會及公司治理 (ESG) 相關的零浪費企業融資
- 聚合物間清洗技術的創新
- 市場限制
- 高額的逆向物流成本
- 食品接觸材料再利用標準存在歧義
- 熱帶地區的微生物污染風險
- 碎片化的追蹤溯源資料通訊協定
- 產業供應鏈分析
- 監管環境
- 技術展望
- 波特五力分析
- 供應商的議價能力
- 消費者議價能力
- 新進入者的威脅
- 替代品的威脅
- 競爭對手之間的競爭
第5章 市場規模與成長預測
- 材料
- 塑膠
- 紙和紙板
- 金屬
- 玻璃
- 依產品
- 瓶子和容器
- 托盤和木箱
- 中型散貨箱(IBC)
- 鼓和桶
- 盒子和紙箱
- 罐子和桶
- 其他產品(管狀、袋狀、包裝袋等)
- 按最終用戶行業分類
- 食品/飲料
- 化妝品和個人護理
- 家居用品
- 化學品和石油化工
- 建築/施工
- 配送和運輸
- 其他終端用戶產業(汽車、製藥等)
- 按地區
- 北美洲
- 美國
- 加拿大
- 墨西哥
- 南美洲
- 巴西
- 阿根廷
- 南美洲其他地區
- 歐洲
- 德國
- 英國
- 法國
- 義大利
- 西班牙
- 俄羅斯
- 其他歐洲地區
- 亞太地區
- 中國
- 日本
- 印度
- 韓國
- 東南亞
- 亞太其他地區
- 中東和非洲
- 中東
- 沙烏地阿拉伯
- 阿拉伯聯合大公國
- 土耳其
- 其他中東地區
- 非洲
- 南非
- 奈及利亞
- 其他非洲地區
- 中東
- 北美洲
第6章 競爭情勢
- 市場集中度
- 策略趨勢
- 市佔率分析
- 公司簡介
- Schoeller Allibert Services BV
- International Paper
- Nefab Group
- IPL Inc.
- Vetropack Holding Ltd
- Mondi PLC
- Greif Inc.
- IFCO Systems
- Smurfit WestRock
- GWP Group
- Orbis Corporation
- Petainer Ltd
- Refillism
- Amcor PLC
- Bormioli Luigi Corporation
- Jiangmen UA Packaging Co. Ltd
- Loop Industries Inc.
- RePack Oy
- EcoEnclose LLC
第7章 市場機會與未來展望
The refillable and reusable packaging market is expected to grow from USD 118.3 billion in 2025 to USD 129.76 billion in 2026 and is forecast to reach USD 206.06 billion by 2031 at 9.69% CAGR over 2026-2031.
The refillable and reusable packaging market is gaining speed because circular-economy regulations, supply-chain cost pressures, and consumer sustainability preferences now converge across advanced and emerging economies. Legislative certainty in Europe, green-parcel mandates in China, and technology breakthroughs in cleaning and tracing solutions accelerate adoption despite lingering infrastructure gaps. Companies treat returnable assets as levers for lower total logistics spend, reduced raw-material volatility, and stronger brand equity, while investors reward measurable waste reduction with cheaper capital. Competitive activity focuses on embedding IoT sensors, predictive analytics, and turnkey washing services to maximize asset utilization and compliance reporting.
Global Refillable And Reusable Packaging Market Trends and Insights
Legislative Push Towards Circular-Economy Mandates
Extended producer responsibility policies now require companies to internalize end-of-life costs. The European Union mandates 65% material recycling by 2025 and 90% reuse for transport packaging by 2030. China's express-delivery regulation requires logistics providers to achieve a 95% reusable-packaging rate for intra-city parcels, unlocking a USD 12 billion addressable market for returnable containers. These rules tilt total-cost-of-ownership models toward reusable formats as disposal fees and carbon pricing rise.
Cost Savings from Closed-Loop Supply Chains
Operational data confirm that reusable assets lower freight bills, labor time, and write-offs. A CHEP automotive program increased truck utilization to 95% while cutting loading time by 75%, saving tier-one suppliers USD 2.3 million each year. CEVA Logistics reports 60% emission cuts and rapid payback when IoT-tracked boxes replace single-use cartons. In high-velocity loops, investments are typically recovered within 18 months.
High Reverse-Logistics Costs
Return networks can triple handling expenses relative to outbound flows, especially where route density is low. Cold-chain returns further elevate costs, pushing some brands to restrict reuse programs to high-volume urban corridors.
Other drivers and restraints analyzed in the detailed report include:
- Consumer Preference for Sustainable Brands
- Emerging IoT-Enabled Refill-on-the-Go Retail
- Ambiguity in Food-Contact Reuse Standards
For complete list of drivers and restraints, kindly check the Table Of Contents.
Segment Analysis
Plastic held 48.85% of the refillable and reusable packaging market share in 2025, thanks to polypropylene and polyethylene containers that survive high cycle counts while aligning with automation systems. Lightweight designs reduce freight emissions and total cost. Glass, though heavier, records a 12.18% CAGR because luxury beverages and skincare prioritize purity and premium feel. Vetropack's lightweight flint technology narrows freight gaps while protecting brand aesthetics.Metal drums and totes remain staples in chemicals where durability outranks weight, and paper-based corrugates secure specialized roles in automotive part shuttles.
Sustainability scrutiny of food-contact recycled plastics may gradually shift some brands toward glass and metal, yet advanced polymers embedded with IoT tags cement plastics' role in high-velocity loops. Consequently, the refillable and reusable packaging market balances cost efficiency, branding needs, and regulatory compliance as material science progresses.
The Refillable and Reusable Packaging Market Report is Segmented by Material (Plastic, Paper and Paperboard, and More), Product (Bottles and Containers, Pallets and Crates, Ibcs, Drums and Barrels, and More), End-User Industry (Food and Beverage, Cosmetics and Personal Care, Household Care, Chemicals and Petrochemicals, Building and Construction, and More), and Geography. The Market Forecasts are Provided in Terms of Value (USD).
Geography Analysis
Europe captured 34.08% of the refillable and reusable packaging market share in 2025, reflecting decades of policy layering and infrastructure investment. The EU's 90% transport-packaging reuse mandate for 2030 anchors long-term corporate budgets. Germany's pooling alliances lower crate turnaround times to 2.4 days, while France partners with luxury houses to pilot high-end glass refill systems. The United Kingdom channels USD 50 million into flexible-plastic recycling capacity, reinforcing domestic circularity.
Asia-Pacific leads growth at a 10.55% CAGR to 2031. China's 95% intra-city parcel-reuse rule yields a USD 12 billion market for foldable totes that fit last-mile bikes. Japan extends producer-responsibility fees to electronics, stimulating reusable transport packaging, while India's manufacturing expansion boosts demand for returnable automotive racks. South Korea integrates IoT tags and blockchain tracing into clean-room container pools, and Southeast Asia receives foreign investment for regional wash depots.
North America shows steady progress driven by corporate climate pledges and state-level Extended Producer Responsibility laws. Dispatch Goods raised venture funding to tackle part of the USD 335 billion packaging-waste problem through restaurant container sharing. Canada promotes refill pilots in resource industries, and Mexico scales century-old glass-bottle loops into app-based return systems. Latin America's emerging rollouts in Brazil and Mexico draw on beverage-crate heritage and rising urban eco-awareness. The Middle East and Africa, still nascent, attract interest as retailers test closed-loop water-jug fleets.
- Schoeller Allibert Services BV
- International Paper
- Nefab Group
- IPL Inc.
- Vetropack Holding Ltd
- Mondi PLC
- Greif Inc.
- IFCO Systems
- Smurfit WestRock
- GWP Group
- Orbis Corporation
- Petainer Ltd
- Refillism
- Amcor PLC
- Bormioli Luigi Corporation
- Jiangmen UA Packaging Co. Ltd
- Loop Industries Inc.
- RePack Oy
- EcoEnclose LLC
Additional Benefits:
- The market estimate (ME) sheet in Excel format
- 3 months of analyst support
TABLE OF CONTENTS
1 INTRODUCTION
- 1.1 Study Assumptions and Market Definition
- 1.2 Scope of the Study
2 RESEARCH METHODOLOGY
3 EXECUTIVE SUMMARY
4 MARKET LANDSCAPE
- 4.1 Market Overview
- 4.2 Market Drivers
- 4.2.1 Legislative push towards circular-economy mandates
- 4.2.2 Cost savings from closed-loop supply chains
- 4.2.3 Consumer preference for sustainable brands
- 4.2.4 Emerging IoT-enabled refill-on-the-go retail
- 4.2.5 ESG-linked zero-waste corporate financing
- 4.2.6 Polymer-to-polymer cleaning breakthroughs
- 4.3 Market Restraints
- 4.3.1 High reverse-logistics costs
- 4.3.2 Ambiguity in food-contact reuse standards
- 4.3.3 Microbial-contamination risks in tropical zones
- 4.3.4 Fragmented track-and-trace data protocols
- 4.4 Industry Supply Chain Analysis
- 4.5 Regulatory Landscape
- 4.6 Technological Outlook
- 4.7 Porter's Five Forces Analysis
- 4.7.1 Bargaining Power of Suppliers
- 4.7.2 Bargaining Power of Consumers
- 4.7.3 Threat of New Entrants
- 4.7.4 Threat of Substitute Products
- 4.7.5 Intensity of Competitive Rivalry
5 MARKET SIZE AND GROWTH FORECASTS
- 5.1 By Material
- 5.1.1 Plastic
- 5.1.2 Paper and Paperboard
- 5.1.3 Metal
- 5.1.4 Glass
- 5.2 By Product
- 5.2.1 Bottles and Containers
- 5.2.2 Pallets and Crates
- 5.2.3 Intermediate Bulk Containers (IBCs)
- 5.2.4 Drums and Barrels
- 5.2.5 Boxes and Cartons
- 5.2.6 Cans and Pails
- 5.2.7 Other Products (Tubes, Pouches, Bags and Sacks, etc.)
- 5.3 By End-user Industry
- 5.3.1 Food and Beverage
- 5.3.2 Cosmetics and Personal Care
- 5.3.3 Household Care
- 5.3.4 Chemicals and Petrochemicals
- 5.3.5 Building and Construction
- 5.3.6 Shipping and Transportation
- 5.3.7 Other End-user Industries (Automotive, Pharmaceuticals, etc.)
- 5.4 By Geography
- 5.4.1 North America
- 5.4.1.1 United States
- 5.4.1.2 Canada
- 5.4.1.3 Mexico
- 5.4.2 South America
- 5.4.2.1 Brazil
- 5.4.2.2 Argentina
- 5.4.2.3 Rest of South America
- 5.4.3 Europe
- 5.4.3.1 Germany
- 5.4.3.2 United Kingdom
- 5.4.3.3 France
- 5.4.3.4 Italy
- 5.4.3.5 Spain
- 5.4.3.6 Russia
- 5.4.3.7 Rest of Europe
- 5.4.4 Asia Pacific
- 5.4.4.1 China
- 5.4.4.2 Japan
- 5.4.4.3 India
- 5.4.4.4 South Korea
- 5.4.4.5 South-East Asia
- 5.4.4.6 Rest of Asia Pacific
- 5.4.5 Middle East and Africa
- 5.4.5.1 Middle East
- 5.4.5.1.1 Saudi Arabia
- 5.4.5.1.2 United Arab Emirates
- 5.4.5.1.3 Turkey
- 5.4.5.1.4 Rest of Middle East
- 5.4.5.2 Africa
- 5.4.5.2.1 South Africa
- 5.4.5.2.2 Nigeria
- 5.4.5.2.3 Rest of Africa
- 5.4.5.1 Middle East
- 5.4.1 North America
6 COMPETITIVE LANDSCAPE
- 6.1 Market Concentration
- 6.2 Strategic Moves
- 6.3 Market Share Analysis
- 6.4 Company Profiles (includes Global level Overview, Market level overview, Core Segments, Financials as available, Strategic Information, Market Rank/Share for key companies, Products and Services, and Recent Developments)
- 6.4.1 Schoeller Allibert Services BV
- 6.4.2 International Paper
- 6.4.3 Nefab Group
- 6.4.4 IPL Inc.
- 6.4.5 Vetropack Holding Ltd
- 6.4.6 Mondi PLC
- 6.4.7 Greif Inc.
- 6.4.8 IFCO Systems
- 6.4.9 Smurfit WestRock
- 6.4.10 GWP Group
- 6.4.11 Orbis Corporation
- 6.4.12 Petainer Ltd
- 6.4.13 Refillism
- 6.4.14 Amcor PLC
- 6.4.15 Bormioli Luigi Corporation
- 6.4.16 Jiangmen UA Packaging Co. Ltd
- 6.4.17 Loop Industries Inc.
- 6.4.18 RePack Oy
- 6.4.19 EcoEnclose LLC
7 MARKET OPPORTUNITIES AND FUTURE OUTLOOK
- 7.1 White-space and Unmet-need Assessment
 可重複使用包裝市場機會、成長要素、產業趨勢分析及預測(2026年至2035年)
 全球可填充和可重複使用包裝市場:預測至 2032 年—按產品、材料、分銷管道、最終用戶和地區分類的分析可重複填充和可重複使用包裝解決方案市場預測至2032年:按產品、材料、分銷管道、最終用戶和地區分類的全球分析
 可重複使用包裝市場規模、佔有率、趨勢分析報告:按材料、產品類型、最終用途、地區和細分市場預測,2025-2030 年可重複使用的電子商務包裝市場機會、成長動力、產業趨勢分析與 2025 - 2034 年預測
 速食可重複使用包裝市場 - 全球產業分析、規模、佔有率、成長、趨勢及2032年預測
 再填充和可重複使用包裝的全球市場的未來(~2029年)