


 |
市場調查報告書
商品編碼
1911714
歐洲化肥市場:市場佔有率分析、產業趨勢、統計數據和成長預測(2026-2031 年)Europe Fertilizers - Market Share Analysis, Industry Trends & Statistics, Growth Forecasts (2026 - 2031) |
||||||
※ 本網頁內容可能與最新版本有所差異。詳細情況請與我們聯繫。
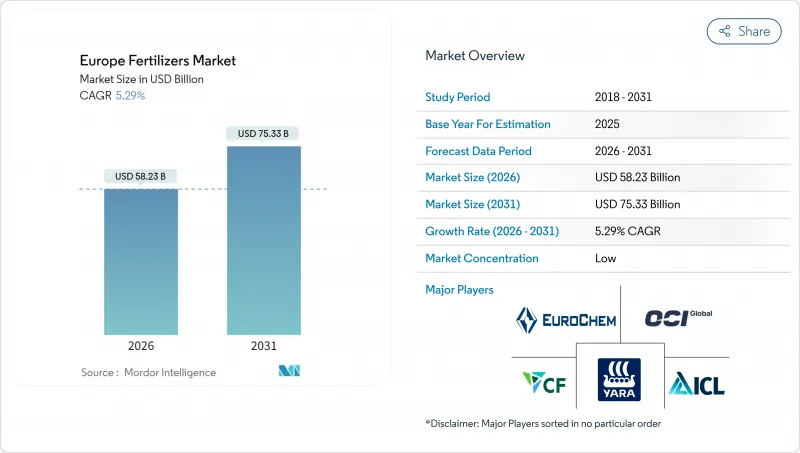
歐洲化肥市場預計將從 2025 年的 553 億美元成長到 2026 年的 582.3 億美元,預計到 2031 年將達到 753.3 億美元,2026 年至 2031 年的複合年成長率為 5.29%。
強勁的需求主要歸功於歐盟通用農業政策(CAP)的生態方案、碳邊境調節機制(CBAM)以及對綠色氨計劃的投資,這些舉措正在重塑氮肥供應結構。緩釋肥和水溶性肥料的加速普及、可再生能源生產投資的增加以及2024年價格飆升後糧食種植面積的恢復,都將進一步推動市場成長。儘管天然氣價格波動給生產商帶來了成本壓力,但他們正透過垂直整合和可再生原料策略來應對。歐洲化肥市場呈現分散且集中的格局,前五大公司僅佔市場佔有率的一小部分。
歐洲化肥市場趨勢與洞察
通用生態計劃促進均衡施肥
歐盟透過其通用農業政策(CAP)生態計劃,每年撥款310億歐元(約335億美元),鼓勵採用能最大限度減少氮磷流失的養分規劃。這些獎勵促進了穩定氮肥、緩釋包膜和精準施肥工具的推廣應用,符合環境目標。法國和德國的大型糧食生產商正在對其設備進行現代化改造,以滿足監管標準,這推動了硝化抑製劑和脲酶抑製劑的銷售。化肥生產商正在將農藝服務與其產品結合,透過合規支援來增加產品價值。該計畫的績效支付機制縮短了精密農業設備的投資回收期,並加速了設備的更新換代。數據驅動的施肥規劃也提高了產量穩定性,進一步推動了這些技術的推廣應用。
精密農業中特種肥料使用量的快速成長
哥白尼衛星計畫提供的高解析度影像和農場感測器實現了變數施肥,從而最大限度地提高了養分利用效率。在數據驅動的管理下,緩釋、液態和水溶性肥料的表現優於傳統產品。荷蘭溫室種植者使用肥料管理系統每小時調整養分混合比例,而北歐穀物種植者則使用包膜尿素來同步氮素釋放和植物吸收。區域混合設施根據當地的微量元素缺乏情況來定製肥料配方,以提高肥料的有效性。種植者提供基於訂閱的決策支援平台,將肥料轉化為一系列農藝解決方案。由於減少損失可以抵消更高的產品成本,因此可以接受更高的價格,從而為特種肥料的成長創造良性循環。
更嚴格限制硝酸鹽和氨的排放
在荷蘭,牧場氮肥施用量限制為每公頃140公斤,耕地氮肥施用量限制為每公頃170公斤,比先前的標準減少了約30%。丹麥針對不同類型的土壤設定了氮肥施用配額,超出配額者將被處以每公頃10,800美元的巨額罰款。為此,農民們正在減少散裝尿素的購買量,並增加穩定型顆粒混合肥料的使用。在過渡期內,由於種植者需要重新評估施肥計劃並推遲購買,短期需求將會放緩。條施正在取代傳統的撒施方式,總用量呈現下降趨勢。化肥生產商被迫轉向更有效率的產品線並提供監管諮詢服務,雖然增加了成本,但也創造了高價銷售機會。
細分市場分析
到2025年,簡單肥料將佔歐洲肥料市場佔有率的76.85%,同時也是成長最快的細分市場,預測期內複合年成長率將達到5.58%。在這一類別中,氮肥是小麥、玉米和油菜籽的主要營養來源。複合肥料的歐洲市場規模正在成長,因為德國和法國的大型農場更青睞省時省力、操作簡便的複合肥料。土壤檢測中常見的鋅和硼缺乏現象,導致專用微量元素混合肥料的價格上漲。市場參與企業正在投資建造區域性混合中心,以調整養分比例並提高交付速度,從而支持複合肥料市場緩慢但穩定的成長。
隨著排放法規日益嚴格,對養分利用效率的要求也越來越高,低揮發性的硝酸銨在排放法規較嚴格的地區市場佔有率不斷擴大。尿素在價格敏感的東歐地區仍佔主導地位。由於缺硫會限制氮的吸收,人們對硫等次要大量營養元素的興趣日益濃厚。供應商正將次要營養元素添加到複合肥料(NPK複合肥料)中,以抵禦特種肥料生產商的競爭。整體而言,該細分市場的成長軌跡與均衡營養策略和精準施肥技術的推廣應用相一致。
到2025年,傳統配方肥料將佔歐洲肥料市場86.25%的佔有率,而特種配方肥料預計將以5.72%的複合年成長率(CAGR)實現最快成長,直至2031年。緩釋包膜肥料市場正在蓬勃發展,聚合物包膜尿素在西班牙溫室番茄生產中實現了10%的增產。水溶性肥料在荷蘭溫室中廣泛應用,透過滴灌系統提供養分,實現高密度種植。液體肥料支持可變速率的空中和曳引機施肥,可根據感測器數據進行即時調整。草坪管理領域對緩效肥料的需求日益成長,因為公共綠地管理需要減少施肥頻率。
由於價格優勢和現有設備的普及,傳統顆粒肥仍然是大面積田間作物的首選。然而,日益嚴格的養分使用限制正推動著人們轉向使用能夠減少損失並符合法規的特殊配方產品。創新者正致力於研發可生物分解的包覆和雙重養分釋放機制,以拓展市場。注重環境、社會和治理(ESG)的食品品牌青睞使用高效養分種植的農產品,影響整個供應鏈的投入選擇。持續的研發投入也印證了該領域作為歐洲化肥市場創新驅動力的重要地位。
歐洲肥料市場報告按類型(複合肥與單質肥)、形態(常規肥與特殊肥)、施用方法(灌溉施肥、葉面噴布、土壤施用)、作物類型(田間作物、園藝作物、草坪及觀賞植物)和地區(法國、德國、義大利、荷蘭等)進行細分。報告以價值(美元)和數量(公噸)為單位提供市場規模和預測數據。
其他福利:
- Excel格式的市場預測(ME)表
- 3個月的分析師支持
目錄
第1章 引言
- 研究假設和市場定義
- 調查範圍
- 調查方法
第2章 報告
第3章執行摘要和主要發現
第4章 主要產業趨勢
- 主要農作物種植面積
- 田間作物
- 園藝作物
- 平均施肥量
- 微量營養素
- 田間作物
- 園藝作物
- 宏量營養素
- 田間作物
- 園藝作物
- 次發性大量營養素
- 田間作物
- 園藝作物
- 微量營養素
- 具有灌溉設施的農田
- 法規結構
- 價值鍊和通路分析
- 市場促進因素
- 通用環境措施促進平衡施肥
- 精密農業中特種肥料使用量的快速成長
- 2024年價格上漲後糧食面積的恢復
- 透過綠色氨投資減少供應鏈排放
- 透過碳邊境調節機制(CBAM)實現營養物質生產的馴化
- 斯堪的納維亞半島可控環境農業的興起
- 市場限制
- 收緊硝酸鹽和氨排放限制
- 天然氣價格波動會推高生產成本。
- 生物促效劑替代品的快速普及
- 東歐的物流和製裁中斷
第5章 市場規模及成長預測(價值及數量)
- 類型
- 合成的
- 單一成分肥料
- 微量營養素
- 硼
- 銅
- 鐵
- 錳
- 鉬
- 鋅
- 其他
- 氮基
- 硝酸銨
- 無水氨
- 尿素
- 其他
- 磷酸鹽
- DAP
- MAP
- SSP
- TSP
- 其他
- 鉀
- MoP
- SoP
- 其他
- 次發性大量營養素
- 鈣
- 鎂
- 硫
- 微量營養素
- 形式
- 傳統的
- 特殊肥料
- 控釋肥料(CRF)
- 液體肥料
- 緩效性肥料(SRF)
- 水溶性
- 應用方法
- 施肥和灌溉
- 葉面噴布
- 土壤
- 作物類型
- 田間作物
- 園藝作物
- 草坪和觀賞植物
- 地區
- 法國
- 德國
- 義大利
- 荷蘭
- 俄羅斯
- 西班牙
- 烏克蘭
- 英國
- 其他歐洲地區
第6章 競爭情勢
- 關鍵策略舉措
- 市佔率分析
- 公司概況
- 公司簡介
- Yara International ASA
- OCI Global NV
- EuroChem Group
- ICL Group
- CF Industries Holdings, Inc.
- Grupa Azoty SA
- Haifa Group
- YILDIRIM Group
- Sociedad Quimica y Minera de Chile SA
- Achema AB(Achemos Grupe)
- PhosAgro PJSC
- Fertiberia, SA(Triton)
- K+S Aktiengesellschaft
- Uralchem JSC
- Timac Agro(Groupe Roullier)
第7章:CEO們需要思考的關鍵策略問題
The Europe fertilizers market is expected to grow from USD 55.3 billion in 2025 to USD 58.23 billion in 2026 and is forecast to reach USD 75.33 billion by 2031 at 5.29% CAGR over 2026-2031.
Robust demand stems from the European Union's Common Agricultural Policy eco-schemes, the Carbon Border Adjustment Mechanism, and investments in announced green-ammonia projects that will reconfigure nitrogen supply. Accelerated adoption of controlled-release and water-soluble products, growing investments in renewable energy-powered production, and the rebound in cereal acreage after the 2024 price rally further support growth. Producers face cost-side headwinds from natural-gas price volatility but are responding through vertical integration and renewable feedstock strategies. The Europe fertilizers market displays a fragmented concentration, with the top five firms controlling a minor share of the market size.
Europe Fertilizers Market Trends and Insights
EU CAP eco-schemes boosting balanced fertilization
The European Union allocates EUR 31 billion (USD 33.5 billion) each year through Common Agricultural Policy eco-schemes that reward nutrient plans minimizing nitrogen and phosphorus losses . These incentives encourage stabilized nitrogen, controlled-release coatings, and precision-application tools that align with environmental objectives. Large cereal growers in France and Germany are modernizing equipment to meet scheme criteria, driving sales of nitrification and urease inhibitors. Fertilizer firms bundle agronomy services with their products to capture value from compliance support. The program's performance-based payments reduce payback time on precision machinery, accelerating upgrades. Data-driven application planning also enhances yield consistency, reinforcing adoption momentum.
Surge in specialty fertilizer adoption for precision farming
High-resolution imagery from the Copernicus satellite program and on-farm sensors enable variable-rate applications that maximize nutrient efficiency . Controlled-release, liquid, and water-soluble formulations outperform conventional products under these data-driven regimes. Dutch greenhouse operators use fertigation dashboards that adjust nutrient mixes hourly, while Nordic cereal growers deploy coated urea to synchronize nitrogen release with crop uptake. Regional blending facilities tailor micronutrient profiles to local deficiencies, boosting efficacy. Producers offer subscription-based decision-support platforms, turning fertilizers into bundled agronomic solutions. Premium pricing is accepted because reduced losses offset higher product costs, creating a virtuous cycle for specialty growth.
Tightened nitrate and ammonia emission caps
The Netherlands caps nitrogen applications at 140 kg per hectare for grassland and 170 kg per hectare for arable crops, a cut of nearly 30% from historical norms. Denmark imposes soil-type quotas with stiff fines reaching USD 10,800 per hectare for exceedance. Farmers respond by reducing bulk urea purchases and increasing stabilized granular blends. The transition period dampens near-term demand because growers delay buying while recalibrating nutrient plans. Conventional broadcast practices face replacement by banded placement, lowering total volumes. Fertilizer companies must pivot to enhanced-efficiency lines and provide compliance advisory services, incurring additional costs yet opening premium sales.
Other drivers and restraints analyzed in the detailed report include:
- Rebound in cereal acreage after 2024 price rally
- CBAM-driven reshoring of nutrient production
- Natural-gas price volatility inflating production costs
For complete list of drivers and restraints, kindly check the Table Of Contents.
Segment Analysis
Straight fertilizers captured 76.85% of the Europe fertilizers market share in 2025, which is also the fastest-growing segment with a CAGR of 5.58% during the forecast period. Within this category, nitrogenous products are the primary nutrient input for wheat, corn, and rapeseed. The Europe fertilizers market size for complex fertilizers is growing because labor savings and single-pass convenience resonate with large German and French farms. Specialty micronutrient blends command premiums as soil tests reveal widespread zinc and boron deficiencies. Market participants invest in regional blending hubs to tailor nutrient ratios and improve delivery speed, supporting a modest but steady expansion of complex formulations.
With enhanced emission rules pushing for nutrient-use efficiency, ammonium nitrate is gaining share in emission-sensitive zones due to its lower volatilization potential. Urea remains dominant in Eastern Europe, where price sensitivity prevails. Secondary macronutrients such as sulfur experience heightened interest because sulfur deficits limit nitrogen uptake. Suppliers bundle secondary nutrients into NPK compounds to protect their share against specialty entrants. Overall, the segment's growth trajectory aligns with the broader adoption of balanced nutrition strategies and precision application technologies.
Conventional formulations accounted for 86.25% of the Europe fertilizers market size in 2025, and specialty formulations are forecast to grow at the fastest 5.72% CAGR through 2031. The Europe fertilizers market size for controlled-release coatings is expanding as polymer-coated urea demonstrates 10% yield gains in greenhouse tomatoes across Spain. Water-soluble grades serve high-density Dutch greenhouses that feed nutrients via drip systems. Liquid formulations support variable-rate aerial and tractor applications, allowing on-the-go adjustments based on sensor data. Slow-release products thrive in turf management where public green standards favor fewer applications.
Conventional granules still dominate bulk field crops because of price advantage and embedded equipment fleets. Tightening nutrient thresholds pushes growers toward specialty formulations that reduce losses and meet compliance targets. Innovators focus on biodegradable coatings and dual-nutrient release mechanisms to broaden appeal. ESG-conscious food brands prefer produce cultivated with enhanced-efficiency nutrients, influencing input choices across supply chains. Sustained R&D investment underlines the segment's role as the innovation engine of the Europe fertilizers market.
The Europe Fertilizers Market Report is Segmented by Type (Complex and Straight), by Form (Conventional and Specialty), Application Mode (Fertigation, Foliar, and Soil), Crop Type (Field Crops, Horticultural Crops, and Turf and Ornamental), and Geography (France, Germany, Italy, Netherlands, and More). The Report Offers the Market Size and Forecasts in Terms of Value (USD) and Volume (Metric Tons).
List of Companies Covered in this Report:
- Yara International ASA
- OCI Global N.V.
- EuroChem Group
- ICL Group
- CF Industries Holdings, Inc.
- Grupa Azoty S.A.
- Haifa Group
- YILDIRIM Group
- Sociedad Quimica y Minera de Chile S.A.
- Achema AB (Achemos Grupe)
- PhosAgro PJSC
- Fertiberia, S.A. (Triton)
- K+S Aktiengesellschaft
- Uralchem JSC
- Timac Agro (Groupe Roullier)
Additional Benefits:
- The market estimate (ME) sheet in Excel format
- 3 months of analyst support
TABLE OF CONTENTS
1 INTRODUCTION
- 1.1 Study Assumptions and Market Definition
- 1.2 Scope of the Study
- 1.3 Research Methodology
2 REPORT OFFERS
3 EXECUTIVE SUMMARY AND KEY FINDINGS
4 KEY INDUSTRY TRENDS
- 4.1 Acreage of Major Crop Types
- 4.1.1 Field Crops
- 4.1.2 Horticultural Crops
- 4.2 Average Nutrient Application Rates
- 4.2.1 Micronutrients
- 4.2.1.1 Field Crops
- 4.2.1.2 Horticultural Crops
- 4.2.2 Primary Nutrients
- 4.2.2.1 Field Crops
- 4.2.2.2 Horticultural Crops
- 4.2.3 Secondary Macronutrients
- 4.2.3.1 Field Crops
- 4.2.3.2 Horticultural Crops
- 4.2.1 Micronutrients
- 4.3 Agricultural Land Equipped for Irrigation
- 4.4 Regulatory Framework
- 4.5 Value Chain and Distribution Channel Analysis
- 4.6 Market Drivers
- 4.6.1 EU CAP eco-schemes boosting balanced fertilization
- 4.6.2 Surge in specialty fertilizer adoption for precision farming
- 4.6.3 Rebound in cereal acreage after 2024 price rally
- 4.6.4 Green-ammonia investments cutting supply-chain emissions
- 4.6.5 CBAM-driven reshoring of nutrient production
- 4.6.6 Rise of controlled-environment farms in Northern Europe
- 4.7 Market Restraints
- 4.7.1 Tightened nitrate and ammonia emission caps
- 4.7.2 Natural-gas price volatility inflating production costs
- 4.7.3 Rapid uptake of biostimulant substitutes
- 4.7.4 East-Europe logistics and sanction disruptions
5 MARKET SIZE AND GROWTH FORECASTS (VALUE AND VOLUME)
- 5.1 Type
- 5.1.1 Complex
- 5.1.2 Straight
- 5.1.2.1 Micronutrients
- 5.1.2.1.1 Boron
- 5.1.2.1.2 Copper
- 5.1.2.1.3 Iron
- 5.1.2.1.4 Manganese
- 5.1.2.1.5 Molybdenum
- 5.1.2.1.6 Zinc
- 5.1.2.1.7 Others
- 5.1.2.2 Nitrogenous
- 5.1.2.2.1 Ammonium Nitrate
- 5.1.2.2.2 Anhydrous Ammonia
- 5.1.2.2.3 Urea
- 5.1.2.2.4 Others
- 5.1.2.3 Phosphatic
- 5.1.2.3.1 DAP
- 5.1.2.3.2 MAP
- 5.1.2.3.3 SSP
- 5.1.2.3.4 TSP
- 5.1.2.3.5 Others
- 5.1.2.4 Potassic
- 5.1.2.4.1 MoP
- 5.1.2.4.2 SoP
- 5.1.2.4.3 Others
- 5.1.2.5 Secondary Macronutrients
- 5.1.2.5.1 Calcium
- 5.1.2.5.2 Magnesium
- 5.1.2.5.3 Sulfur
- 5.1.2.1 Micronutrients
- 5.2 Form
- 5.2.1 Conventional
- 5.2.2 Specialty
- 5.2.2.1 Controlled-Release Fertilizer (CRF)
- 5.2.2.2 Liquid Fertilizer
- 5.2.2.3 Slow-Release Fertilizer (SRF)
- 5.2.2.4 Water-Soluble
- 5.3 Application Mode
- 5.3.1 Fertigation
- 5.3.2 Foliar
- 5.3.3 Soil
- 5.4 Crop Type
- 5.4.1 Field Crops
- 5.4.2 Horticultural Crops
- 5.4.3 Turf and Ornamental
- 5.5 Geography
- 5.5.1 France
- 5.5.2 Germany
- 5.5.3 Italy
- 5.5.4 Netherlands
- 5.5.5 Russia
- 5.5.6 Spain
- 5.5.7 Ukraine
- 5.5.8 United Kingdom
- 5.5.9 Rest of Europe
6 COMPETITIVE LANDSCAPE
- 6.1 Key Strategic Moves
- 6.2 Market Share Analysis
- 6.3 Company Landscape
- 6.4 Company Profiles (Includes Global-level Overview, Market-level Overview, Core Segments, Financials as available, Strategic Information, Market Rank/Share for key companies, Products and Services, and Recent Developments)
- 6.4.1 Yara International ASA
- 6.4.2 OCI Global N.V.
- 6.4.3 EuroChem Group
- 6.4.4 ICL Group
- 6.4.5 CF Industries Holdings, Inc.
- 6.4.6 Grupa Azoty S.A.
- 6.4.7 Haifa Group
- 6.4.8 YILDIRIM Group
- 6.4.9 Sociedad Quimica y Minera de Chile S.A.
- 6.4.10 Achema AB (Achemos Grupe)
- 6.4.11 PhosAgro PJSC
- 6.4.12 Fertiberia, S.A. (Triton)
- 6.4.13 K+S Aktiengesellschaft
- 6.4.14 Uralchem JSC
- 6.4.15 Timac Agro (Groupe Roullier)
7 KEY STRATEGIC QUESTIONS FOR FERTILIZER CEOS
 緩釋肥料市場:2026-2032年全球市場預測(以包膜類型、作物類型、釋放週期、養分類型、施用方法、最終用途和銷售管道)
 2026年全球生物炭肥料市場報告幾丁質肥料市場:2026-2032年全球市場預測(按應用、類型、原料、配方和分銷管道分類)肥料包膜市場:2026-2032年全球市場預測(以包膜化學、釋放機制、包膜養分類型、外形規格、製造流程、最終用途及通路分類)化肥市場:2026-2032年全球市場預測(依產品類型、作物類型、包裝、施用方法、最終用戶和分銷管道分類)
 海藻土壤改良劑市場預測至 2034 年—按產品類型、海藻種類、形態、應用、養殖方法、通路和地區進行全球分析。藻類肥料市場:2026-2032年全球市場預測(依原料、產品類型、通路及應用分類)複合肥料市場:按產品類型、作物類型、物理形態和應用分類的全球市場預測,2026-2032年顆粒肥料市場:依產品類型、作物類型、配方類型、施用方法、包裝類型、使用時間、最終用戶和銷售管道分類-2026-2032年全球預測
 矽肥市場報告:按類型、形態、應用和地區分類(2026-2034年)