


 |
市場調查報告書
商品編碼
1911713
北美化肥:市佔率分析、產業趨勢與統計、成長預測(2026-2031)North America Fertilizers - Market Share Analysis, Industry Trends & Statistics, Growth Forecasts (2026 - 2031) |
||||||
※ 本網頁內容可能與最新版本有所差異。詳細情況請與我們聯繫。
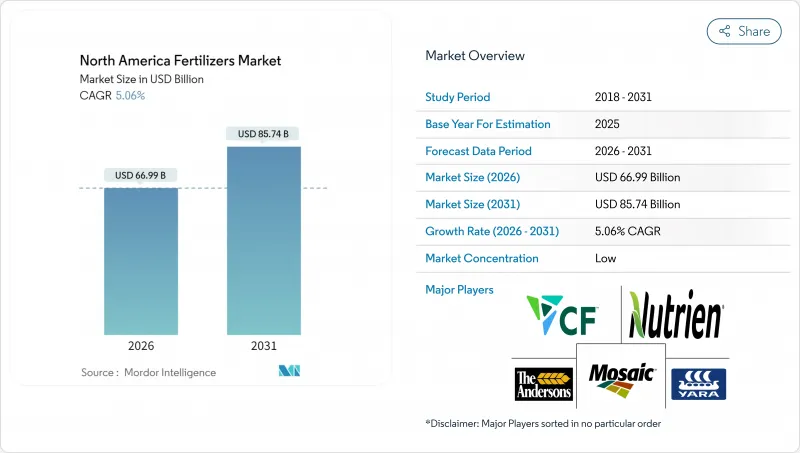
預計北美化肥市場規模將從 2025 年的 637.6 億美元成長到 2026 年的 669.9 億美元,到 2031 年將達到 857.4 億美元,2026 年至 2031 年的複合年成長率為 5.06%。
目前成長動能主要得益於玉米和大豆種植面積的擴大、國內產能的提升以降低進口風險,以及精密農業工具的應用,這些工具提高了約2.7億英畝農田的養分利用效率。種植者也面臨日益嚴格的環境法規,這些法規傾向於使用包膜性肥料和緩釋產品;同時,政府對綠色氨的激勵措施也推動了對低碳生產設施的新資本投資。 2021-2022年的運輸中斷事件後,供應韌性有所提升。然而,物流的改善和貨運成本的下降繼續支持產品標準化,使進口氯化鉀和磷酸鹽保持成本競爭力。由於區域土壤特性和作物多樣性限制了產品標準化,市場競爭仍然分散。這為專業混合商、農藝服務公司和基於平台的挑戰者提供了空間,使他們能夠在田間層面客製化解決方案。
北美化肥市場趨勢與洞察
美國玉米和大豆種植面積擴大
預計到2026年,玉米和大豆種植面積將達到9,620萬英畝。每增加100萬面積,大約需要18萬噸氮肥。可再生燃料標準和穩定的出口銷售支撐了這一成長。新的雜交品種能更有效利用氮肥,但由於面積的擴大,總消費量仍呈現上升趨勢。新增面積主要集中在愛荷華州、伊利諾州和內布拉斯加州,這些州依賴管道網路供應低成本的氨。連作玉米需要更高的氮肥施用量,這確保了未來十年的氮肥需求。
向高價值作物專用肥料過渡
加州中央谷地的果蔬種植者已在約280萬英畝的土地上施用了特殊肥料。緩釋顆粒肥料可減少人工投入,並持續供應營養,從而保護果實的大小、色澤和貨架期。水溶性肥料系列可與灌溉系統搭配使用,最佳化酪梨和柑橘園的施肥管理。有機肥料的高價有助於抵銷這些投入品的成本,其價格比標準肥料高出40%至60%。佛羅裡達州的柑橘種植者也採用類似的策略,透過強化微量元素施用方案來應對病害壓力。
天然氣價格波動推高了氮氣成本。
每噸氨的生產大約消耗2800萬至3000萬英熱單位的天然氣,因此化肥成本與亨利港天然氣期貨價格曾達到每百萬英熱單位9.50美元的高峰。季節性需求高峰和管道運輸限制加劇了價格波動。製造商盡可能地對沖燃料成本,但農民在早春用氣高峰期也會感受到更高的價格。
細分市場分析
截至2025年,單一成分肥料將佔北美肥料市場佔有率的79.90%。這一數字表明,大型糧食生產商仍然依賴可靠且低成本的單一營養素產品。氮肥在該類別中佔據主導地位,因為大平原和中西部地區的玉米和小麥面積推動了穩定的需求。複合肥料將多種營養素結合在單一顆粒肥料中,其成長率最高,到2031年將達到6.72%的複合年成長率,因為特種作物生產商更傾向於使用均衡配方,以減少施肥次數並降低人事費用。
鉀肥市場也將維持6.72%的成長,這主要得益於加拿大鉀礦的開採以及鉀肥在抗旱和提高作物品質方面作用的廣泛認可。所有三種肥料類型的包膜肥需求都在快速成長,因為聚合物和硫磺層可以減少養分流失,幫助農民滿足水質法規的要求。隨著嚴格的土壤檢測發現鋅、錳和硼的缺乏,在單一配方肥料中添加微量元素的做法也變得越來越普遍。這種轉變,即採用變數施肥系統將適當的肥料施用於適當的區域,反映了高產量需要比傳統的「固定劑量」NPK施肥方法更精準的養分管理。
到2025年,傳統肥料將佔總銷售額的82.60%,因為注重成本的糧食生產商將繼續採用久經考驗的成熟肥料。特種肥料領域將以5.55%的複合年成長率引領產業,因為水質法規和不斷上漲的勞動力成本使得單次施肥方案比多次施肥方案更受歡迎。高價值水果、堅果和蔬菜種植者願意為緩釋包衣肥料支付溢價,因為這種肥料可以提高養分利用率並保護產品品質。
液態肥料因其可透過輸液設備實現高流動性而日益普及,操作人員可以隨時調整施肥量。這些包膜技術的研發需要大量資金和專業知識,從而保護現有生產商免受仿冒者的侵害。目前,研發工作主要集中在開發更強的包膜和更穩定的釋放曲線,以確保養分輸送能每日滿足作物需求。
北美肥料市場報告按類型(複合肥與單質肥)、形態(常規肥與特種肥)、施用方法(土壤施用、葉面噴布等)、作物類型(田間作物、園藝作物等)和地區(美國、加拿大、墨西哥等)進行細分。市場預測以價值(美元)和數量(公噸)為單位。
其他福利:
- Excel格式的市場預測(ME)表
- 3個月的分析師支持
目錄
第1章 引言
- 研究假設和市場定義
- 調查範圍
- 調查方法
第2章 報告
第3章執行摘要
第4章 主要產業趨勢
- 主要農作物種植面積
- 田間作物
- 園藝作物
- 平均施肥量
- 微量營養素
- 田間作物
- 園藝作物
- 關鍵營養素
- 田間作物
- 園藝作物
- 次要大量營養元素
- 田間作物
- 園藝作物
- 微量營養素
- 具有灌溉設施的農田
- 法律規範
- 價值鍊和通路分析
- 市場促進因素
- 美國玉米和大豆種植面積擴大
- 向高價值作物專用肥料過渡
- 聯邦和州政府對綠色氨廠的獎勵措施
- 強制生質燃料燃料導致氮需求增加
- 再生農業推動了微量元素肥料的發展
- 需要水溶性氮磷鉀肥的受控環境農業
- 市場限制
- 天然氣價格波動推高了氮氣成本。
- 加強對五大湖流域磷酸鹽徑流的監管
- 農場內對動物糞便進行養分循環利用,可以減少合成肥料的需求。
- 聖勞倫斯航道鉀肥運輸瓶頸
第5章 市場規模和成長預測(價值和數量)
- 類型
- 合成的
- 單身的
- 微量營養素
- 鋅
- 錳
- 銅
- 鐵
- 硼
- 鉬
- 其他微量營養素
- 氮
- 尿素
- 硝酸銨
- 無水氨
- 其他氮
- 磷酸鹽
- 磷酸一銨(MAP)
- 磷酸二銨(DAP)
- 單過磷酸鈣(SSP)
- 三重過磷酸鈣(TSP)
- 其他磷酸鹽
- 鉀
- 氯化鉀(MoP)
- 硫酸鉀(SoP)
- 其他鉀
- 次要大量營養素
- 鈣
- 鎂
- 硫
- 微量營養素
- 按形式
- 傳統的
- 特殊肥料
- 控制釋放肥料(CRF)
- 緩效性肥料(SRF)
- 液體肥料
- 水溶性
- 透過應用方法
- 土壤
- 葉面噴布
- 施肥和灌溉
- 按作物類型
- 田間作物
- 園藝作物
- 草坪和觀賞植物
- 按國家/地區
- 美國
- 加拿大
- 墨西哥
- 北美其他地區
第6章 競爭情勢
- 關鍵策略舉措
- 市佔率分析
- 公司概況
- 公司簡介
- CF Industries Holdings, Inc.
- Nutrien Ltd.
- The Mosaic Company
- Yara International ASA
- The Andersons Inc.
- Haifa Chemicals Ltd.
- OCI Nitrogen
- Intrepid Potash, Inc.
- JR Simplot Company
- Koch Fertilizer LLC
- Wilbur-Ellis Company LLC
- K+S Aktiengesellschaft
- EuroChem Group AG
- IFFCO Canada Enterprise Ltd.
- ICL Group Ltd.
第7章:CEO們需要思考的關鍵策略問題
The North America fertilizers market is expected to grow from USD 63.76 billion in 2025 to USD 66.99 billion in 2026 and is forecast to reach USD 85.74 billion by 2031 at 5.06% CAGR over 2026-2031.
Current momentum is driven by expanding corn and soybean acreage, domestic capacity additions that reduce import risk, and precision agriculture tools that push nutrient use efficiency across roughly 270 million cultivated acres. Producers also face tightening environmental rules that reward coated and controlled-release products, while government incentives for green ammonia encourage fresh capital investment in low-carbon production assets. Supply resilience has improved after the 2021-2022 transport disruptions. However, logistics upgrades and freight cost declines continue to support the standardization of products, keeping imported potash and phosphates cost-competitive. Competitive intensity remains fragmented because regional soil variability and crop diversity limit product standardization. This opens space for specialty blenders, agronomy service firms, and platform-based challengers that tailor solutions at the field level.
North America Fertilizers Market Trends and Insights
Expansion of United States corn-and-soy acreage
Corn and soybean plantings are anticipated to reach 96.2 million acres by 2026. Each extra million acres calls for about 180,000 metric tons of nitrogen fertilizer. Growth is tied to renewable fuel standards and steady export sales. Although new hybrids use nitrogen more efficiently, the larger footprint keeps total consumption on an upward path. Most new acres sit in Iowa, Illinois, and Nebraska, where pipeline networks carry low-cost ammonia. When corn follows corn, fields need heavier nitrogen programs, which secures demand for the rest of the decade.
Shift toward specialty fertilizers for high-value crops
Fruit, nut, and vegetable growers in California's Central Valley have already adopted specialty products on roughly 2.8 million acres. Controlled-release granules cut labor and deliver steady nutrition that protects fruit size, color, and shelf life. Water-soluble lines work with fertigation systems that fine-tune feeding in avocado and citrus orchards. Organic premiums help offset the higher price of these inputs, which often run 40 to 60% above standard grades. Florida citrus growers employ the same strategy to fight disease pressure with intensive micronutrient programs.
Volatile natural-gas prices are inflating nitrogen costs
Ammonia production uses roughly 28 to 30 MMBtu of natural gas for every metric ton, so fertilizer costs rise and fall with Henry Hub futures that peaked at USD 9.50 per MMBtu during the 2024 winter heating season. Seasonal demand surges and pipeline constraints amplify the volatility. Manufacturers hedge fuel costs where possible, yet farmers still see higher prices in spring when usage spikes.
Other drivers and restraints analyzed in the detailed report include:
- Federal and state incentives for green-ammonia plants
- Biofuel blending mandates boosting nitrogen demand
- Stricter regulations on phosphate runoff in the Great Lakes basin
For complete list of drivers and restraints, kindly check the Table Of Contents.
Segment Analysis
Straight fertilizers accounted for 79.90% of North America fertilizers market share in 2025, a figure indicating that large-scale grain growers continue to rely on single nutrient products for dependable, low-cost coverage. Nitrogen grades dominate this group because the acres of corn and wheat across the Great Plains and Midwest drive steady demand. Complex blends, which combine several nutrients into one prill, post the fastest 6.72% CAGR through 2031, as specialty-crop growers favor balanced mixes that reduce application passes and lower labor costs.
Potassic grades match that 6.72% pace owing to Canada's potash mines and a wider appreciation of potassium's role in drought defense and quality gains. Coated versions of all three fertilizer types are gaining popularity rapidly because polymer and sulfur layers help curb nutrient losses and enable farms to meet water quality regulations. Precision soil tests flag growing gaps in zinc, manganese, and boron, so micronutrient add-ons within straight formulations are becoming more common. Variable rate rigs then drop the right product in the right zone, a shift that reflects an era when higher yields demand far more targeted nutrition than the old "blanket" NPK approach.
Conventional fertilizer accounted for 82.60% of revenue in 2025, as cost conscious grain producers stick with proven workhorses. The specialty fertilizer segment, is pacing the field with an 5.55% CAGR, driven by water-quality mandates and rising labor costs that favor single shot programs over multiple trips. Growers in high value fruit, nut, and vegetable sectors willingly pay premiums when slow-release coatings boost nutrient use efficiency and protect product quality.
Liquids also gain ground because they flow through injection equipment that lets operators tweak rates on the fly. Building those coatings requires significant capital and expertise, which shields established manufacturers from quick copycats. Most research now focuses on developing tougher shells and steadier release curves, ensuring that nutrient supply matches crop demand on a daily basis.
The North America Fertilizers Market Report is Segmented by Type (Complex and Straight), by Form (Conventional and Specialty), by Application Mode (Soil, Foliar, and More), by Crop Type (Field Crops, Horticultural Crops, and More), and by Geography (United States, Canada, Mexico, and More). The Market Forecasts are Provided in Terms of Value (USD) and Volume (Metric Tons).
List of Companies Covered in this Report:
- CF Industries Holdings, Inc.
- Nutrien Ltd.
- The Mosaic Company
- Yara International ASA
- The Andersons Inc.
- Haifa Chemicals Ltd.
- OCI Nitrogen
- Intrepid Potash, Inc.
- J. R. Simplot Company
- Koch Fertilizer LLC
- Wilbur-Ellis Company LLC
- K+S Aktiengesellschaft
- EuroChem Group AG
- IFFCO Canada Enterprise Ltd.
- ICL Group Ltd.
Additional Benefits:
- The market estimate (ME) sheet in Excel format
- 3 months of analyst support
TABLE OF CONTENTS
1 INTRODUCTION
- 1.1 Study Assumptions and Market Definition
- 1.2 Scope of the Study
- 1.3 Research Methodology
2 REPORT OFFERS
3 EXECUTIVE SUMMARY
4 KEY INDUSTRY TRENDS
- 4.1 Acreage of Major Crop Types
- 4.1.1 Field Crops
- 4.1.2 Horticultural Crops
- 4.2 Average Nutrient Application Rates
- 4.2.1 Micronutrients
- 4.2.1.1 Field Crops
- 4.2.1.2 Horticultural Crops
- 4.2.2 Primary Nutrients
- 4.2.2.1 Field Crops
- 4.2.2.2 Horticultural Crops
- 4.2.3 Secondary Macronutrients
- 4.2.3.1 Field Crops
- 4.2.3.2 Horticultural Crops
- 4.2.1 Micronutrients
- 4.3 Agricultural Land Equipped For Irrigation
- 4.4 Regulatory Framework
- 4.5 Value Chain and Distribution Channel Analysis
- 4.6 Market Drivers
- 4.6.1 Expansion of U.S. corn-and-soy acreage
- 4.6.2 Shift toward specialty fertilizers for high-value crops
- 4.6.3 Federal and state incentives for green-ammonia plants
- 4.6.4 Biofuel blending mandates boosting nitrogen demand
- 4.6.5 Regenerative farming driving micronutrient blends
- 4.6.6 Controlled-environment agriculture requiring water-soluble NPK
- 4.7 Market Restraints
- 4.7.1 Volatile natural-gas prices inflating nitrogen costs
- 4.7.2 Stricter regulations on phosphate runoff in the Great Lakes basin
- 4.7.3 On-farm manure nutrient recycling curbing synthetic demand
- 4.7.4 Potash logistics bottlenecks via St. Lawrence Seaway
5 MARKET SIZE AND GROWTH FORECASTS (VALUE AND VOLUME)
- 5.1 Type
- 5.1.1 Complex
- 5.1.2 Straight
- 5.1.2.1 Micronutrients
- 5.1.2.1.1 Zinc
- 5.1.2.1.2 Manganese
- 5.1.2.1.3 Copper
- 5.1.2.1.4 Iron
- 5.1.2.1.5 Boron
- 5.1.2.1.6 Molybdenum
- 5.1.2.1.7 Other Micronutrient
- 5.1.2.2 Nitrogenous
- 5.1.2.2.1 Urea
- 5.1.2.2.2 Ammonium Nitrate
- 5.1.2.2.3 Anhydrous Ammonia
- 5.1.2.2.4 Other Nitrogenous
- 5.1.2.3 Phosphatic
- 5.1.2.3.1 Monoammonium Phosphate (MAP)
- 5.1.2.3.2 Diammonium Phosphate (DAP)
- 5.1.2.3.3 Single Super Phosphate (SSP)
- 5.1.2.3.4 Triple Super Phosphate (TSP)
- 5.1.2.3.5 Other Phosphatic
- 5.1.2.4 Potassic
- 5.1.2.4.1 Muriate of Potash (MoP)
- 5.1.2.4.2 Sulfate of Potash (SoP)
- 5.1.2.4.3 Other Potassic
- 5.1.2.5 Secondary Macronutrients
- 5.1.2.5.1 Calcium
- 5.1.2.5.2 Magnesium
- 5.1.2.5.3 Sulfur
- 5.1.2.1 Micronutrients
- 5.2 By Form
- 5.2.1 Conventional
- 5.2.2 Specialty
- 5.2.2.1 Controlled Release Fertilizer (CRF)
- 5.2.2.2 Slow Release Fertilizer (SRF)
- 5.2.2.3 Liquid Fertilizers
- 5.2.2.4 Water-Soluble
- 5.3 By Application Mode
- 5.3.1 Soil
- 5.3.2 Foliar
- 5.3.3 Fertigation
- 5.4 By Crop Type
- 5.4.1 Field Crops
- 5.4.2 Horticultural Crops
- 5.4.3 Turf and Ornamental
- 5.5 By Country
- 5.5.1 United States
- 5.5.2 Canada
- 5.5.3 Mexico
- 5.5.4 Rest of North America
6 COMPETITIVE LANDSCAPE
- 6.1 Key Strategic Moves
- 6.2 Market Share Analysis
- 6.3 Company Landscape
- 6.4 Company Profiles (Includes Global Overview, Market Overview, Core Segments, Financials, Strategic Information, Market Rank/Share, Products and Services, and Recent Developments)
- 6.4.1 CF Industries Holdings, Inc.
- 6.4.2 Nutrien Ltd.
- 6.4.3 The Mosaic Company
- 6.4.4 Yara International ASA
- 6.4.5 The Andersons Inc.
- 6.4.6 Haifa Chemicals Ltd.
- 6.4.7 OCI Nitrogen
- 6.4.8 Intrepid Potash, Inc.
- 6.4.9 J. R. Simplot Company
- 6.4.10 Koch Fertilizer LLC
- 6.4.11 Wilbur-Ellis Company LLC
- 6.4.12 K+S Aktiengesellschaft
- 6.4.13 EuroChem Group AG
- 6.4.14 IFFCO Canada Enterprise Ltd.
- 6.4.15 ICL Group Ltd.
7 KEY STRATEGIC QUESTIONS FOR FERTILIZER CEOS
 緩釋肥料市場:2026-2032年全球市場預測(以包膜類型、作物類型、釋放週期、養分類型、施用方法、最終用途和銷售管道)
 2026年全球生物炭肥料市場報告幾丁質肥料市場:2026-2032年全球市場預測(按應用、類型、原料、配方和分銷管道分類)肥料包膜市場:2026-2032年全球市場預測(以包膜化學、釋放機制、包膜養分類型、外形規格、製造流程、最終用途及通路分類)化肥市場:2026-2032年全球市場預測(依產品類型、作物類型、包裝、施用方法、最終用戶和分銷管道分類)
 海藻土壤改良劑市場預測至 2034 年—按產品類型、海藻種類、形態、應用、養殖方法、通路和地區進行全球分析。藻類肥料市場:2026-2032年全球市場預測(依原料、產品類型、通路及應用分類)複合肥料市場:按產品類型、作物類型、物理形態和應用分類的全球市場預測,2026-2032年顆粒肥料市場:依產品類型、作物類型、配方類型、施用方法、包裝類型、使用時間、最終用戶和銷售管道分類-2026-2032年全球預測
 矽肥市場報告:按類型、形態、應用和地區分類(2026-2034年)