


 |
市場調查報告書
商品編碼
1911711
尿素:市佔率分析、產業趨勢與統計、成長預測(2026-2031)Urea - Market Share Analysis, Industry Trends & Statistics, Growth Forecasts (2026 - 2031) |
||||||
※ 本網頁內容可能與最新版本有所差異。詳細情況請與我們聯繫。
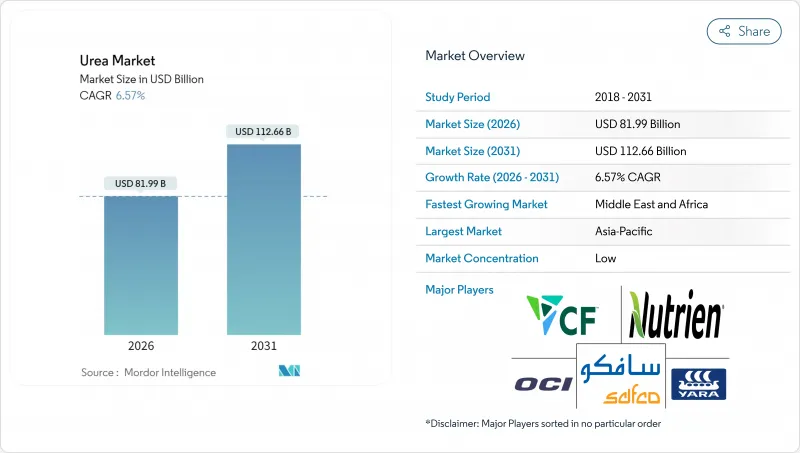
2025年尿素市值為769.5億美元,預計到2031年將達到1126.6億美元,而2026年為819.9億美元。
預計在預測期(2026-2031 年)內,複合年成長率將達到 6.57%。
需求持續上升,同時糧食面積的快速擴張和首批商業規模的綠氫能計劃正在重塑生產經濟格局。擁有長期天然氣合約的生產商能夠在價格上漲期間保障利潤,而分散式港口設施和可再生氨生產設施正開始改變區域成本曲線。同時,政府日益嚴格的溢油限制措施推動了對平均售價更高的包覆和穩定劑產品的需求。這些協同效應正在推動原料採購的策略性避險、與物流資產的更深層整合,以及高效能肥料配方研發的加速發展。
全球尿素市場趨勢及展望
全球糧食種植面積擴大
隨著全球穀物種植面積的擴大,農民力爭2030年將產量提高28%,氮肥需求也隨之穩定成長。印度、中國和非洲部分地區的高產小麥、稻米和玉米計畫正在大量消耗與GPS導航噴霧器相容的顆粒尿素。奈米尿素在印度的引入表明,最佳化施肥量可以在不減少養分供應的情況下降低對環境的影響。撒哈拉以南非洲地區的政府投入補貼進一步提高了化肥施用量,並促進了小規模農戶使用緩釋氮肥包膜產品。巴西國家肥料計畫正在支持大豆和玉米面積的擴大,同時提升國內產能以減少對進口的依賴。有利的商品價格正在維持面積的成長,並鞏固尿素市場的長期消費基礎。
氮在肥料中的重要性
在全球範圍內,玉米、油菜、棉花、高粱、水稻、小麥和大豆等作物是必需營養元素的主要消耗者。這些主要作物對營養元素的需求各不相同,預計到2024年,大量元素的平均施用量將在120.97公斤/公頃至255.75公斤/公頃之間。這些營養元素對於維持植物代謝過程以及細胞、細胞膜和葉綠素等重要組織的生長和發育至關重要。氮肥仍是施用最廣泛的營養元素,平均施用量為224.6公斤/公頃。隨著田間作物種植面積的不斷擴大,尤其是在南美洲和亞太地區,歐洲和北美等面臨營養元素缺乏的地區也擴大採用尿素專用肥料,因為其具有較高的肥效。
天然氣價格波動會推高生產成本。
原料成本佔尿素出廠價格的80%之多。 2022年,當歐洲基準天然氣價格超過每兆瓦時300歐元(324美元)時,一些工廠為了避免虧損選擇停產。沙烏地阿拉伯基礎工業公司(SABIC)等一體化上游生產商透過自有天然氣供應維持了盈利。其他企業雖然制定了避險計劃,但如果現貨價格飆升超過其避險期限,仍將面臨資金外流。這種波動性正在加速向天然氣供應穩定的地區轉移,推動模組化工廠採用氨進口,並隨著電價下降重新激發人們對可再生氫的興趣。
細分市場分析
水溶性尿素肥料預計將成為特種尿素肥料市場的主導細分市場,到2025年將佔40.35%的市場佔有率。尿素具有高氮含量和優異的水溶性,能夠顯著提高植物根係對氮的吸收,進而促進植物生長。此細分市場的主導地位主要歸因於土壤中氮含量的下降,而土壤氮含量下降的主要原因是氣候變遷的影響,例如全球乾旱、熱浪和水資源短缺的加劇。農民越來越傾向於使用水溶性尿素肥料,因為它既能確保穩定的氮供應,又能降低氮流失和揮發的風險,從而減少環境和地下水污染。緩釋尿素是成長最快的細分市場,預計從2026年到2031年將以7.28%的複合年成長率成長,因為農民和農業相關企業擴大採用提高效率的材料來減少氮流失並滿足永續性標準。聚合物包膜和聚合物硫包膜製劑能夠增強養分釋放,最大限度地減少養分淋溶和揮發,並透過減少施肥頻率來提高勞動效率。養分管理方面的監管要求以及穀物、油籽和特種作物中控釋肥料使用量的增加,進一步推動了這一成長。受種植者提高產量和減少環境影響的需求驅動,控釋尿素的需求逐年加速成長。
本尿素市場報告將產業細分為以下幾個部分:特種類型(控釋尿素肥、液體肥料、控釋顆粒尿素、水溶性尿素)、作物類型(田間作物、園藝作物、草坪和觀賞植物)、形態(常規型和特種型)以及地區(亞太地區、歐洲、中東和非洲、北美、南美)。市場規模以價值(美元)和數量(公噸)表示。
區域分析
到2025年,亞太地區將佔總收入的44.92%,這主要得益於中國和印度糧食種植的密集化。越南、印尼和菲律賓耕地面積的擴大以及機械化施肥設備的普及將進一步推動成長。在中國,化肥減量政策推動了奈米尿素和包膜肥料的使用,導致每公頃投入增加,但養分總量保持穩定。在印度,補貼改革促進了養分均衡管理,提高了對高價值複合肥料的需求,使其超過通用顆粒肥料。此外,東協氫能藍圖正在為低碳氨進口做準備,這有望支持未來的綠色尿素生產。
中東和非洲是成長最快的地區,預計複合年成長率將達到9.17%。這一成長主要得益於沙烏地阿拉伯、阿拉伯聯合大公國和奈及利亞的產能擴張,以及低成本天然氣帶來的出口競爭力提升。當地的農業補貼計畫也刺激了內陸地區的需求。奈及利亞的丹格特綜合體同時服務國內市場和西非市場,降低了對外國進口的依賴。波灣合作理事會(GCC)成員國正在探索利用太陽能電解生產綠色氨的工廠,以吸引來自歐洲和亞洲的注重碳排放的買家。然而,撒哈拉以南非洲部分地區的基礎設施不足和政治不穩定構成了挑戰,儘管捐助者支持的農業推廣計畫仍在繼續推動化肥的推廣應用。
北美和歐洲的成長軌跡成熟而穩定。在北美,頁岩氣使化肥廠能夠保持成本優勢,位列生產商前25%,從而維持了對拉丁美洲的出口。在歐洲,更嚴格的農業政策(例如營養素含量上限)促使顆粒包衣化肥產品廣泛使用。德國和比利時的進口碼頭正在拓展採購管道,在天然氣價格高企時期,從北非和中東進口的氨彌補了本地產量的下降。
其他福利:
- Excel格式的市場預測(ME)表
- 3個月的分析師支持
目錄
第1章 引言
- 研究假設和市場定義
- 調查範圍
- 調查方法
第2章 報告
第3章執行摘要主要發現
第4章 主要產業趨勢
- 主要農作物種植面積
- 田間作物
- 園藝作物
- 平均施肥量
- 微量營養素
- 田間作物
- 園藝作物
- 微量營養素
- 宏量營養素
- 田間作物
- 園藝作物
- 具有灌溉設施的農田
- 法律規範
- 價值鍊和通路分析
- 市場促進因素
- 擴大糧食作物種植面積
- 肥料中氮作為大量營養元素的依賴性
- 尿素相對於其他氮肥的成本優勢
- 顆粒尿素在精密農業中越來越受歡迎
- 提高可再生氫基綠色尿素的生產能力
- 港口沿線的模組化尿素工廠可降低物流成本
- 市場限制
- 天然氣價格波動導致生產成本增加
- 加強氮肥使用相關的徑流和溫室氣體排放法規
- 硝酸銨和尿素硝銨溶液的替代威脅
- 地緣政治貿易路線中斷
第5章 市場規模和成長預測(價值和數量)
- 專業類型
- CRF
- 聚合物塗層
- 聚合物和硫塗層
- 其他
- 液體肥料
- SRF
- 水溶性
- CRF
- 作物類型
- 田間作物
- 園藝作物
- 草坪和觀賞植物
- 形式
- 傳統的
- 特別的
- 地區
- 亞太地區
- 澳洲
- 孟加拉
- 中國
- 印度
- 印尼
- 日本
- 巴基斯坦
- 菲律賓
- 泰國
- 越南
- 亞太其他地區
- 歐洲
- 法國
- 德國
- 義大利
- 荷蘭
- 俄羅斯
- 西班牙
- 烏克蘭
- 英國
- 其他歐洲地區
- 中東和非洲
- 奈及利亞
- 沙烏地阿拉伯
- 南非
- 土耳其
- 其他中東和非洲地區
- 北美洲
- 加拿大
- 墨西哥
- 美國
- 北美其他地區
- 南美洲
- 阿根廷
- 巴西
- 南美洲其他地區
- 亞太地區
第6章 競爭情勢
- 關鍵策略舉措
- 市佔率分析
- 公司簡介
- 公司簡介。
- CF Industries Holdings, Inc.
- Coromandel International Ltd.
- EuroChem Group
- Indian Farmers Fertiliser Cooperative Limited
- Koch Industries Inc.
- Nutrien Ltd.
- OCI NV
- SABIC Agri-Nutrients Co.
- Yara International ASA
- Qatar Fertiliser Company(QAFCO)
- PT Pupuk Kalimantan Timur
- Rashtriya Chemicals and Fertilizers Limited
- Acron Group(Acron PJSC)
- BASF SE
- URALCHEM Holding PLC
- The Mosaic Company
第7章:CEO們需要思考的關鍵策略問題
The urea market was valued at USD 76.95 billion in 2025 and estimated to grow from USD 81.99 billion in 2026 to reach USD 112.66 billion by 2031, at a CAGR of 6.57% during the forecast period (2026-2031).
Rapid cereal acreage expansion and the first commercial green hydrogen projects are reshaping production economics while keeping demand on an upward trajectory. Producers with long-term natural gas contracts protect margins during price spikes, yet distributed port-side plants and renewable-powered ammonia units are beginning to reset regional cost curves. In parallel, governments tighten runoff rules, which steer demand toward coated and stabilized products that command higher average selling prices. These converging forces encourage strategic hedging in feedstock sourcing, deeper integration with logistics assets, and accelerated R&D in enhanced-efficiency fertilizer formulations.
Global Urea Market Trends and Insights
Intensifying Cereal Crop Cultivation Worldwide
Escalating global cereal acreage keeps nitrogen demand on a solid climb as farmers strive to meet a 28% production increase by 2030. High-yield wheat, rice, and maize programs in India, China, and parts of Africa absorb large volumes of granular urea that are compatible with GPS-guided spreaders. India's nano urea rollout shows how dosage optimization can reduce environmental load without cutting nutrient supply. Government input subsidies in Sub-Saharan Africa further lift application rates and introduce smallholder farmers to coated products that slow nitrogen release. Brazil's Plano Nacional de Fertilizantes backs domestic capacity to curb import reliance while supporting expanding soybean and corn acreages. Favorable commodity prices sustain acreage gains, strengthening long-run consumption fundamentals for the urea market.
Fertilizers reliance on nitrogen as a key nutrient
Globally, crops such as corn, rapeseed, cotton, sorghum, rice, wheat, and soybeans are major consumers of essential nutrients. In 2024, these key crops exhibit varying nutritional requirements, with an average application rate of primary nutrients ranging from 120.97 kg/ha to 255.75 kg/ha. These nutrients are critical for supporting plant metabolic processes and the development of essential tissues, including cells, membranes, and chlorophyll. Nitrogen remains the most widely applied nutrient, with an average application rate of 224.6 kg/ha. As the cultivation area for field crops continues to expand, particularly in South America and the Asia-Pacific regions, regions such as Europe and North America, facing nutrient deficiencies, are increasingly adopting urea specialty fertilizers due to their efficiency.
Natural Gas Price Volatility Raising Production Costs
Feedstock accounts for up to 80% of ex-works urea pricing. When European benchmark gas cleared EUR 300 per MWh (USD 324 per MWh) in 2022, several plants idled rather than operate at negative margins. Producers with upstream integration, such as SABIC in Saudi Arabia, preserve profitability through captive gas. Others deploy hedging programs, yet still confront cash burn when spot spikes surpass hedge coverage. This volatility quickens the shift toward regions with stable gas supply, stimulates adoption of ammonia imports for modular plants, and rekindles interest in renewable hydrogen at declining power tariffs.
Other drivers and restraints analyzed in the detailed report include:
- Cost Advantage of Urea Versus Other Nitrogen Fertilizers
- Growing Preference for Granular Urea in Precision Farming
- Tightening Runoff and Greenhouse Gas Regulations on Nitrogen Use
For complete list of drivers and restraints, kindly check the Table Of Contents.
Segment Analysis
Water-soluble urea fertilizers have emerged as the dominant segment in the specialty urea fertilizers market, commanding 40.35% market share in 2025. Urea, being rich in nitrogen and easily soluble in water, significantly enhances nitrogen uptake by plant roots, thereby stimulating growth. The segment's dominance is primarily driven by shifting climatic patterns, including droughts, heatwaves, and escalating water scarcity worldwide, which have curtailed nitrogen availability in soils. Farmers increasingly prefer water-soluble urea fertilizers as they ensure a consistent nitrogen supply while mitigating nitrogen leaching, volatilization, and associated risks of environmental pollution and groundwater contamination.Controlled-release urea is the fastest-growing segment with a CAGR of 7.28% during the forecast period 2026-2031, as farmers and agribusinesses increasingly adopt efficiency-enhancing inputs to reduce nitrogen losses and comply with sustainability standards. Polymer-coated and polymer sulfur-coated formulations provide extended nutrient release, minimizing leaching and volatilization while improving labor efficiency through reduced application frequency. This growth is further driven by regulatory requirements for nutrient management and the rising use of controlled-release fertilizers in cereals, oilseeds, and specialty crops. The demand for controlled-release urea is accelerating year-on-year as growers aim to achieve higher productivity with reduced environmental impact.
The Urea Market Report Segments the Industry Into Speciality Type (CRF, Liquid Fertilizer, SRF, and Water Soluble), Crop Type (Field Crops, Horticultural Crops, and Turf & Ornamental), Form (Conventional and Speciality), and Region (Asia-Pacific, Europe, Middle East & Africa, North America, and South America). The Market Size is Provided in Terms of Value(USD) and Volume(Metric Tons).
Geography Analysis
Asia-Pacific accounted for 44.92% of 2025 revenue, driven by intensive cereal cultivation in China and India. Growth is further supported by expanding acreage and the adoption of mechanized fertilizing equipment in Vietnam, Indonesia, and the Philippines. In China, fertilizer reduction mandates are encouraging the use of nano urea and coated products, leading to higher spending per hectare despite stable total nutrient tonnage. In India, subsidy reforms promote balanced nutrient management, increasing demand for higher-value formulations over generic prills. Additionally, the ASEAN hydrogen roadmap is preparing the region for low-carbon ammonia imports, which could support future green urea production.
The Middle East and Africa are the fastest-growing regions, with a projected CAGR of 9.17%. Growth is driven by capacity expansions in Saudi Arabia, the UAE, and Nigeria, supported by low-cost gas that enhances export competitiveness. Local farm subsidy programs are also boosting demand in inland areas. Nigeria's Dangote complex serves both domestic and West African markets, reducing dependency on offshore imports. Gulf Cooperation Council countries are exploring solar-powered electrolyzers for green ammonia production, positioning themselves to attract carbon-conscious buyers in Europe and Asia. However, infrastructure gaps and political instability in parts of Sub-Saharan Africa pose challenges, though donor-backed agronomic extension programs continue to support fertilizer adoption.
North America and Europe exhibit mature but steady growth trajectories. In North America, shale gas ensures that fertilizer plants remain among the first-quartile cost producers, sustaining export flows to Latin America. In Europe, stricter farm policies on nutrient caps are driving the adoption of granular coated products. Import terminals in Germany and Belgium are expanding sourcing options, with ammonia imports from North Africa and the Middle East compensating for reduced local production during periods of high gas prices.
- CF Industries Holdings, Inc.
- Coromandel International Ltd.
- EuroChem Group
- Indian Farmers Fertiliser Cooperative Limited
- Koch Industries Inc.
- Nutrien Ltd.
- OCI NV
- SABIC Agri-Nutrients Co.
- Yara International ASA
- Qatar Fertiliser Company (QAFCO)
- PT Pupuk Kalimantan Timur
- Rashtriya Chemicals and Fertilizers Limited
- Acron Group (Acron PJSC)
- BASF SE
- URALCHEM Holding P.L.C.
- The Mosaic Company
Additional Benefits:
- The market estimate (ME) sheet in Excel format
- 3 months of analyst support
TABLE OF CONTENTS
1 INTRODUCTION
- 1.1 Study Assumptions & Market Definition
- 1.2 Scope of the Study
- 1.3 Research Methodology
2 REPORT OFFERS
3 EXECUTIVE SUMMARY & KEY FINDINGS
4 KEY INDUSTRY TRENDS
- 4.1 Acreage Of Major Crop Types
- 4.1.1 Field Crops
- 4.1.2 Horticultural Crops
- 4.2 Average Nutrient Application Rates
- 4.2.1 Micronutrients
- 4.2.1.1 Field Crops
- 4.2.1.2 Horticultural Crops
- 4.2.1 Micronutrients
- 4.3 Primary Nutrients
- 4.3.1 Field Crops
- 4.3.2 Horticultural Crops
- 4.4 Agricultural Land Equipped For Irrigation
- 4.5 Regulatory Framework
- 4.6 Value Chain & Distribution Channel Analysis
- 4.7 Market Drivers
- 4.7.1 Intensifying cereal crop cultivation
- 4.7.2 Fertilizers reliance on nitrogen as a key nutrient
- 4.7.3 Cost advantage of urea versus other nitrogen fertilizers
- 4.7.4 Growing preference for granular urea in precision farming
- 4.7.5 Renewable-hydrogen-based green urea capacity additions
- 4.7.6 Port-side modular urea plants lowering logistics costs
- 4.8 Market Restraints
- 4.8.1 Natural gas price volatility raising production costs
- 4.8.2 Tightening runoff and greenhouse gas regulations on nitrogen use
- 4.8.3 Substitution threat from ammonium nitrate and UAN
- 4.8.4 Geopolitical trade-route disruptions
5 MARKET SIZE AND GROWTH FORECASTS (VALUE AND VOLUME)
- 5.1 Speciality Type
- 5.1.1 CRF
- 5.1.1.1 Polymer Coated
- 5.1.1.2 Polymer-Sulfur Coated
- 5.1.1.3 Others
- 5.1.2 Liquid Fertilizer
- 5.1.3 SRF
- 5.1.4 Water Soluble
- 5.1.1 CRF
- 5.2 Crop Type
- 5.2.1 Field Crops
- 5.2.2 Horticultural Crops
- 5.2.3 Turf & Ornamental
- 5.3 Form
- 5.3.1 Conventional
- 5.3.2 Speciality
- 5.4 Region
- 5.4.1 Asia-Pacific
- 5.4.1.1 Australia
- 5.4.1.2 Bangladesh
- 5.4.1.3 China
- 5.4.1.4 India
- 5.4.1.5 Indonesia
- 5.4.1.6 Japan
- 5.4.1.7 Pakistan
- 5.4.1.8 Philippines
- 5.4.1.9 Thailand
- 5.4.1.10 Vietnam
- 5.4.1.11 Rest of Asia-Pacific
- 5.4.2 Europe
- 5.4.2.1 France
- 5.4.2.2 Germany
- 5.4.2.3 Italy
- 5.4.2.4 Netherlands
- 5.4.2.5 Russia
- 5.4.2.6 Spain
- 5.4.2.7 Ukraine
- 5.4.2.8 United Kingdom
- 5.4.2.9 Rest of Europe
- 5.4.3 Middle East & Africa
- 5.4.3.1 Nigeria
- 5.4.3.2 Saudi Arabia
- 5.4.3.3 South Africa
- 5.4.3.4 Turkey
- 5.4.3.5 Rest of Middle East & Africa
- 5.4.4 North America
- 5.4.4.1 Canada
- 5.4.4.2 Mexico
- 5.4.4.3 United States
- 5.4.4.4 Rest of North America
- 5.4.5 South America
- 5.4.5.1 Argentina
- 5.4.5.2 Brazil
- 5.4.5.3 Rest of South America
- 5.4.1 Asia-Pacific
6 COMPETITIVE LANDSCAPE
- 6.1 Key Strategic Moves
- 6.2 Market Share Analysis
- 6.3 Company Landscape
- 6.4 Company Profiles (Includes Global Level Overview, Market Level Overview, Core Business Segments, Financials, Headcount, Key Information, Market Rank, Market Share, Products and Services, and Analysis of Recent Developments).
- 6.4.1 CF Industries Holdings, Inc.
- 6.4.2 Coromandel International Ltd.
- 6.4.3 EuroChem Group
- 6.4.4 Indian Farmers Fertiliser Cooperative Limited
- 6.4.5 Koch Industries Inc.
- 6.4.6 Nutrien Ltd.
- 6.4.7 OCI NV
- 6.4.8 SABIC Agri-Nutrients Co.
- 6.4.9 Yara International ASA
- 6.4.10 Qatar Fertiliser Company (QAFCO)
- 6.4.11 PT Pupuk Kalimantan Timur
- 6.4.12 Rashtriya Chemicals and Fertilizers Limited
- 6.4.13 Acron Group (Acron PJSC)
- 6.4.14 BASF SE
- 6.4.15 URALCHEM Holding P.L.C.
- 6.4.16 The Mosaic Company
7 KEY STRATEGIC QUESTIONS FOR FERTILIZER CEOS
 尿素市場:2026-2032年全球市場預測(依最終用途、形態、應用、等級、通路及生產流程分類)
 尿素市場分析及預測(至2035年):類型、產品、應用、最終用戶、形態、技術、製程、材料類型、安裝類型
 全球硫包覆尿素市場規模、佔有率、趨勢及成長分析報告(2026-2034)
 尿素市場規模、佔有率、趨勢及預測(依等級、應用、最終用途產業及地區分類),2026-2034年
 2026年全球尿素市場報告
 工業尿素:市場佔有率分析、產業趨勢與統計、成長預測(2026-2031)日本尿素市場報告(依等級、應用、最終用途產業及地區分類,2026-2034年)全球尿素市場:市場規模、佔有率、成長率、產業分析、按類型、應用和地區劃分的考量、未來預測(2026-2034)
 尿素市場規模、佔有率和成長分析(按等級、類型、應用和地區分類)-2026-2033年產業預測
 尿素市場按形態、等級、純度、分銷管道(間接和直接)和地區分類