


 |
市場調查報告書
商品編碼
1910473
工業尿素:市場佔有率分析、產業趨勢與統計、成長預測(2026-2031)Industrial Grade Urea - Market Share Analysis, Industry Trends & Statistics, Growth Forecasts (2026 - 2031) |
||||||
※ 本網頁內容可能與最新版本有所差異。詳細情況請與我們聯繫。
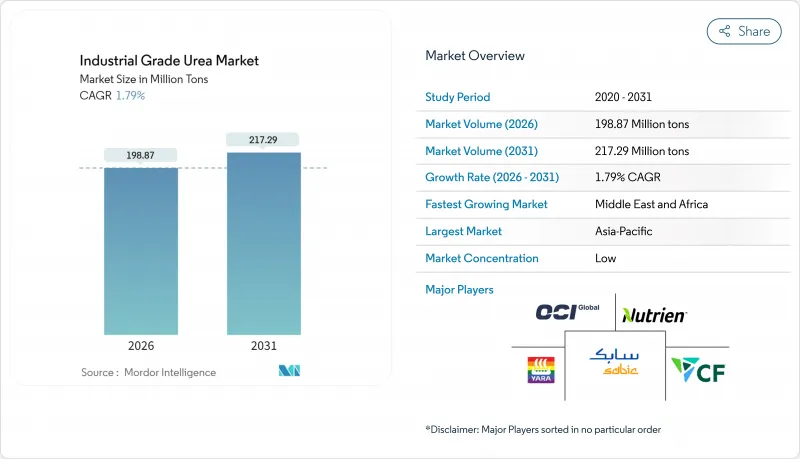
2025 年工業尿素市場價值為 1.9537 億噸,預計從 2026 年的 1.9887 億噸成長到 2031 年的 2.1729 億噸,在預測期(2026-2031 年)內複合年成長率為 1.79%。
市場溫和成長的趨勢反映出市場格局日趨成熟,成本主導生產經濟效益與日益成長的永續性期望之間已達到平衡。需求成長主要由農業部門推動,而柴油引擎廢氣處理液 (DEF) 和工程木樹脂的新增需求則使收入來源更加多元化。能源價格波動、主要生產商之間的整合以及更嚴格的排放目標主導著戰略討論,而旨在整合綠色氨的工藝創新有望確保企業的長期競爭力。
全球工業尿素市場趨勢與洞察
柴油引擎廢氣處理液(DEF)的日益普及正在改變對技術級DEF的需求。
商用車排放氣體法規正大力推動柴油引擎廢氣處理液(DEF)的普及,光是中國國六排放標準就預計到2025年DEF消費量將達到2,500萬噸。歐洲企業正將DEF生產線整合到現有的氨和尿素生產聯合裝置中,例如CF Industries的Blue Point計劃(該計畫將於2029年起每年額外生產140萬噸低碳氨)。這為應對化肥需求的季節性波動提供了防禦性保障,並支撐了DEF的溢價。北美車隊將遵守美國環保署(EPA)2027年的相關法規,將進一步支撐中期需求。同時,建築和採礦業的非道路設備也將擴大其潛在市場。整體而言,DEF的興起將促使部分工業尿素市場轉向高純度產品,從而間接提高利潤率並鼓勵對精煉基礎設施的投資。
綠色氨的整合重塑生產經濟格局
歐盟RED III指令要求在2030年可再生氫的佔比達到42%,這將加速低碳氨的普及應用,並透過電解槽成本和再生能源創造新的收入來源。 Stamikabon公司的NX Stami綠色氨模組在日產量50-500噸的規模下,可將資本支出(CAPEX)降低25-30%,有助於建立區域供應基地,縮短運輸距離並減少範圍3排放。中東的先導計畫旨在將太陽能電解與尿素合成相結合,這標誌著尿素生產模式正從單一地點的巨型工廠轉向其他模式。早期採用者可以在受碳排放監管的出口市場中獲得合規優勢,並與尋求低碳供應鏈的食品飲料公司簽訂銷售合約。長遠來看,這些進展可望降低工業尿素市場受天然氣價格飆升和碳排放成本衝擊的風險。
天然氣價格波動威脅生產獲利能力。
現貨天然氣價格從2022年的每百萬英熱單位6.54美元波動至2023年的每百萬英熱單位2.66美元,對原料成本佔現金成本70%至90%的生產商造成了影響。在2022年能源危機期間,歐洲工廠將運轉率限制在75%,並將貿易流向中東供應商。以頁岩氣為基礎的美國業者享有結構性成本優勢,而淨進口地區在價格飆升期間則面臨負利潤。避險策略、雙燃料能力以及對綠色氨的投資已成為新的應對措施,但這需要大量的資金和政策支持。
細分市場分析
2025年,肥料級尿素佔工業尿素市場的84.65%,預計到2031年將以1.83%的複合年成長率成長。技術級尿素的市佔率較小,但由於柴油引擎廢氣處理液(DEF)需求不斷成長,預計其成長速度將加快,在預測期內將成長130個基點。飼料級尿素滿足反芻動物的營養需求,並對純度有嚴格的要求。池式冷凝反應器等製程創新可將資本支出(CAPEX)降低高達30%,並實現產品組合多元化,從而快速適應利潤率的波動。
柔軟性至關重要,因為它使柴油引擎廢氣處理液 (DEF) 和三聚氰胺的需求與作物生長週期脫鉤,從而平抑收入的季節性波動。獲得汽車級尿素認證的生產商符合 ISO 22241 品質標準,並享有持續的溢價。另一方面,化肥生產商由於補貼和環境因素,仍受到應用限制。這種差異解釋了為什麼在整個預測期內,技術級尿素將成為工業尿素市場規模中成長最快的部分。
工業尿素市場報告按等級(肥料級、技術級、飼料級)、終端用戶行業(農業、化學、汽車、醫療及其他終端用戶行業)和地區(亞太地區、北美、歐洲、南美以及中東和非洲)進行細分。市場預測以噸為單位。
區域分析
亞太地區在工業尿素市場規模中佔據主導地位,預計到2025年將達到66.10%的市場佔有率,這主要得益於作物投入品的需求以及印度和中國對尿素水溶液(DEF)的日益普及。印度計劃在2025年實現尿素自給自足,預計隨著印度本地生產規模的擴大,其進口依賴度將降低。
中東和非洲地區將以2.33%的複合年成長率實現最快成長,直至2031年。這主要得益於沙烏地阿拉伯、埃及和阿爾及利亞低成本的天然氣原料以及面向出口的產能擴張。新建的氫氣生產綜合體正在整合綠色氫氣試點生產線,以確保未來的碳排放競爭力。由於天然氣價格上漲和脫碳政策的影響,歐洲的市場佔有率正在萎縮,迫使一些工廠實施季節性調整或減產,增加了對北非和美國進口氫氣的依賴。
北美地區需求穩定,這主要得益於豐富的頁岩氣資源以及重型車輛廣泛使用柴油廢氣處理劑(DEF)。貿易格局持續變化,政策限制導致中國2024年上半年出口下降90%,造成東南亞和拉丁美洲現貨供不應求。中東產油國迅速填補了這一缺口,鞏固了其作為搖擺供應商的地位。長期來看,亞太地區仍將維持主導地位,但隨著永續性和國內供應優先政策重塑對外貿易格局,其成長速度將會放緩。
其他福利:
- Excel格式的市場預測(ME)表
- 3個月的分析師支持
目錄
第1章 引言
- 研究假設和市場定義
- 調查範圍
第2章調查方法
第3章執行摘要
第4章 市場情勢
- 市場概覽
- 市場促進因素
- 技術級尿素具有很高的適用性
- 擴大柴油引擎廢氣處理液(DEF/AdBlue)在公路和非公路車輛的應用
- 亞洲新興國家化肥消費量不斷增加
- 工程木材用三聚氰胺和樹脂產量增加
- 向低碳氫化合物綠色氨基尿素過渡
- 市場限制
- 在地下水資源緊張的地區不加選擇地過度施肥。
- 天然氣價格波動對生產成本的影響
- 主要消費國收緊化肥補貼制度
- 價值鏈分析
- 監理政策分析
- 技術展望
- 生產過程
- 專利分析
- 波特五力模型
- 供應商的議價能力
- 買方的議價能力
- 新進入者的威脅
- 替代品的威脅
- 競爭程度
- 原料分析
- 進出口趨勢
第5章 市場規模與成長預測
- 按年級
- 肥料等級
- 技術級
- 飼料級
- 按最終用戶行業分類
- 農業
- 化學
- 車
- 醫療保健
- 其他終端用戶產業
- 按地區
- 亞太地區
- 中國
- 印度
- 日本
- 韓國
- ASEAN
- 亞太其他地區
- 北美洲
- 美國
- 加拿大
- 墨西哥
- 歐洲
- 德國
- 法國
- 英國
- 義大利
- 俄羅斯
- 其他歐洲地區
- 南美洲
- 巴西
- 阿根廷
- 其他南美洲
- 中東和非洲
- 沙烏地阿拉伯
- 南非
- 其他中東和非洲地區
- 亞太地區
第6章 競爭情勢
- 市場集中度
- 策略趨勢
- 市佔率(%)/排名分析
- 公司簡介
- Acron
- BASF
- CF Industries Holdings Inc.
- Chambal Fertilisers & Chemicals Ltd
- China National Petroleum Corporation(CNPC)
- EuroChem Group
- Genesis Fertilizers
- IFFCO
- Industries Qatar
- Koch Fertilizer LLC
- National Fertilizers Limited
- Notore Chemical Industries PLC
- Nutrien Ltd
- OCI
- Paradeep Phosphates Ltd
- Petrobras
- PT Pupuk Kalimantan Timur(PKT)
- SABIC
- The Chemical Company(TCC)
- Uralchem JSC
- Yara
第7章 市場機會與未來展望
The Industrial Grade Urea Market was valued at 195.37 Million tons in 2025 and estimated to grow from 198.87 Million tons in 2026 to reach 217.29 Million tons by 2031, at a CAGR of 1.79% during the forecast period (2026-2031).
The market's modest trajectory reflects a mature landscape balancing cost-driven production economics with rising sustainability expectations. Demand growth flows mainly from agriculture, yet a new pull from diesel exhaust fluid (DEF) and engineered-wood resins diversifies the revenue base. Energy-price volatility, consolidation among large producers, and stricter emissions targets dominate strategic conversations, while process innovations aimed at green ammonia integration promise longer-term competitiveness.
Global Industrial Grade Urea Market Trends and Insights
Rising Diesel Exhaust Fluid Adoption Transforms Technical Grade Demand
Commercial vehicle emission standards underpin a robust uptake of DEF, with China's National VI regulations alone expected to lift DEF consumption to 25 million tons in 2025. European players are integrating DEF lines into existing ammonia-urea complexes, illustrated by CF Industries' Blue Point project that will add 1.4 million tpy low-carbon ammonia from 2029. This defensively hedges against seasonal fertilizer swings and supports premium pricing. North American fleets following EPA 2027 rules further reinforce a medium-term demand floor, while off-road machinery in construction and mining extends the addressable market. Overall, DEF's rise shifts a portion of the industrial-grade urea market toward higher-purity products, indirectly raising margins and encouraging investments in purification infrastructure.
Green Ammonia Integration Reshapes Production Economics
The European Union's RED III requirement for 42% renewable hydrogen by 2030 accelerates low-carbon ammonia adoption, turning electrolyzer costs and renewable power availability into new profit levers. Stamicarbon's NX Stami Green Ammonia modules slash CAPEX 25-30% at 50-500 t per day scale, enabling regional supply hubs that shorten freight routes and curb scope 3 emissions. Pilot projects in the Middle East aim to couple solar-powered electrolysis with urea synthesis, signaling a shift away from single-site mega-plants. Early adopters gain compliance advantages in carbon-regulated export markets and secure offtake agreements from food and beverage firms seeking lower-footprint supply chains. Over the long term, these developments could moderate the industrial-grade urea market's exposure to natural-gas price spikes and carbon costs.
Natural Gas Price Volatility Threatens Production Viability
Spot gas swung from USD 6.54/MMBtu in 2022 to USD 2.66/MMBtu in 2023, exposing producers whose feedstock can constitute 70-90% of cash costs. European plants curtailed utilization to 75% amid the 2022 energy crisis, redirecting trade flows toward Middle Eastern suppliers. U.S. operators with shale-based gas benefit from structural cost advantages, whereas net-importing areas confront negative margins during price spikes. Hedging strategies, dual-fuel capabilities, and green ammonia investments are emerging defenses but require substantial capital and policy support.
Other drivers and restraints analyzed in the detailed report include:
- Technical Grade Applications Drive Premium Segment Growth
- Emerging Asia Fertilizer Demand Sustains Long-term Growth
- Environmental Regulations Constrain Application Growth
For complete list of drivers and restraints, kindly check the Table Of Contents.
Segment Analysis
Fertilizer grade accounted for 84.65% of the industrial grade urea market in 2025 and is forecast to expand at a 1.83% CAGR to 2031. The technical grade slice, while smaller, accelerates on DEF demand, potentially lifting its share by 130 basis points within the outlook period. Feed grade addresses ruminant nutrition niches with stringent purity needs. Process innovations such as pool-condenser reactors lower CAPEX by up to 30%, enabling multiproduct configurations that respond swiftly to shifting margins.
Flexibility matters because DEF and melamine demand decouple from crop cycles, smoothing revenue seasonality. Producers certified for automotive-grade urea meet ISO 22241 quality thresholds, commanding sustained premiums. In contrast, fertilizer producers remain exposed to subsidy regimes and environmentally driven application caps. This divergence underlines why technical grade is the fastest growing component of the industrial grade urea market size across the forecast.
The Industrial Grade Urea Market Report is Segmented by Grade (Fertilizer Grade, Technical Grade, and Feed Grade), End-User Industry (Agriculture, Chemical, Automotive, Medical, and Other End-User Industries), and Geography (Asia-Pacific, North America, Europe, South America, and Middle-East and Africa). The Market Forecasts are Provided in Terms of Volume (Tons)
Geography Analysis
Asia-Pacific dominated the industrial-grade urea market size with a 66.10% share in 2025, driven by India's and China's crop inputs and rising DEF uptake. Local production expansion in India aims for self-sufficiency by 2025, potentially trimming import reliance.
The Middle East and Africa region posts the fastest 2.33% CAGR through 2031, fueled by low-cost gas feedstock and export-oriented capacity additions in Saudi Arabia, Egypt, and Algeria. New complexes integrate green-hydrogen pilot lines to future-proof carbon competitiveness. Europe's share contracts amid high gas costs and decarbonization policies; several plants operate seasonally or under curtailment, increasing import reliance on North Africa and the United States.
North America maintains steady demand, benefiting from abundant shale gas and ongoing DEF adoption in heavy-duty fleets. Trade patterns continue shifting: China's H1 2024 export volumes fell 90% following policy restrictions, creating spot shortages in Southeast Asia and Latin America. Middle Eastern producers quickly captured these gaps, affirming their swing-supplier status. Over the long term, Asia-Pacific retains leadership, yet its growth moderates as sustainability policies and domestic supply priorities reshape external trade.
- Acron
- BASF
- CF Industries Holdings Inc.
- Chambal Fertilisers & Chemicals Ltd
- China National Petroleum Corporation (CNPC)
- EuroChem Group
- Genesis Fertilizers
- IFFCO
- Industries Qatar
- Koch Fertilizer LLC
- National Fertilizers Limited
- Notore Chemical Industries PLC
- Nutrien Ltd
- OCI
- Paradeep Phosphates Ltd
- Petrobras
- PT Pupuk Kalimantan Timur (PKT)
- SABIC
- The Chemical Company (TCC)
- Uralchem JSC
- Yara
Additional Benefits:
- The market estimate (ME) sheet in Excel format
- 3 months of analyst support
TABLE OF CONTENTS
1 Introduction
- 1.1 Study Assumptions and Market Definition
- 1.2 Scope of the Study
2 Research Methodology
3 Executive Summary
4 Market Landscape
- 4.1 Market Overview
- 4.2 Market Drivers
- 4.2.1 High applicability of technical-grade urea
- 4.2.2 Rising diesel exhaust fluid (DEF/AdBlue) adoption in on-road and off-road vehicles
- 4.2.3 Expanding fertilizer consumption in emerging Asia
- 4.2.4 Increased melamine and resin production for engineered wood
- 4.2.5 Shift toward green ammonia-based urea via low-carbon hydrogen
- 4.3 Market Restraints
- 4.3.1 Indiscriminate over-application in groundwater-stressed regions
- 4.3.2 Volatile natural-gas pricing impacting production cost
- 4.3.3 Stricter fertilizer subsidy reforms in major consuming countries
- 4.4 Value Chain Analysis
- 4.5 Regulatory Policy Analysis
- 4.6 Technological Outlook
- 4.6.1 Production Process
- 4.6.2 Patent Analysis
- 4.7 Porter's Five Forces
- 4.7.1 Bargaining Power of Suppliers
- 4.7.2 Bargaining Power of Buyers
- 4.7.3 Threat of New Entrants
- 4.7.4 Threat of Substitutes
- 4.7.5 Degree of Competition
- 4.8 Feedstock Analysis
- 4.9 Import-Export Trends
5 Market Size and Growth Forecasts (Volume)
- 5.1 By Grade
- 5.1.1 Fertilizer Grade
- 5.1.2 Technical Grade
- 5.1.3 Feed Grade
- 5.2 By End-user Industry
- 5.2.1 Agriculture
- 5.2.2 Chemical
- 5.2.3 Automotive
- 5.2.4 Medical
- 5.2.5 Other End-user Industries
- 5.3 By Geography
- 5.3.1 Asia-Pacific
- 5.3.1.1 China
- 5.3.1.2 India
- 5.3.1.3 Japan
- 5.3.1.4 South Korea
- 5.3.1.5 ASEAN
- 5.3.1.6 Rest of Asia-Pacific
- 5.3.2 North America
- 5.3.2.1 United States
- 5.3.2.2 Canada
- 5.3.2.3 Mexico
- 5.3.3 Europe
- 5.3.3.1 Germany
- 5.3.3.2 France
- 5.3.3.3 United Kingdom
- 5.3.3.4 Italy
- 5.3.3.5 Russia
- 5.3.3.6 Rest of Europe
- 5.3.4 South America
- 5.3.4.1 Brazil
- 5.3.4.2 Argentina
- 5.3.4.3 Rest of South America
- 5.3.5 Middle-East and Africa
- 5.3.5.1 Saudi Arabia
- 5.3.5.2 South Africa
- 5.3.5.3 Rest of Middle-East and Africa
- 5.3.1 Asia-Pacific
6 Competitive Landscape
- 6.1 Market Concentration
- 6.2 Strategic Moves
- 6.3 Market Share (%)/Ranking Analysis
- 6.4 Company Profiles (includes Global level Overview, Market level overview, Core Segments, Financials as available, Strategic Information, Market Rank/Share for key companies, Products and Services, and Recent Developments)
- 6.4.1 Acron
- 6.4.2 BASF
- 6.4.3 CF Industries Holdings Inc.
- 6.4.4 Chambal Fertilisers & Chemicals Ltd
- 6.4.5 China National Petroleum Corporation (CNPC)
- 6.4.6 EuroChem Group
- 6.4.7 Genesis Fertilizers
- 6.4.8 IFFCO
- 6.4.9 Industries Qatar
- 6.4.10 Koch Fertilizer LLC
- 6.4.11 National Fertilizers Limited
- 6.4.12 Notore Chemical Industries PLC
- 6.4.13 Nutrien Ltd
- 6.4.14 OCI
- 6.4.15 Paradeep Phosphates Ltd
- 6.4.16 Petrobras
- 6.4.17 PT Pupuk Kalimantan Timur (PKT)
- 6.4.18 SABIC
- 6.4.19 The Chemical Company (TCC)
- 6.4.20 Uralchem JSC
- 6.4.21 Yara
7 Market Opportunities and Future Outlook
- 7.1 White-space and Unmet-Need Assessment
 尿素市場:2026-2032年全球市場預測(依最終用途、形態、應用、等級、通路及生產流程分類)
 尿素市場分析及預測(至2035年):類型、產品、應用、最終用戶、形態、技術、製程、材料類型、安裝類型
 全球硫包覆尿素市場規模、佔有率、趨勢及成長分析報告(2026-2034)
 尿素市場規模、佔有率、趨勢及預測(依等級、應用、最終用途產業及地區分類),2026-2034年
 2026年全球尿素市場報告
 尿素:市佔率分析、產業趨勢與統計、成長預測(2026-2031)日本尿素市場報告(依等級、應用、最終用途產業及地區分類,2026-2034年)全球尿素市場:市場規模、佔有率、成長率、產業分析、按類型、應用和地區劃分的考量、未來預測(2026-2034)
 尿素市場規模、佔有率和成長分析(按等級、類型、應用和地區分類)-2026-2033年產業預測
 尿素市場按形態、等級、純度、分銷管道(間接和直接)和地區分類