


 |
市場調查報告書
商品編碼
1911491
廢棄物管理設備:市場佔有率分析、產業趨勢與統計資料、成長預測(2026-2031 年)Waste Management Equipment - Market Share Analysis, Industry Trends & Statistics, Growth Forecasts (2026 - 2031) |
||||||
※ 本網頁內容可能與最新版本有所差異。詳細情況請與我們聯繫。
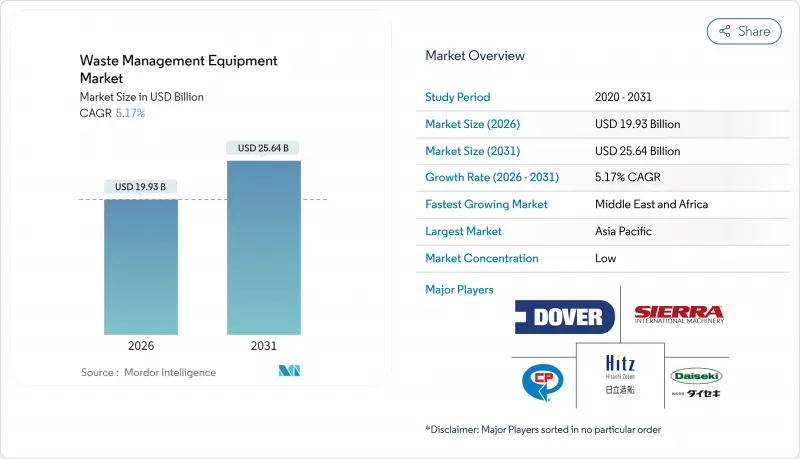
2025年,廢棄物管理設備市場價值為189.5億美元,預計從2026年的199.3億美元成長到2031年的256.4億美元,在預測期(2026-2031年)內,複合年成長率為5.17%。
都市廢棄物(MSW)量的不斷成長、更嚴格的掩埋轉移政策以及對回收基礎設施日益成長的投資,都在推動對設備的需求。亞洲和非洲的快速都市化持續對收集和處理能力造成壓力,但電子自動化升級仍然是降低成本和滿足監管要求的最快路徑。商品價格波動和網路安全風險制約著盈利,而設備即服務(EaaS)和綠色採購指令則為全球廢棄物管理設備市場的供應商開闢了新的收入來源。
全球廢棄物管理設備市場趨勢與洞察
快速的都市化和城市廢棄物的快速增加
隨著大都會圈人口的成長,廢棄物產生量的成長速度超過了人口成長速度,迫使市政當局升級垃圾收集車輛、轉運站和資源回收設施。世界銀行預測,到2050年,全球城市廢棄物產生量將增加70%,將加劇撒哈拉以南非洲和南亞地區的基礎設施缺口。實施一體化的收集、分類和處理系統可以將未妥善處理的廢棄物的社會成本從每噸375美元降低到50-100美元。日本北九州市等城市的例子表明,結合公民參與和即時監測可以使經濟成長與廢棄物產生脫鉤。因此,越來越多的都市區正在為智慧垃圾桶、光學分類機和電動垃圾車分配預算,從而推動全球廢棄物管理設備市場的穩定成長。
嚴格的掩埋規避規定
加州SB 1383法案的目標是到2025年實現75%的有機廢棄物回收率,而美國環保署(EPA)則要求容量超過250萬噸的掩埋安裝氣體回收系統。這促使鼓風機、火炬塔和監測設備進行升級改造。像沙加緬度這樣的城市,透過安裝高容量堆肥設備,有機廢棄物分流率已經提高了14%。聖地牙哥和金縣的建築和拆除條例設定了65%的回收率目標,促使建築商轉向使用專用破碎機和分類機。這些法規建立了可預測的升級週期,並鼓勵設備購買者優先選擇具有成熟分流性能的平台,尤其是自動化分類線。自動化分類線如今已成為全球廢棄物管理設備產業的核心合規策略。
先進設備的前期投資成本高
全自動分類線的成本比人工系統高出200%至300%,對小規模的城市來說是一個障礙。車隊電氣化也會帶來類似的成本影響:加州一個地方管理區估計,為一支96輛車的車隊進行電氣化改造,卡車需要570萬美元,充電樁需要77萬美元。雖然補貼、稅額扣抵和公共產業回扣減輕了負擔,但許多買家仍然推遲現代化。目前,EaaS(能源即服務)合約可以抵消部分資本投資成本,但並不能消除預算限制,在資金籌措標準成熟之前,這將減緩全球廢棄物管理設備市場短期內的滲透速度。
細分市場分析
到2025年,回收和分類機械將佔全球廢棄物管理設備市場的68.21%,這標誌著廢棄物處理方式正從廢棄物處置轉向資源回收。光學分類機、彈道分離器和人工智慧視覺機器人正在取代人工分類線,有助於實現廢棄物轉移目標並減少污染罰款。歐盟和美國部分州的法規強制規定了最低再生材料含量,推動了對高純度處理設備的需求。供應商強調模組化設計,突顯了無需投入大規模土木工程成本即可添加容器、塑膠和纖維生產線的能力。此外,企業淨零排放承諾也推動了對消費後再生材料需求的成長,進而促進了這一領域的發展。
廢棄物焚化發電設備的銷售目前仍處於滯後水平,但預計到2031年,其複合年成長率將達到7.05%,成為成長最快的領域,這主要得益於廢棄物焚化發電和碳捕獲技術的進步。巴布科克-威爾科克斯公司為亞伯達首個捕碳封存(CCS)工廠設計的前端設備,展現了焚化爐未來也能發揮排放的願景。掩埋氣系統、生物乾燥機和厭氧消化器等設備,構成了一套多元化的處理工具,它們與回收相輔相成,而非相互競爭。隨著有機廢棄物分類的日益普及,食品廢棄物包機和堆肥桶等設備正在拓展產品線,並在全球廢棄物管理設備市場中創造更多交叉銷售機會。
到2025年,非危險廢棄物將佔全球廢棄物管理設備市場規模的90.08%,這反映了城市廢棄物(MSW)和商業廢棄物的大量產生。標準化的垃圾車、後裝式垃圾車和轉運站實現了規模經濟,共用進行批量訂購和共享零件庫存。然而,美國環保署(EPA)即將實施的電子清單追蹤規則將加速危險廢棄物處理設備的成長率,使其複合年成長率達到6.41%,從而推動對密封式滾裝貨櫃、真空貨櫃和能夠收集監管數據的條碼閱讀器的需求。
專業化使危險廢棄物設備製造商能夠整合洩漏檢測感測器和遠端監控功能,並滿足更嚴格的安全標準,從而獲得更高的利潤率。例如,哥本哈根原子公司 (Copenhagen Atomics) 與 DeepGeo 的合作,凸顯了尖端放射性物質處理解決方案的領先地位;與此同時,非危險廢物處理系統也正在通過人工智慧維修,用於混合塑膠流和濕有機物處理,從而提高處理量和材料質量。在雙管齊下的成長策略驅動下,全面的產品系列仍是供應商在全球廢棄物管理設備市場保持競爭力的核心。
區域分析
到2025年,亞太地區將佔據全球廢棄物管理設備市場44.12%的佔有率,這主要得益於中國和印度龐大的城市人口(總合15億)。各國五年規劃都將擴大固態廢棄物處理能力列為優先事項,從而推動了對光學分類機和廢棄物衍生燃料(RDF)生產線的訂單。韓國的人工智慧機器人出口展現了其在區域自動化領域的領先地位,而日本的公民參與模式則體現了徹底分類的益處。供應鏈的接近性也對供應商有利,預計到2050年,中國將佔全球廢鋼供應量的約45%,這將為該地區的循環經濟計劃提供支援。
北美地區仍然是一個強勁的替換市場,這主要得益於排放法規和有機廢物禁令。加州的《有機廢棄物轉移法案》和加拿大首個配備碳捕獲與封存(CCS)技術的垃圾焚化發電發電廠正在推動對消化器、輸送機和氣體淨化設備的需求。聯邦政府對純電動垃圾車的補貼正在加速車隊更新換代,以符合企業的碳減排目標。歐洲的情況也類似。生產者延伸責任制(EPR)提高了再生材料的純度標準,要求對設備進行人工智慧視覺改造並配備高速彈道分離器。
到2031年,中東和非洲將以6.48%的複合年成長率成為成長最快的地區,波灣合作理事會(GCC)成員國正在廢棄物基礎設施進行現代化改造,以實現其「2030願景」的目標。新建的垃圾處理廠通常採用現代化設計,直接採用自動化生產線,而非逐步升級。沙烏地阿拉伯和阿拉伯聯合大公國的公私合營特許經營模式穩定了收入來源,並降低了跨國公司的投資風險。撒哈拉以南非洲的城市正在採用模組化傳輸和移動式打包機來克服資金限制,這為全球廢棄物管理設備市場的供應商拓展了機會。
其他福利:
- Excel格式的市場預測(ME)表
- 3個月的分析師支持
目錄
第1章 引言
- 研究假設和市場定義
- 調查範圍
第2章調查方法
第3章執行摘要
第4章 市場情勢
- 市場概覽
- 市場促進因素
- 快速的都市化和城市垃圾的快速增加
- 關於掩埋改道的嚴格規定
- 在循環經濟中回收投資
- 配備人工智慧的自主分類機器人
- 智慧卡車綠色政府採購義務
- 基於設備服務的融資模式
- 市場限制
- 先進設備的高初始資本投資成本
- 二級產品價格波動
- 智慧廢棄物平台的網路安全風險
- 熟練維修技師短缺
- 價值/供應鏈分析
- 監管環境
- 技術展望
- 產業吸引力-波特五力分析
- 新進入者的威脅
- 供應商的議價能力
- 買方的議價能力
- 替代品的威脅
- 競爭對手之間的競爭
第5章 市場規模及成長預測(價值,單位:十億美元)
- 依產品類型
- 廢棄物處理設施
- 廢棄物回收及分類設備
- 依廢物類型
- 危險品
- 無害材料
- 透過使用
- 住宅和工業廢棄物
- 工業廢棄物(危險廢棄物和非危險廢棄物)
- 建築和拆除廢棄物
- 醫療廢棄物
- 其他(農業廢棄物、採礦和採掘廢棄物等)
- 透過技術
- 手動的
- 半自動
- 全自動(相容於智慧物聯網/人工智慧等)
- 按地區
- 北美洲
- 美國
- 加拿大
- 墨西哥
- 南美洲
- 巴西
- 阿根廷
- 秘魯
- 南美洲其他地區
- 歐洲
- 英國
- 德國
- 法國
- 義大利
- 西班牙
- 比荷盧經濟聯盟(比利時、荷蘭、盧森堡)
- 北歐國家(丹麥、芬蘭、冰島、挪威、瑞典)
- 其他歐洲地區
- 亞太地區
- 中國
- 印度
- 日本
- 澳洲
- 韓國
- 東協(印尼、泰國、菲律賓、馬來西亞、越南)
- 亞太其他地區
- 中東和非洲
- 沙烏地阿拉伯
- 阿拉伯聯合大公國
- 卡達
- 科威特
- 土耳其
- 埃及
- 南非
- 奈及利亞
- 其他中東和非洲地區
- 北美洲
第6章 競爭情勢
- 市場集中度
- 策略趨勢
- 市佔率分析
- 公司簡介
- Wastequip LLC
- Dover Corp.(Environmental Solutions Group)
- TOMRA Systems ASA
- CP Manufacturing Inc.
- Bollegraaf Recycling Solutions
- Recycling Equipment Manufacturing Inc.
- Sierra International Machinery LLC
- Daiseki Co. Ltd.
- Hitachi Zosen Corp.
- Morita Holding Corp.
- Veolia Environnement SA
- SUEZ SA
- Waste Management Inc.
- Republic Services Inc.
- Stericycle Inc.
- Babcock & Wilcox Enterprises
- Alfa Laval AB
- ANDRITZ AG
- Terex Corporation
- EcoGreen Equipment
- TANA Oy
第7章 市場機會與未來展望
The Waste Management Equipment market was valued at USD 18.95 billion in 2025 and estimated to grow from USD 19.93 billion in 2026 to reach USD 25.64 billion by 2031, at a CAGR of 5.17% during the forecast period (2026-2031).
Growing municipal solid-waste (MSW) volumes, stricter landfill-diversion policies, and rising investment in recycling infrastructure are accelerating equipment demand. Rapid urbanization in Asia and Africa keeps collection and processing capacity under pressure, while electronics-enabled automation upgrades remain the quickest path to cost reduction and compliance. Commodity price volatility and cybersecurity risks temper profitability, but equipment-as-a-service and green-procurement mandates open fresh revenue streams for vendors across the Global Waste Management Equipment market.
Global Waste Management Equipment Market Trends and Insights
Rapid Urbanization & MSW Surge
Expanding metropolitan populations generate waste volumes that grow faster than headcounts, pushing municipalities to upgrade fleets, transfer stations, and material-recovery facilities. The World Bank projects global MSW generation to rise 70% by 2050, widening infrastructure gaps in Sub-Saharan Africa and South Asia. Integrated systems cut the USD 375 per-ton societal cost of unmanaged waste to USD 50-100 per ton when collection, sorting, and processing are combined. Japanese examples such as Kitakyushu show that citizen engagement paired with real-time monitoring can decouple economic growth from waste output. As a result, urban areas allocate bigger budgets to smart bins, optical sorters, and electric refuse trucks, keeping the Global Waste Management Equipment market on a steady capacity-addition path.
Stringent Landfill-Diversion Regulations
California's SB 1383 targets a 75% organic-waste recycling rate by 2025, while the U.S. EPA mandates gas-collection systems for landfills larger than 2.5 million Mg, prompting upgrades in blowers, flare stacks, and monitoring gear. Municipalities such as Sacramento have already lifted organic diversion by 14% after installing high-volume composters. Construction and demolition ordinances in San Diego and King County set 65% recovery thresholds, steering builders toward specialized crushers and screeners. These rules establish predictable replacement cycles, forcing equipment buyers to favor platforms that prove diversion metrics, especially automated sorting lines, now central to compliance strategies across the Global Waste Management Equipment industry.
High Upfront CAPEX of Advanced Equipment
Fully automated sorting lines can cost 200-300% more than manual systems, presenting prohibitive hurdles for smaller cities. Fleet electrification offers similar sticker shock: one California regional district calculated USD 5.7 million for trucks and USD 0.77 million for chargers to electrify 96 vehicles. Grants, tax credits, and utility rebates soften the blow, yet many buyers still delay modernization. EaaS contracts now offset CAPEX, but they do not erase budget limits, slowing near-term Global Waste Management Equipment market penetration until financing norms mature.
Other drivers and restraints analyzed in the detailed report include:
- Circular-Economy Recycling Investments
- AI-Powered Autonomous Sorting Robots
- Volatile Secondary-Commodity Prices
For complete list of drivers and restraints, kindly check the Table Of Contents.
Segment Analysis
Recycling and sorting machinery captured 68.21% Global Waste Management Equipment market share in 2025, signifying a structural pivot from disposal toward resource recovery. Optical sorters, ballistic separators, and AI-vision robots increasingly replace manual lines to meet diversion targets and lower contamination penalties. Regulations in the EU and select U.S. states impose minimum recycled-content mandates, creating a pull-through effect for high-purity processing gear. Vendors highlight modularity, allowing facilities to add containers, plastics, or fiber lines without large civil works costs. The segment also benefits from corporate net-zero pledges that raise demand for post-consumer recyclate.
Waste disposal equipment trails in volume but is expected to post the fastest 7.05% CAGR to 2031, driven by waste-to-energy and carbon-capture upgrades. Babcock & Wilcox's front-end design for Alberta's first CCS-equipped plant illustrates a future where incinerators double as emissions-mitigation assets. Landfill-gas systems, bio-dryers, and anaerobic digesters complete a diversified disposal toolkit, complementing recycling rather than competing with it. As organic diversion tightens, food-waste depackagers and composting drums expand their product breadth, amplifying cross-sell opportunities throughout the Global Waste Management Equipment market.
Non-hazardous flows constituted 90.08% of the Global Waste Management Equipment market size in 2025, reflecting ubiquitous MSW and commercial waste volumes. Standardized carts, rear-loaders, and transfer stations achieve economies of scale, allowing bulk orders and shared parts inventories. However, the EPA's forthcoming e-Manifest electronic tracking rule boosts hazardous-waste equipment growth to a 6.41% CAGR, spurring demand for sealed roll-offs, negative-pressure containers, and bar-code readers capable of compliant data capture.
Specialization yields a higher margin for hazardous-waste equipment makers, who integrate leak-detection sensors and remote monitoring to meet stricter safety codes. Partnerships such as Copenhagen Atomics and DeepGeo spotlight cutting-edge radioactive-material handling solutions. Meanwhile, non-hazardous systems welcome AI-retrofits for mixed-plastic streams and wet organics, improving throughput and material quality. Dual-track growth ensures comprehensive product portfolios remain central to vendor competitiveness across the Global Waste Management Equipment market.
The Waste Management Equipment Market Report is Segmented by Source (Residential, Commercial, Industrial, and More), by Service Type (Collection, Transportation, Sorting & Segregation, and More), by Waste Type (Municipal Solid, Industrial Hazardous Waste, E-Waste, and More), and by Geography (North America, South America, Europe, Asia-Pacific and Middle East and Africa). The Market Forecasts are Provided in Terms of Value (USD).
Geography Analysis
Asia-Pacific held 44.12% of the Global Waste Management Equipment market in 2025, anchored by China's and India's urban populations that eclipse 1.5 billion residents combined. National five-year plans prioritize solid-waste capacity, prompting orders for optical sorters and refuse-derived-fuel lines. South Korea's AI-robot exports illustrate regional leadership in automation, while Japan's citizen-engagement model shows the gains possible from meticulous source separation. Supply-chain proximity also benefits equipment vendors, as China is forecast to provide almost 45% of the world's scrap steel by 2050, supporting regional circular-economy projects.
North America remains a steady replacement market where emission caps and organics bans stimulate upgrades. California's organic-diversion law and Canada's first CCS-enabled waste-to-energy plant foster demand for digesters, conveyors, and gas-cleanup skids. Federal grants financing battery-electric refuse fleets accelerate fleet turnover, aligning with corporate carbon pledges. Europe follows similar patterns: extended-producer-responsibility schemes push recyclate purity thresholds, requiring AI-vision retrofits and high-speed ballistic separators.
The Middle East & Africa posts the fastest 6.48% CAGR to 2031 as Gulf Cooperation Council states modernize waste infrastructure to meet Vision 2030 agendas. New plants often leapfrog to the latest designs, opting straight for automated lines rather than incremental upgrades. Public-private concession models in Saudi Arabia and the UAE stabilize revenue streams, lowering investment risk for multinationals. Sub-Saharan cities adopt modular transfer stations and mobile balers to overcome capital constraints, broadening vendor opportunities across the Global Waste Management Equipment market.
- Wastequip LLC
- Dover Corp. (Environmental Solutions Group)
- TOMRA Systems ASA
- CP Manufacturing Inc.
- Bollegraaf Recycling Solutions
- Recycling Equipment Manufacturing Inc.
- Sierra International Machinery LLC
- Daiseki Co. Ltd.
- Hitachi Zosen Corp.
- Morita Holding Corp.
- Veolia Environnement SA
- SUEZ SA
- Waste Management Inc.
- Republic Services Inc.
- Stericycle Inc.
- Babcock & Wilcox Enterprises
- Alfa Laval AB
- ANDRITZ AG
- Terex Corporation
- EcoGreen Equipment
- TANA Oy
Additional Benefits:
- The market estimate (ME) sheet in Excel format
- 3 months of analyst support
TABLE OF CONTENTS
1 Introduction
- 1.1 Study Assumptions & Market Definition
- 1.2 Scope of the Study
2 Research Methodology
3 Executive Summary
4 Market Landscape
- 4.1 Market Overview
- 4.2 Market Drivers
- 4.2.1 Rapid urbanisation & MSW surge
- 4.2.2 Stringent landfill-diversion regulations
- 4.2.3 Circular-economy recycling investments
- 4.2.4 AI-powered autonomous sorting robots
- 4.2.5 Green public-procurement mandates for smart trucks
- 4.2.6 Equipment-as-a-Service financing models
- 4.3 Market Restraints
- 4.3.1 High upfront CAPEX of advanced equipment
- 4.3.2 Volatile secondary-commodity prices
- 4.3.3 Cyber-security risks in smart waste platforms
- 4.3.4 Shortage of skilled service technicians
- 4.4 Value / Supply-Chain Analysis
- 4.5 Regulatory Landscape
- 4.6 Technological Outlook
- 4.7 Industry Attractiveness - Porter's Five Force Analysis
- 4.7.1 Threat of New Entrants
- 4.7.2 Bargaining Power of Suppliers
- 4.7.3 Bargaining Power of Buyers
- 4.7.4 Threat of Substitutes
- 4.7.5 Intensity of Competitive Rivalry
5 Market Size & Growth Forecasts (Values, In USD Billion)
- 5.1 By Product Type
- 5.1.1 Waste Disposal Equipment
- 5.1.2 Waste Recycling & Sorting Equipment
- 5.2 By Waste Type
- 5.2.1 Hazardous
- 5.2.2 Non-Hazardous
- 5.3 By Application
- 5.3.1 Residential & Commercial Waste
- 5.3.2 Industrial Waste (Hazardous & Non-Hazardous)
- 5.3.3 Construction & Demolition Waste
- 5.3.4 Healthcare Waste
- 5.3.5 Others(Agriculture Waste, Mining & Extraction Waste, etc.)
- 5.4 By Technology
- 5.4.1 Manual
- 5.4.2 Semi-Automated
- 5.4.3 Fully Automated(Smart IoT / AI-Enabled, etc.)
- 5.5 By Geography
- 5.5.1 North America
- 5.5.1.1 United States
- 5.5.1.2 Canada
- 5.5.1.3 Mexico
- 5.5.2 South America
- 5.5.2.1 Brazil
- 5.5.2.2 Argentina
- 5.5.2.3 Peru
- 5.5.2.4 Rest of South America
- 5.5.3 Europe
- 5.5.3.1 United Kingdom
- 5.5.3.2 Germany
- 5.5.3.3 France
- 5.5.3.4 Italy
- 5.5.3.5 Spain
- 5.5.3.6 BENELUX (Belgium, Netherlands, and Luxembourg)
- 5.5.3.7 NORDICS (Denmark, Finland, Iceland, Norway, and Sweden)
- 5.5.3.8 Rest of Europe
- 5.5.4 Asia-Pacific
- 5.5.4.1 China
- 5.5.4.2 India
- 5.5.4.3 Japan
- 5.5.4.4 Australia
- 5.5.4.5 South Korea
- 5.5.4.6 ASEAN (Indonesia, Thailand, Philippines, Malaysia, Vietnam)
- 5.5.4.7 Rest of Asia-Pacific
- 5.5.5 Middle East and Africa
- 5.5.5.1 Saudi Arabia
- 5.5.5.2 United Arab Emirates
- 5.5.5.3 Qatar
- 5.5.5.4 Kuwait
- 5.5.5.5 Turkey
- 5.5.5.6 Egypt
- 5.5.5.7 South Africa
- 5.5.5.8 Nigeria
- 5.5.5.9 Rest of Middle East and Africa
- 5.5.1 North America
6 Competitive Landscape
- 6.1 Market Concentration
- 6.2 Strategic Moves
- 6.3 Market Share Analysis
- 6.4 Company Profiles (includes Global level Overview, Market level overview, Core Segments, Financials as available, Strategic Information, Products & Services, and Recent Developments)
- 6.4.1 Wastequip LLC
- 6.4.2 Dover Corp. (Environmental Solutions Group)
- 6.4.3 TOMRA Systems ASA
- 6.4.4 CP Manufacturing Inc.
- 6.4.5 Bollegraaf Recycling Solutions
- 6.4.6 Recycling Equipment Manufacturing Inc.
- 6.4.7 Sierra International Machinery LLC
- 6.4.8 Daiseki Co. Ltd.
- 6.4.9 Hitachi Zosen Corp.
- 6.4.10 Morita Holding Corp.
- 6.4.11 Veolia Environnement SA
- 6.4.12 SUEZ SA
- 6.4.13 Waste Management Inc.
- 6.4.14 Republic Services Inc.
- 6.4.15 Stericycle Inc.
- 6.4.16 Babcock & Wilcox Enterprises
- 6.4.17 Alfa Laval AB
- 6.4.18 ANDRITZ AG
- 6.4.19 Terex Corporation
- 6.4.20 EcoGreen Equipment
- 6.4.21 TANA Oy
7 Market Opportunities & Future Outlook
- 7.1 White-space & Unmet-Need Assessment
 廢棄物管理設備市場:按設備、廢棄物類型、技術和最終用戶分類-2026-2032年全球市場預測
 廢棄物管理設備市場規模、佔有率和成長分析:廢棄物設備類型和地區分類 - 2026-2033 年產業預測
 廢棄物管理設備市場規模、佔有率、成長及全球產業分析:依類型、應用和地區劃分的洞察與預測(2026-2034)廚房廢棄物設備市場按產品類型、技術、安裝類型、容量、最終用戶和分銷管道分類-2026年至2032年全球預測廢棄物處理冷水機市場按產品類型、冷卻技術、電源、最終用戶和分銷管道分類-2026-2032年全球預測
 全球廢棄物燃料技術市場
 廢棄物管理設備市場-全球產業規模、佔有率、趨勢、機會及預測(按設備類型、廢棄物類型、應用、地區及競爭情況分類,2020-2030 年預測)
 廢棄物管理設備市場:2024-2031年全球產業分析、規模、佔有率、成長、趨勢、預測