


 |
市場調查報告書
商品編碼
1911312
包裝:市場佔有率分析、產業趨勢與統計、成長預測(2026-2031)Packaging - Market Share Analysis, Industry Trends & Statistics, Growth Forecasts (2026 - 2031) |
||||||
※ 本網頁內容可能與最新版本有所差異。詳細情況請與我們聯繫。
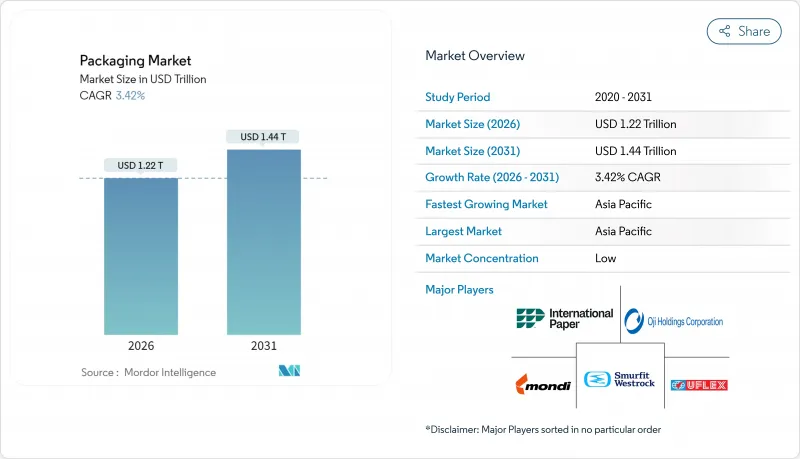
全球包裝市場預計到 2026 年價值 12203.6 億美元,高於 2025 年的 11800 億美元,預計到 2031 年將達到 14439 億美元。
預計從 2026 年到 2031 年,其複合年成長率將達到 3.42%。
這一穩步擴張標誌著全球包裝市場持續成熟,並吸收了與循環經濟指令相關的監管成本,同時消費者期望也發生了變化,他們更加重視永續性而非單純的成本績效。隨著包裝在食品、飲料、醫藥和電商通路中發揮不可替代的保護、品牌建立和合規功能,市場需求也變得更加強勁。亞太地區透過大規模生產保持較低的資本密集度,而已開發地區則在投資先進的回收技術、單一材料薄膜和數位印刷技術,從而實現近乎即時的產品發布。同時,電商小包裹的興起、一次性塑膠製品的監管禁令以及企業永續性目標的推進,正推動資金流入輕量材料、生物基成分和按需客製化平台。尋求差異化的品牌正擴大採用數位標識符,以幫助實現可追溯性、提升消費者參與度,並遵守不斷發展的生產者延伸責任制(EPR)機制。
全球包裝市場趨勢與洞察
與永續性相關的採購承諾推動材料創新
如今,企業政策明確規定了最低再生材料含量和可回收性認證,加速了對分子回收工廠和生物基樹脂的投資。雅詩蘭黛計畫在2024年實現71%的「5R」包裝框架合規率,這顯示高階品牌如何將永續性收益。採購部門正在將碳可回收性指標納入供應商評分卡,此舉與針對難回收包裝的計劃性生產者責任延伸(EPR)費用相一致。諸如塑膠塑膠回收再利用協會(APR)的「可回收設計指南」等認證項目,為縮短開發週期提供了技術藍圖。因此,樹脂供應商正在擴大解聚設備,將PET和聚醯胺還原為原生級原料,使加工商能夠在不影響產品保存期限的前提下達到再生材料含量目標。投資者正在獎勵那些將經營團隊獎金與減少包裝環境影響掛鉤的公司,這進一步推動了永續材料的製度化應用。
電子商務小包裹量的快速成長正在改變防護包裝。
都市區履約中心每天處理數十億件單品訂單,其處理步驟比傳統門市配送更多,因此對防損的需求也隨之增加。亞馬遜利用人工智慧驅動的包裝線最佳化,減少了95%的塑膠空氣枕,取而代之的是紙質緩衝材料,既能保持產品完整性,又能提高路邊回收率。自動化尺寸調整機可依每筆訂單客製化紙板坯料,減少高達30%的材料用量,同時大幅降低體積重量費用。這些配送方式的轉變推動了對輕便軟性郵件包裝的需求,這些包裝帶有整合式撕條和回封條。數位印刷機可印刷小批量圖案,在包裹打開時強化品牌故事。因此,能夠將數據分析與加工設備相結合的加工商正在搶佔不斷成長的電商市場佔有率。同時,傳統的大批量出貨商也在對其工廠進行改造,採用新的成型和密封技術。
原油價格波動會影響樹脂預算
聚乙烯、聚丙烯和PET的價格與布蘭特原油價格密切相關,導致季度合約加工商的利潤率波動難以預測。 2024年油價每桶上漲10美元,導致樹脂附加費在短短四周內出現兩位數成長,令沒有對沖手段的小規模擠出生產商雪上加霜。品牌所有者要求簽訂固定價格契約,並將成本風險轉移到下游,迫使加工商加快使用價格走勢不同的再生材料。柴油價格上漲也推高了運輸和化工原料成本,進而推高了板材價格。這種波動導致資金流向區域樹脂供應商,縮短了供應鏈。然而,食品級應用所需的高純度rPET顆粒仍供給能力。
細分市場分析
到2025年,塑膠包裝將憑藉其多功能性、快速密封性和成本效益,繼續佔據全球包裝市場41.55%的佔有率。然而,隨著監管機構和品牌章程優先考慮可再生纖維而非石油基材,預計到2031年,紙質包裝的複合年成長率將達到4.47%,超過全球整體包裝市場的成長速度。全球紙質包裝市場正穩步擴張,這主要得益於阻隔塗佈技術的進步,該技術能夠承受從冷凍庫到微波爐的循環使用。瓦楞紙板加工商正在投資數位單一途徑印刷機,以實現可直接上架的印刷效果,使零售商無需額外的展示托盤。在速食業,材料替代正在加速進行,例如,發泡聚苯乙烯正被纖維碗所取代;在糖果甜點多包裝中,定向聚丙烯正被可再生塗層紙所取代。
在硬質塑膠領域,可機械回收的單一材料PET罐和HDPE瓶的創新持續推動市場成長,並在醬料、乳製品和家居用品領域保持市場佔有率。柔軟性塑膠薄膜因其輕巧和防篡改密封性能,受益於電子商務的成長。同時,由於航太和汽車產業的需求與包裝需求競爭,金屬罐的價值鏈面臨瓶頸,導致成本壓力不斷增加。玻璃在高階飲料領域仍佔有一席之地,但能源價格飆升正在推動輕量化發展。在紡織品領域,高性能襯紙板生產的擴張推動了持續成長,成為漂白聚乙烯塗層紙盒的替代品,並在全球包裝市場創造了新的價值機會。
區域分析
亞太地區39.72%的市佔率反映了其無與倫比的製造業集中度,以及隨著可支配收入的成長,包裝食品、飲料和個人保健產品的消費量不斷增加。中國在軟包裝擠出產能方面主導,而印度的泡殼包裝產量則滿足了不斷成長的醫藥需求以及對非洲的出口。日本和韓國等成熟市場正透過高精度加工技術、抗菌塗層和數位裝飾等方式提升產品附加價值。印尼和越南正在擴大瓦楞紙板廠,以滿足其電子產品出口基地的需求,從而推動了對紙板的強勁需求。
歐洲在生態設計領域保持主導,透過《包裝廢棄物法規》(PPWR) 的強制性規定,推廣減少材料使用和可回收的解決方案。德國的閉合迴路PET回收系統實現了近98%的回收率,為其他成員國樹立了榜樣。法國和義大利正在擴大生產者責任制計劃,透過優惠費用鼓勵使用消費後回收樹脂。東歐憑藉著具有競爭力的工資水平和接近性歐盟市場的地理優勢,吸引軟質包裝投資,為加工商提供成本和合規方面的優勢。
在北美,成熟的消費模式推動了穩定的替換需求,而全通路能力也呈現出成長動能。美國加工商正利用機器人技術實現瓦楞紙板生產線的自動化,並確保零破損交付,以符合亞馬遜「零挫」購物體驗的指導原則。加拿大的押金制度支持高品質的玻璃回收利用,並為精釀飲料填充機提供原料。墨西哥的樹脂工廠同時供應國內和美國市場,從而有效抵禦了供應衝擊。
在中東和非洲地區,隨著沙烏地阿拉伯和阿拉伯聯合大公國經濟多元化進程的推進,經濟成長正在加速。新興特大城市正在興起現代零售業態,對先進的初級和二級包裝提出了更高的要求。南非回收基礎設施的完善確保了再生PET(rPET)的供應,從而支持了該地區的瓶罐循環利用體系,並將循環經濟概念融入到不斷擴張的全球包裝市場中。
其他福利:
- Excel格式的市場預測(ME)表
- 3個月的分析師支持
目錄
第1章 引言
- 研究假設和市場定義
- 調查範圍
第2章調查方法
第3章執行摘要
第4章 市場情勢
- 市場概覽
- 市場促進因素
- 與永續發展掛鉤的採購承諾
- 電子商務小包裹量快速成長
- 品牌所有者轉向單一材料薄膜
- 對一次性塑膠製品的監管禁令
- 利用現場數位印刷實現 SKU 多樣化
- 推出智慧互聯包裝(支援物聯網、QR碼、NFC 等技術)
- 市場限制
- 原油價格波動會影響樹脂成本
- 已開發國家日益高漲的反塑膠情緒
- 鋁罐板材供應緊張
- 容器玻璃熔爐能源成本不斷上漲
- 產業價值鏈分析
- 監管環境
- 技術展望
- 波特五力分析
- 新進入者的威脅
- 供應商的議價能力
- 買方的議價能力
- 替代品的威脅
- 競爭對手之間的競爭
- 宏觀經濟因素如何影響市場
第5章 市場規模與成長預測
- 按包裝類型
- 塑膠包裝
- 按類型
- 硬質塑膠包裝
- 依材料類型
- 聚丙烯(PP)
- 聚對苯二甲酸乙二醇酯(PET)
- 聚氯乙烯(PVC)
- 聚苯乙烯(PS)和發泡聚苯乙烯(EPS)
- 其他材料類型
- 依產品類型
- 瓶子和罐子
- 瓶蓋和封口
- 托盤和容器
- 其他產品類型
- 按最終用途行業分類
- 食物
- 飲料
- 製藥
- 化妝品和個人護理
- 產業
- 其他終端用戶產業
- 依材料類型
- 軟塑膠包裝
- 依材料類型
- 聚乙烯(PE)
- 雙軸延伸聚丙烯(BOPP)
- 澆鑄聚丙烯(CPP)
- 其他材料類型
- 依產品類型
- 小袋和包裝袋
- 薄膜和包裝
- 其他產品類型
- 按最終用途行業分類
- 食物
- 飲料
- 製藥
- 化妝品和個人護理
- 產業
- 其他終端用戶產業
- 依材料類型
- 硬質塑膠包裝
- 依產品類型
- 瓶子和罐子
- 小袋和袋子
- 散裝產品
- 其他產品類型
- 按最終用途行業分類
- 食物
- 飲料
- 化妝品和個人護理
- 製藥
- 產業
- 其他終端用戶產業
- 按類型
- 紙包裝
- 依產品類型
- 可折疊瓦楞紙箱
- 瓦楞紙箱
- 液態紙板
- 其他產品類型
- 按最終用途行業分類
- 食物
- 飲料
- 電子商務
- 其他終端用戶產業
- 依產品類型
- 容器玻璃
- 按顏色
- 綠色的
- 琥珀色
- 燧石
- 其他顏色
- 按最終用途行業分類
- 食物
- 飲料
- 酒精飲料
- 不含酒精的飲料
- 個人護理和化妝品
- 藥品(不含管瓶和安瓿瓶)
- 香水
- 按顏色
- 金屬罐和容器
- 依材料類型
- 鋼
- 鋁
- 依產品類型
- 能
- 鼓和桶
- 瓶蓋和封口
- 其他產品類型
- 按最終用途行業分類
- 食物
- 飲料
- 化工和石油
- 產業
- 油漆和塗料
- 其他終端用戶產業
- 依材料類型
- 塑膠包裝
- 按包裝類型
- 死板的
- 靈活的
- 按最終用途行業分類
- 食物
- 飲料
- 製藥和醫療保健
- 個人護理和化妝品
- 產業
- 電子商務
- 其他終端用戶產業
- 按地區
- 北美洲
- 美國
- 加拿大
- 墨西哥
- 南美洲
- 巴西
- 阿根廷
- 墨西哥
- 其他南美洲
- 歐洲
- 德國
- 法國
- 英國
- 義大利
- 西班牙
- 波蘭
- 其他歐洲地區
- 亞太地區
- 中國
- 印度
- 日本
- 泰國
- 澳洲
- 韓國
- 亞太其他地區
- 中東和非洲
- 中東
- 沙烏地阿拉伯
- 阿拉伯聯合大公國
- 土耳其
- 其他中東地區
- 非洲
- 南非
- 奈及利亞
- 埃及
- 其他非洲地區
- 中東
- 北美洲
第6章 競爭情勢
- 市場集中度
- 策略趨勢
- 市佔率分析
- 公司簡介
- Amcor plc
- International Paper Company
- Smurfit WestRock
- Ball Corporation
- Crown Holdings Inc.
- Mondi plc
- Oji Holdings Corporation
- UFlex Limited
- Huhtamaki Oyj
- Sealed Air Corporation
- Greif Inc.
- Sonoco Products Company
- AptarGroup Inc.
- ALPLA Group GmbH
- OI Glass Inc.
- Verallia SE
- Vidrala SA
- Gerresheimer AG
- Vitro SAB de CV
- Ardagh Group SA
- CANPACK SA
- Silgan Holdings Inc.
- AGI Glaspac
- Packman Packaging Pvt. Ltd.
- Tetra Pak International SA
第7章 市場機會與未來展望
The global packaging market size in 2026 is estimated at USD 1,220.36 billion, growing from 2025 value of USD 1,180 billion with 2031 projections showing USD 1,443.9 billion, growing at 3.42% CAGR over 2026-2031.
This steady expansion demonstrates how the global packaging market continues to mature while absorbing regulatory costs linked to circular-economy mandates and shifting consumer expectations that favor sustainability over pure cost-performance metrics. Demand resilience arises from packaging's irreplaceable protection, brand-building, and compliance functions across food, beverage, pharmaceuticals, and e-commerce channels. Asia-Pacific keeps capital intensity low through large-scale manufacturing, whereas developed regions invest in advanced recycling, mono-material films, and digital printing that enable near-real-time SKU launches. Meanwhile, e-commerce parcel growth, regulatory bans on single-use plastics, and corporate sustainability targets reinforce capital flows toward lighter materials, bio-based feedstocks, and on-demand customization platforms. Brands pursuing differentiation increasingly embed digital identifiers that support traceability, consumer engagement, and compliance with evolving extended producer responsibility (EPR) schemes.
Global Packaging Market Trends and Insights
Sustainability-Linked Purchasing Commitments Drive Material Innovation
Corporate mandates now specify minimum recycled content and confirmed recyclability, accelerating investment in molecular recycling plants and bio-based resins. Estee Lauder reached 71% compliance with its "5 Rs" packaging framework in 2024, illustrating how premium brands monetize sustainability narratives. Procurement teams embed carbon and recyclability metrics into supplier scorecards, a trend that aligns with forthcoming EPR fees that penalize hard-to-recycle formats. Certification programs such as the Association of Plastic Recyclers' design-for-recycling guidelines supply technical blueprints that shorten development cycles. As a result, resin suppliers scale depolymerization units that return PET and polyamide to virgin-grade feedstock, letting converters hit recycled-content targets without compromising shelf life. Investors reward companies that link executive bonuses to packaging footprint reductions, further institutionalizing sustainable-material adoption.
E-Commerce Parcel Volume Explosion Reshapes Protective Packaging
Urban fulfillment centers ship billions of single-item orders that face more handling steps than traditional store deliveries, heightening damage-prevention needs. Amazon's AI-driven pack-line optimization removed 95% of plastic air pillows, substituting paper cushioning that maintains product integrity and improves curbside recyclability. Automated right-sizing machinery now cuts custom corrugated blanks per order, trimming material use by up to 30% while slashing dimensional-weight fees. These volume dynamics elevate demand for lightweight flexible mailers with integrated tear strips and return seals. Digital presses print small-batch graphics that reinforce brand storytelling during unboxing. Consequently, converters capable of integrating data analytics with converting assets capture growing e-commerce wallet share, while traditional bulk shippers retrofit plants with new forming and sealing technologies.
Crude-Oil Price Volatility Impacts Resin Budgets
Polyethylene, polypropylene, and PET prices correlate strongly with Brent crude, creating unpredictable margin swings for converters on quarterly contracts. Sudden USD 10 per-barrel spikes in 2024 translated into double-digit resin surcharges inside four weeks, straining small extruders that lack hedging tools. Brand owners demanded fixed-price agreements, shifting cost risk downstream and prompting converters to accelerate recycled-content usage that follows a different price curve. Paperboard prices also climbed because higher diesel rates elevated transport costs and chemical inputs. The volatility steers capital toward regional resin suppliers and shortens supply chains, although capacity gaps persist in high-purity rPET pellets needed for food-grade applications.
Other drivers and restraints analyzed in the detailed report include:
- Brand-Owner Shift to Mono-Material Films Simplifies Recycling
- Regulatory Bans on Single-Use Plastics Accelerate Alternatives
- Rising Anti-Plastic Sentiment Shapes Brand Decisions
For complete list of drivers and restraints, kindly check the Table Of Contents.
Segment Analysis
Plastic packaging retained 41.55% of the global packaging market share in 2025 on the strength of its versatility, sealing speed, and cost efficiency. Yet paper packaging's 4.47% CAGR through 2031 outpaces overall global packaging market growth as regulators and brand charters privilege renewable fiber over petroleum-based substrates. The global packaging market size allocated to paper formats widens, supported by barrier coatings that now survive freezer-to-microwave cycles. Corrugated converters invest in digital single-pass presses that enable shelf-ready graphics, letting retailers skip additional display trays. Material substitution accelerates in quick-service food, where fiber bowls replace expanded polystyrene, and in confectionery multipacks that migrate from oriented polypropylene to recyclable coated paper.
The rigid plastics segment preserves traction via innovations in mono-material PET jars and HDPE bottles compatible with mechanical recycling, sustaining share in sauces, dairy, and home-care. Flexible plastic films enjoy e-commerce tailwinds owing to their low weight and tamper-evident seals. Meanwhile, metal cans face supply-chain limits as aerospace and automotive demand collide with packaging orders, driving cost pressure. Glass maintains niche roles in premium beverages but absorbs energy-price shocks that encourage light-weighting. Fiber growth continues as mills ramp high-performance linerboards capable of replacing bleached polyethylene-coated cartons, creating new value pools inside the global packaging market.
The Packaging Market Report is Segmented by Packaging Type (Plastic Packaging, Paper Packaging, Container Glass, Metal Cans and Containers), Packaging Format (Rigid, Flexible), End-Use Industry (Food, Beverage, Pharmaceuticals and Healthcare, Personal Care and Cosmetics, Industrial, E-Commerce), and Geography (North America, South America, Europe, and More). The Market Forecasts are Provided in Terms of Value (USD).
Geography Analysis
Asia-Pacific's 39.72% share reflects unparalleled manufacturing density plus rising disposable incomes that expand packaged food, beverage, and personal-care consumption. China dominates flexible film extrusion capacity, while India's blister-pack output meets growing pharmaceutical demand and exports to Africa. Mature markets like Japan and South Korea add value through high-precision converting, antimicrobial coatings, and digital embellishment. Indonesia and Vietnam scale corrugated plants to support electronics export hubs, fueling steady cartonboard demand.
Europe maintains leadership in eco-design, leveraging PPWR-driven mandates that incentivize source-reduced and recyclable solutions. Germany's closed-loop PET system achieves collection rates near 98%, offering a blueprint for other member states. France and Italy expand producer-responsibility schemes that reward post-consumer resin usage with fee discounts. Eastern Europe attracts flexible-packaging investments that balance wage competitiveness with EU market proximity, giving converters cost and compliance advantages.
North America's mature consumption drives consistent replacement demand, yet growth pockets emerge in omnichannel fulfillment. U.S. converters automate corrugated factories with robotics, meeting Amazon Frustration-Free guidelines for damage-free delivery. Canada's deposit systems support high-quality glass recycling that supplies craft beverage fillers, while Mexico's resin plants feed both domestic and U.S. markets, hedging against supply shocks.
Middle East and Africa accelerates as Saudi Arabia and UAE diversify economies; new megacities attract modern retail formats requiring sophisticated primary and secondary packaging. South Africa's collection infrastructure upgrades enable rPET availability, feeding regional bottle loops and embedding circular practices into the expanding global packaging market.
- Amcor plc
- International Paper Company
- Smurfit WestRock
- Ball Corporation
- Crown Holdings Inc.
- Mondi plc
- Oji Holdings Corporation
- UFlex Limited
- Huhtamaki Oyj
- Sealed Air Corporation
- Greif Inc.
- Sonoco Products Company
- AptarGroup Inc.
- ALPLA Group GmbH
- O-I Glass Inc.
- Verallia SE
- Vidrala S.A.
- Gerresheimer AG
- Vitro S.A.B. de C.V.
- Ardagh Group S.A.
- CANPACK S.A.
- Silgan Holdings Inc.
- AGI Glaspac
- Packman Packaging Pvt. Ltd.
- Tetra Pak International S.A.
Additional Benefits:
- The market estimate (ME) sheet in Excel format
- 3 months of analyst support
TABLE OF CONTENTS
1 INTRODUCTION
- 1.1 Study Assumptions and Market Definition
- 1.2 Scope of the Study
2 RESEARCH METHODOLOGY
3 EXECUTIVE SUMMARY
4 MARKET LANDSCAPE
- 4.1 Market Overview
- 4.2 Market Drivers
- 4.2.1 Sustainability-linked purchasing commitments
- 4.2.2 E-commerce parcel volume explosion
- 4.2.3 Brand-owner shift to mono-material films
- 4.2.4 Regulatory bans on single-use plastics
- 4.2.5 On-site digital print enabling SKU proliferation
- 4.2.6 Adoption of smart and connected packaging (IoT, QR, NFC-enabled solutions)
- 4.3 Market Restraints
- 4.3.1 Crude-oil price volatility impacting resin costs
- 4.3.2 Rising anti-plastic sentiment in developed economies
- 4.3.3 Aluminum can sheet supply tightness
- 4.3.4 Container-glass furnace energy inflation
- 4.4 Industry Value Chain Analysis
- 4.5 Regulatory Landscape
- 4.6 Technological Outlook
- 4.7 Porter's Five Forces Analysis
- 4.7.1 Threat of New Entrants
- 4.7.2 Bargaining Power of Suppliers
- 4.7.3 Bargaining Power of Buyers
- 4.7.4 Threat of Substitutes
- 4.7.5 Competitive Rivalry
- 4.8 The Impact of Macroeconomic Factors on the Market
5 MARKET SIZE & GROWTH FORECASTS (VALUE)
- 5.1 By Packaging Type
- 5.1.1 Plastic Packaging
- 5.1.1.1 By Type
- 5.1.1.1.1 Rigid Plastic Packaging
- 5.1.1.1.1.1 By Material Type
- 5.1.1.1.1.1.1 Polypropylene (PP)
- 5.1.1.1.1.1.2 Polyethylene Terephthalate (PET)
- 5.1.1.1.1.1.3 Polyvinyl Chloride (PVC)
- 5.1.1.1.1.1.4 Polystyrene (PS) and Expanded Polystyrene (EPS)
- 5.1.1.1.1.1.5 Other Material Types
- 5.1.1.1.1.2 By Product Type
- 5.1.1.1.1.2.1 Bottles and Jars
- 5.1.1.1.1.2.2 Caps and Closures
- 5.1.1.1.1.2.3 Trays and Containers
- 5.1.1.1.1.2.4 Other Product Types
- 5.1.1.1.1.3 By End-use Industry
- 5.1.1.1.1.3.1 Food
- 5.1.1.1.1.3.2 Beverage
- 5.1.1.1.1.3.3 Pharmaceutical
- 5.1.1.1.1.3.4 Cosmetics and Personal Care
- 5.1.1.1.1.3.5 Industrial
- 5.1.1.1.1.3.6 Other End-use Industries
- 5.1.1.1.1.1 By Material Type
- 5.1.1.1.2 Flexible Plastic Packaging
- 5.1.1.1.2.1 By Material Type
- 5.1.1.1.2.1.1 Polyethylene (PE)
- 5.1.1.1.2.1.2 Biaxially Oriented Polypropylene (BOPP)
- 5.1.1.1.2.1.3 Cast Polypropylene (CPP)
- 5.1.1.1.2.1.4 Other Material Types
- 5.1.1.1.2.2 By Product Type
- 5.1.1.1.2.2.1 Pouches and Bags
- 5.1.1.1.2.2.2 Films and Wraps
- 5.1.1.1.2.2.3 Other Product Types
- 5.1.1.1.2.3 By End-use Industry
- 5.1.1.1.2.3.1 Food
- 5.1.1.1.2.3.2 Beverage
- 5.1.1.1.2.3.3 Pharmaceutical
- 5.1.1.1.2.3.4 Cosmetics and Personal Care
- 5.1.1.1.2.3.5 Industrial
- 5.1.1.1.2.3.6 Other End-use Industries
- 5.1.1.1.2.1 By Material Type
- 5.1.1.1.1 Rigid Plastic Packaging
- 5.1.1.2 By Product Type
- 5.1.1.2.1 Bottles and Jars
- 5.1.1.2.2 Pouches and Bags
- 5.1.1.2.3 Bulk-Grade Products
- 5.1.1.2.4 Other Product Types
- 5.1.1.3 By End-use Industry
- 5.1.1.3.1 Food
- 5.1.1.3.2 Beverages
- 5.1.1.3.3 Cosmetics and Personal Care
- 5.1.1.3.4 Pharamceuticals
- 5.1.1.3.5 Industrial
- 5.1.1.3.6 Other End-use Industries
- 5.1.1.1 By Type
- 5.1.2 Paper Packaging
- 5.1.2.1 By Product Type
- 5.1.2.1.1 Folding Carton
- 5.1.2.1.2 Corrugated Boxes
- 5.1.2.1.3 Liquid Paperboard
- 5.1.2.1.4 Other Product Types
- 5.1.2.2 By End-use Industry
- 5.1.2.2.1 Food
- 5.1.2.2.2 Beverages
- 5.1.2.2.3 E-commerce
- 5.1.2.2.4 Other End-use Industry
- 5.1.2.1 By Product Type
- 5.1.3 Container Glass
- 5.1.3.1 By Color
- 5.1.3.1.1 Green
- 5.1.3.1.2 Amber
- 5.1.3.1.3 Flint
- 5.1.3.1.4 Other Colors
- 5.1.3.2 By End-use Industry
- 5.1.3.2.1 Food
- 5.1.3.2.2 Beverage
- 5.1.3.2.2.1 Alcoholic
- 5.1.3.2.2.2 Non-Alcoholic
- 5.1.3.2.3 Personal Care and Cosmetics
- 5.1.3.2.4 Pharmaceuticals (excluding Vials and Ampoules)
- 5.1.3.2.5 Perfumery
- 5.1.3.1 By Color
- 5.1.4 Metal Cans and Containers
- 5.1.4.1 By Material Type
- 5.1.4.1.1 Steel
- 5.1.4.1.2 Aluminum
- 5.1.4.2 By Product Type
- 5.1.4.2.1 Cans
- 5.1.4.2.2 Drums and Barrels
- 5.1.4.2.3 Caps and Closures
- 5.1.4.2.4 Other Product Types
- 5.1.4.3 By End-use Industry
- 5.1.4.3.1 Food
- 5.1.4.3.2 Beverage
- 5.1.4.3.3 Chemicals and Petroleum
- 5.1.4.3.4 Industrial
- 5.1.4.3.5 Paints and coatings
- 5.1.4.3.6 Other End-use Industries
- 5.1.4.1 By Material Type
- 5.1.1 Plastic Packaging
- 5.2 By Packaging Format
- 5.2.1 Rigid
- 5.2.2 Flexible
- 5.3 By End-Use Industry
- 5.3.1 Food
- 5.3.2 Beverage
- 5.3.3 Pharmaceuticals and Healthcare
- 5.3.4 Personal Care and Cosmetics
- 5.3.5 Industrial
- 5.3.6 E-commerce
- 5.3.7 Other End-use Industry
- 5.4 By Geography
- 5.4.1 North America
- 5.4.1.1 United States
- 5.4.1.2 Canada
- 5.4.1.3 Mexico
- 5.4.2 South America
- 5.4.2.1 Brazil
- 5.4.2.2 Argentina
- 5.4.2.3 Mexico
- 5.4.2.4 Rest of South America
- 5.4.3 Europe
- 5.4.3.1 Germany
- 5.4.3.2 France
- 5.4.3.3 United Kingdom
- 5.4.3.4 Italy
- 5.4.3.5 Spain
- 5.4.3.6 Poland
- 5.4.3.7 Rest of Europe
- 5.4.4 Asia-Pacific
- 5.4.4.1 China
- 5.4.4.2 India
- 5.4.4.3 Japan
- 5.4.4.4 Thailand
- 5.4.4.5 Australia
- 5.4.4.6 South Korea
- 5.4.4.7 Rest of Asia-Pacific
- 5.4.5 Middle East and Africa
- 5.4.5.1 Middle East
- 5.4.5.1.1 Saudi Arabia
- 5.4.5.1.2 United Arab Emirates
- 5.4.5.1.3 Turkey
- 5.4.5.1.4 Rest of Middle East
- 5.4.5.2 Africa
- 5.4.5.2.1 South Africa
- 5.4.5.2.2 Nigeria
- 5.4.5.2.3 Egypt
- 5.4.5.2.4 Rest of Africa
- 5.4.5.1 Middle East
- 5.4.1 North America
6 COMPETITIVE LANDSCAPE
- 6.1 Market Concentration
- 6.2 Strategic Moves
- 6.3 Market Share Analysis
- 6.4 Company Profiles (includes Global level Overview, Market level overview, Core Segments, Financials as available, Strategic Information, Market Rank/Share for key companies, Products and Services, and Recent Developments)
- 6.4.1 Amcor plc
- 6.4.2 International Paper Company
- 6.4.3 Smurfit WestRock
- 6.4.4 Ball Corporation
- 6.4.5 Crown Holdings Inc.
- 6.4.6 Mondi plc
- 6.4.7 Oji Holdings Corporation
- 6.4.8 UFlex Limited
- 6.4.9 Huhtamaki Oyj
- 6.4.10 Sealed Air Corporation
- 6.4.11 Greif Inc.
- 6.4.12 Sonoco Products Company
- 6.4.13 AptarGroup Inc.
- 6.4.14 ALPLA Group GmbH
- 6.4.15 O-I Glass Inc.
- 6.4.16 Verallia SE
- 6.4.17 Vidrala S.A.
- 6.4.18 Gerresheimer AG
- 6.4.19 Vitro S.A.B. de C.V.
- 6.4.20 Ardagh Group S.A.
- 6.4.21 CANPACK S.A.
- 6.4.22 Silgan Holdings Inc.
- 6.4.23 AGI Glaspac
- 6.4.24 Packman Packaging Pvt. Ltd.
- 6.4.25 Tetra Pak International S.A.
7 MARKET OPPORTUNITIES AND FUTURE OUTLOOK
- 7.1 White-space and Unmet-Need Assessment
 濕度控制包裝市場預測至2034年-按產品類型、材料、包裝形式、通路、最終用戶和地區分類的全球分析
 感官包裝市場:依技術、材料、感測器類型、包裝形式和應用分類-2026-2032年全球市場預測
 2026年全球包裝與標籤服務市場報告氣泡膜市場:2026-2032年全球市場預測(依材料、厚度、應用、最終用戶及通路分類)復古包裝市場:按材料、類型、最終用途、印刷技術和通路-2026-2032年全球預測紙質復古包裝市場:依材料、包裝類型、銷售管道、最終用戶、應用程式分類,全球預測(2026-2032)多功能零件市場按產品類型、價格範圍、應用、垂直產業和分銷管道分類,全球預測(2026-2032年)紙塑包裝器材市場:依機器類型、材料、操作類型和應用分類,全球預測(2026-2032年)
 航太級包裝市場規模、佔有率、成長、產業分析,依材料、應用及區域預測 (~2034年)全球電子順磁共振波譜儀市場(按產品類型、頻率、工作模式、組件、應用和最終用戶分類)預測(2026-2032年)