


 |
市場調查報告書
商品編碼
1910579
美國包裝市場:市場佔有率分析、產業趨勢與統計、成長預測(2026-2031年)United States Packaging - Market Share Analysis, Industry Trends & Statistics, Growth Forecasts (2026 - 2031) |
||||||
※ 本網頁內容可能與最新版本有所差異。詳細情況請與我們聯繫。
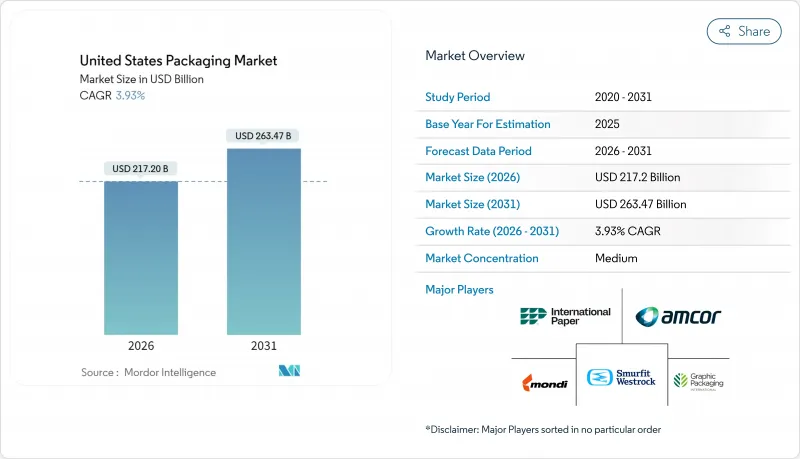
美國包裝市場預計將從 2025 年的 2,089.8 億美元成長到 2026 年的 2,172 億美元,到 2031 年達到 2,634.7 億美元,2026 年至 2031 年的複合年成長率為 3.93%。
與價值9408億美元的卡車運輸業的緊密聯繫支撐著美國包裝市場的韌性,因為包裝設計和重量直接影響貨運成本。電子商務的擴張、州級生產者延伸責任制(EPR)等監管政策的變化,以及製藥產能加速回流,都在推動對自動化生產線和阻隔性材料的投資。儘管美國市場持續受益於食品飲料行業的優質化,但來自無PFAS法規和聚合物產能增加的成本壓力正在擠壓加工商的利潤空間。大規模一體化供應商利用其規模和研發實力來承擔監管合規成本並維持定價權。同時,規模較小的公司則在細分市場中尋求差異化競爭。
美國包裝市場趨勢與洞察
電子商務的快速成長推動了對小批量包裝的需求。
投資自動化二級生產線能夠幫助消費品製造商有效應對勞動力短缺和產品種類繁多的挑戰。玫琳凱公司斥資200萬美元進行設備升級後,在維持每分鐘50-60件產品產量的同時,減少了85%的生產線人力成本。主要承運商的體積重量收費政策有利於小型輕便的小包裹,從而刺激了對尺寸合適的紙板襯墊和緩衝材料的需求。隨著美國包裝市場向全通路解決方案轉型,能夠提供集保護、品牌推廣和數據豐富於一體的整合解決方案的加工商,正贏得尋求降低最後一公里配送成本的訂單的青睞。自動化有助於經銷商減少揀貨和包裝錯誤,並實現隔日送達,因此可靠的二級包裝成為競爭優勢的關鍵。擁有多元化材料組合的加工商正受益於基材多源採購的趨勢,從而降低供應鏈風險。
食品飲料產業的優質化正在加速對阻隔性性軟包裝的需求。
為了延長保存期限並支持潔淨標示配方,高階品牌正轉向使用多層高阻隔薄膜,這推高了美國包裝市場的單價。先進的塗層技術能夠阻隔氧氣、光線和水分,在不添加任何添加劑的情況下保護天然風味,並減少食物浪費。消費者偏好可重複密封的吸嘴和帶有透明窗口的包裝袋,這要求加工商在阻隔性能和商店吸引力之間取得平衡。 FDA的食品接觸認證增加了合規的複雜性,並限制了資本投入較低的競爭對手進入市場。品牌所有者正透過以消費者對感知品質的支付意願為核心的利潤擴大策略來證明更高的包裝成本是合理的。有機零食和即飲咖啡銷售的成長正在推動對高階軟包裝的需求,並增強薄膜擠出製造商的長期訂單。
加州SB-54號法案下的生產者延伸責任計畫中的成本轉移
紐森州長因企業負擔而推遲了最初法規的實施,但到2032年將塑膠使用量減少25%的目標以及50億美元的廢棄物基金仍然有效。生產商將被要求投資建造回收基礎設施並重新設計包裝,否則將支付分級費用。雖然美國包裝市場的大型企業能夠將成本分攤到各種產品上,但小型加工商面臨利潤率降低和資本投資能力下降的問題。不確定性阻礙了新產品推出,而關於使用加州特有SKU還是全國統一標準的爭論也使州際物流變得複雜。成本轉嫁給品牌所有者給商店價格帶來了壓力,並可能減緩某些消費品類別的銷售成長。
細分市場分析
由於塑膠用途廣泛且成本效益高,預計2025年,塑膠在美國包裝市場仍將佔據35.88%的佔有率。然而,紙張和紙板正以5.33%的複合年成長率快速成長,預計到2031年,隨著零售商轉向纖維基替代品,紙張和紙板將蠶食部分塑膠的市場佔有率。美國能源部承諾投入5,200萬美元用於纖維素薄膜,這顯示公共部門支持下一代基材的發展。天然高密度聚乙烯(HDPE)的短缺將導致再生樹脂價格在2025年3月達到每磅96美分,這將給瓶到瓶回收計劃帶來挑戰。
美國包裝市場的塑膠加工商面臨雙重壓力:碳排放會計要求和樹脂供應過剩的風險。投資正轉向可回收的單組分聚乙烯薄膜,而多層尼龍結構則被高阻隔紙所取代。由於飲料製造商採用可無限循環利用的合金罐,金屬包裝的需求依然強勁。整體而言,如今材料的選擇重點在於平衡成本、循環利用指標和監管風險,而非僅僅關注基本性能。
到2025年,紙和紙板製品將占美國包裝市場佔有率的28.70%,這主要得益於瓦楞紙包裝的大量消耗。金屬製品預計將以6.64%的複合年成長率成長,因為碳酸飲料和硬蘇打水因其輕盈和可回收的優點而選擇鋁罐。 Crown Holdings的飲料罐收入預計在2024年成長17%,證實了市場需求的持續成長。 Silgan維持了金屬食品罐市場50%的佔有率,顯示常溫保存產品的市場韌性。
數位印刷技術的應用使加工商能夠應對季節性的SKU激增,而HDPE等硬質塑膠瓶仍然是食品雜貨行業超值包裝的首選。然而,金屬的無限可回收特性引起了具有環保意識的消費者的共鳴,促使促銷預算轉向以罐裝為主的包裝形式。儘管倫敦金屬交易所(LME)鋁價的波動可能會限制銷售成長,但品牌所有者正透過簽訂多年期照付不議合約來規避風險,從而穩定與罐體製造商的訂單。
其他福利:
- Excel格式的市場預測(ME)表
- 分析師支持(3個月)
目錄
第1章 引言
- 研究假設和市場定義
- 調查範圍
第2章調查方法
第3章執行摘要
第4章 市場情勢
- 市場概覽
- 市場促進因素
- 電子商務的快速成長推動了對小批量包裝的需求。
- 食品和飲料的高階優質化正在加速對高阻隔阻隔性軟性包裝材料的需求。
- 藥品填充和包裝設備回歸日本,推動了對無菌包裝的需求。
- 消費品製造商的自動化二級包裝生產線
- 零售媒體網路更青睞可直接上架的包裝形式。
- 美國和能源部為生物聚合物先導工廠提供的津貼(低調)
- 市場限制
- 加州SB-54法案「生產者延伸責任制」成本轉移
- 不含 PFAS 的規定會增加配方成本
- 2028-2029年PE和PP裂解產能過剩將導致壓力轉換器利潤率下降(被低估)。
- 底盤短缺導致紙箱運輸成本上漲(未充分通報)
- 產業供應鏈分析
- 監管環境
- 技術展望
- 波特五力分析
- 供應商的議價能力
- 消費者議價能力
- 新進入者的威脅
- 替代品的威脅
- 競爭對手之間的競爭
第5章 市場規模與成長預測
- 依材料類型
- 紙和紙板
- 塑膠
- 聚乙烯 聚丙烯 (PP)
- 高密度聚苯乙烯(HDPE)和低密度聚乙烯(LDPE)
- 聚對苯二甲酸乙二醇酯(PET)
- 聚氯乙烯(PVC)
- 聚苯乙烯(PS)
- 其他塑膠製品
- 金屬
- 玻璃容器
- 依產品類型
- 紙和紙板產品類型
- 折疊紙盒和硬紙盒
- 瓦楞紙箱和容器
- 免洗紙製品
- 其他紙和紙板產品類型
- 塑膠製品類型
- 硬質塑膠
- 瓶子和罐子
- 瓶蓋和封口
- 散裝產品
- 其他硬質塑膠膠製品類型
- 軟塑膠
- 小袋
- 包包
- 薄膜和包裝
- 其他軟塑膠製品類型
- 硬質塑膠
- 金屬製品類型
- 能
- 瓶蓋和封口
- 氣霧劑容器
- 其他金屬製品類型
- 玻璃容器產品類型
- 瓶子
- 瓶子
- 紙和紙板產品類型
- 按包裝類型
- 硬質包裝形式
- 軟包裝
- 最終用戶
- 食物
- 飲料
- 藥品和醫療保健
- 個人護理和化妝品
- 工業/化工
- 農業
- 車
- 其他最終用戶
第6章 競爭情勢
- 市場集中度
- 策略趨勢
- 市佔率分析
- 公司簡介
- Amcor plc
- Sealed Air Corporation
- Ball Corporation
- Crown Holdings, Inc.
- Sonoco Products Company
- American Packaging Corporation
- International Paper Company
- Graphic Packaging Holding Company
- Novolex Holdings, LLC
- ProAmpac Holdings Inc.
- Silgan Holdings Inc.
- AptarGroup, Inc.
- Huhtamaki Oyj
- Printpack, Inc.
- Packaging Corporation of America
- CCL Industries Inc.
- Ardagh Group SA
- Smurfit WestRock plc
- Mondi plc
第7章 市場機會與未來展望
The United States Packaging market is expected to grow from USD 208.98 billion in 2025 to USD 217.2 billion in 2026 and is forecast to reach USD 263.47 billion by 2031 at 3.93% CAGR over 2026-2031.
Strong links to the country's USD 940.8 billion trucking sector keep the US packaging market resilient, because packaging design and weight directly shape freight costs. E-commerce proliferation, regulatory shifts such as state-level Extended Producer Responsibility statutes, and accelerated on-shoring of pharmaceutical capacity are steering capital toward automation-ready lines and higher-barrier materials. The US market continues to benefit from premiumization in food and beverage segments, while cost pressures from PFAS-free mandates and polymer capacity additions squeeze margins for converters. Large, integrated suppliers leverage scale and R&D depth to absorb regulatory compliance costs and preserve pricing power as smaller firms seek niche differentiation.
United States Packaging Market Trends and Insights
E-commerce Boom Driving Small-Parcel Packaging Demand
Investments in automation-ready secondary lines allow consumer packaged goods firms to manage labor shortages and SKU proliferation efficiently, with Mary Kay trimming line labor by 85% after a USD 2 million upgrade while maintaining 50-60 units per minute. Dimensional-weight pricing by major carriers rewards smaller, lighter parcel formats, stimulating demand for right-sized corrugated inserts and cushioning. As the US packaging market aligns with omnichannel fulfillment, converters that offer integrated protective, branded, and data-rich solutions capture volume from retailers seeking to cut last-mile costs. Automation helps distributors minimize pick-pack errors and meet one-day delivery promises, making reliable secondary packaging a competitive necessity. Supply chain risk mitigation encourages multisourcing of substrates, benefiting converters with diversified material portfolios.
Premiumization in Food and Beverage Accelerating Demand for High-Barrier Flexibles
Premium brands are shifting to multilayer high-barrier films that extend shelf life and support clean-label formulas, a move that lifts average price per unit in the US packaging market. Advanced coatings block oxygen, light, and moisture, safeguarding natural flavors without additives and reducing food waste. Consumers favor pouches with resealable spouts and transparent windows, pushing converters to balance barrier performance with shelf appeal. FDA food contact clearances add compliance complexity, limiting the entry of low-capex competitors. Brand owners justify higher pack costs through margin-expansion strategies centered on consumer willingness to pay for perceived quality. As sales of organic snacks and ready-to-drink coffees climb, demand for premium flexible formats strengthens long-term order books for film extruders.
California's SB-54 Extended Producer Responsibility Cost Pass-Through
Governor Newsom delayed initial regulations, citing business burden, yet the 25% plastic reduction mandate by 2032 and the USD 5 billion waste fund remain in force. Producers must finance recycling infrastructure and redesign packages or pay modulated fees. Larger players in the US packaging market spread costs across wider portfolios, whereas small converters face margin erosion and reduced capex capacity. Uncertainty stalls new-product launches and complicates interstate logistics as companies debate California-only SKUs versus national harmonization. Cost pass-through to brand owners pressures shelf pricing, potentially dampening volume growth in discretionary categories.
Other drivers and restraints analyzed in the detailed report include:
- On-shoring of Pharmaceutical Fill-Finish Capacity Boosting Sterile Packaging
- Automation-Ready Secondary Packaging Lines at CPGs
- PFAS-Free Mandates Raising Formulation Costs
For complete list of drivers and restraints, kindly check the Table Of Contents.
Segment Analysis
Plastic retained 35.88% of the US packaging market share in 2025, thanks to versatility and cost efficiency. Paper and paperboard, however, grew at a 5.33% CAGR and are expected to erode some plastic volume by 2031 as retailers pledge fiber-based alternatives. The Department of Energy's USD 52 million fund toward cellulose-based films signals public-sector backing for next-gen substrates. Natural HDPE scarcity pushed recycled resin to 96 cents per pound in March 2025, challenging bottle-to-bottle projects.
Plastic converters in the US packaging market face dual pressure from carbon accounting demands and resin oversupply risks. Investments shift to mono-material PE films engineered for recyclability, while multi-layer nylon structures migrate to high-barrier paper. Metal packaging maintains demand as beverage makers lock in alloy cans to meet infinitely recyclable claims. Overall, material selection now balances cost, circularity metrics, and regulatory exposure more than basic performance.
Paper and paperboard products commanded 28.70% of the US packaging market share in 2025 due to high corrugated volumes. Metal products are forecast to grow at a 6.64% CAGR as carbonated soft drinks and hard seltzers choose aluminum cans for lightweighting and recycling benefits. Crown Holdings' beverage can income rose 17% in 2024, underscoring secular demand. Silgan's 50% hold on metal food cans shows the resilience of shelf-stable products.
Digital print adoption empowers converters to serve seasonal SKU spikes, while rigid plastics such as HDPE jugs retain grocery loyalty for value packs. Yet metal's infinite-recycle narrative resonates with climate-conscious shoppers, shifting promotional budgets toward can-centric formats. Price swings in LME aluminum could temper volume gains, but brand owners hedge through multiyear take-or-pay deals, stabilizing orders for can-makers.
The United States Packaging Market Report is Segmented by Material Type (Paper and Paperboard, Plastic, Metal, and Container Glass), Product Type (Paper and Paperboard Product Type, Plastic Product Type, and More), Packaging Format (Rigid Packaging Format, and Flexible Packaging Format), and End-User (Food, Beverage, Personal Care and Cosmetics, and More), and Geography. The Market Forecasts are Provided in Terms of Value (USD).
List of Companies Covered in this Report:
- Amcor plc
- Sealed Air Corporation
- Ball Corporation
- Crown Holdings, Inc.
- Sonoco Products Company
- American Packaging Corporation
- International Paper Company
- Graphic Packaging Holding Company
- Novolex Holdings, LLC
- ProAmpac Holdings Inc.
- Silgan Holdings Inc.
- AptarGroup, Inc.
- Huhtamaki Oyj
- Printpack, Inc.
- Packaging Corporation of America
- CCL Industries Inc.
- Ardagh Group S.A.
- Smurfit WestRock plc
- Mondi plc
Additional Benefits:
- The market estimate (ME) sheet in Excel format
- 3 months of analyst support
TABLE OF CONTENTS
1 INTRODUCTION
- 1.1 Study Assumptions and Market Definition
- 1.2 Scope of the Study
2 RESEARCH METHODOLOGY
3 EXECUTIVE SUMMARY
4 MARKET LANDSCAPE
- 4.1 Market Overview
- 4.2 Market Drivers
- 4.2.1 E-commerce boom driving small-parcel packaging demand
- 4.2.2 Premiumisation in food and beverage accelerating demand for high-barrier flexibles
- 4.2.3 On-shoring of pharmaceutical fill-finish capacity boosting sterile packaging
- 4.2.4 Automation-ready secondary packaging lines at CPGs
- 4.2.5 Retail media networks favouring shelf-ready formats
- 4.2.6 USDA and DOE grants for biopolymer pilot plants (under-the-radar)
- 4.3 Market Restraints
- 4.3.1 California's SB-54 "Extended Producer Responsibility" cost pass-through
- 4.3.2 PFAS-free mandates raising formulation costs
- 4.3.3 2028-2029 PE and PP cracker capacity overhang depressing converter margins (under-reported)
- 4.3.4 Rising freight rates on corrugated due to chassis shortages (under-reported)
- 4.4 Industry Supply Chain Analysis
- 4.5 Regulatory Landscape
- 4.6 Technological Outlook
- 4.7 Porter's Five Forces Analysis
- 4.7.1 Bargaining Power of Suppliers
- 4.7.2 Bargaining Power of Consumers
- 4.7.3 Threat of New Entrants
- 4.7.4 Threat of Substitutes
- 4.7.5 Intensity of Competitive Rivalry
5 MARKET SIZE AND GROWTH FORECASTS (VALUE)
- 5.1 By Material Type
- 5.1.1 Paper and Paperboard
- 5.1.2 Plastic
- 5.1.2.1 Polyethylene Polypropylene (PP)
- 5.1.2.2 High-density Polyethylene (HDPE) and Low-density Polyethylene (LDPE)
- 5.1.2.3 Polyethylene Terephthalate (PET)
- 5.1.2.4 Polyvinyl Chloride (PVC)
- 5.1.2.5 Polystyrene (PS)
- 5.1.2.6 Other Plastics
- 5.1.3 Metal
- 5.1.4 Container Glass
- 5.2 By Product Type
- 5.2.1 Paper and Paperboard Product Type
- 5.2.1.1 Folding Carton and Rigid Boxes
- 5.2.1.2 Corrugated Boxes and Containers
- 5.2.1.3 Single-use Paper Products
- 5.2.1.4 Other Paper and Paperboard Product Types
- 5.2.2 Plastic Product Type
- 5.2.2.1 Rigid Plastics
- 5.2.2.1.1 Bottles and Jars
- 5.2.2.1.2 Caps and Closures
- 5.2.2.1.3 Bulk-Grade Products
- 5.2.2.1.4 Other Rigid Plastics Product Types
- 5.2.2.2 Flexible Plastics
- 5.2.2.2.1 Pouches
- 5.2.2.2.2 Bags
- 5.2.2.2.3 Films and Wraps
- 5.2.2.2.4 Other Flexible Plastics Product Types
- 5.2.2.1 Rigid Plastics
- 5.2.3 Metal Product Type
- 5.2.3.1 Cans
- 5.2.3.2 Caps and Closures
- 5.2.3.3 Aerosol Containers
- 5.2.3.4 Other Metal Product Types
- 5.2.4 Container Glass Product Type
- 5.2.4.1 Bottles
- 5.2.4.2 Jars
- 5.2.1 Paper and Paperboard Product Type
- 5.3 By Packaging Format
- 5.3.1 Rigid Packaging Format
- 5.3.2 Flexible Packaging Format
- 5.4 By End-user
- 5.4.1 Food
- 5.4.2 Beverage
- 5.4.3 Pharmaceutical and Medical
- 5.4.4 Personal Care and Cosmetics
- 5.4.5 Industrial and Chemical
- 5.4.6 Agriculture
- 5.4.7 Automotive
- 5.4.8 Other End-users
6 COMPETITIVE LANDSCAPE
- 6.1 Market Concentration
- 6.2 Strategic Moves
- 6.3 Market Share Analysis
- 6.4 Company Profiles (includes Global level Overview, Market level overview, Core Segments, Financials as available, Strategic Information, Market Rank/Share for key companies, Products and Services, and Recent Developments)
- 6.4.1 Amcor plc
- 6.4.2 Sealed Air Corporation
- 6.4.3 Ball Corporation
- 6.4.4 Crown Holdings, Inc.
- 6.4.5 Sonoco Products Company
- 6.4.6 American Packaging Corporation
- 6.4.7 International Paper Company
- 6.4.8 Graphic Packaging Holding Company
- 6.4.9 Novolex Holdings, LLC
- 6.4.10 ProAmpac Holdings Inc.
- 6.4.11 Silgan Holdings Inc.
- 6.4.12 AptarGroup, Inc.
- 6.4.13 Huhtamaki Oyj
- 6.4.14 Printpack, Inc.
- 6.4.15 Packaging Corporation of America
- 6.4.16 CCL Industries Inc.
- 6.4.17 Ardagh Group S.A.
- 6.4.18 Smurfit WestRock plc
- 6.4.19 Mondi plc
7 MARKET OPPORTUNITIES AND FUTURE OUTLOOK
- 7.1 White-space and Unmet-Need Assessment
 濕度控制包裝市場預測至2034年-按產品類型、材料、包裝形式、通路、最終用戶和地區分類的全球分析
 感官包裝市場:依技術、材料、感測器類型、包裝形式和應用分類-2026-2032年全球市場預測
 2026年全球包裝與標籤服務市場報告氣泡膜市場:2026-2032年全球市場預測(依材料、厚度、應用、最終用戶及通路分類)復古包裝市場:按材料、類型、最終用途、印刷技術和通路-2026-2032年全球預測紙質復古包裝市場:依材料、包裝類型、銷售管道、最終用戶、應用程式分類,全球預測(2026-2032)多功能零件市場按產品類型、價格範圍、應用、垂直產業和分銷管道分類,全球預測(2026-2032年)紙塑包裝器材市場:依機器類型、材料、操作類型和應用分類,全球預測(2026-2032年)
 航太級包裝市場規模、佔有率、成長、產業分析,依材料、應用及區域預測 (~2034年)全球電子順磁共振波譜儀市場(按產品類型、頻率、工作模式、組件、應用和最終用戶分類)預測(2026-2032年)