


 |
市場調查報告書
商品編碼
1910920
保險分析:市場佔有率分析、產業趨勢與統計、成長預測(2026-2031)Insurance Analytics - Market Share Analysis, Industry Trends & Statistics, Growth Forecasts (2026 - 2031) |
||||||
※ 本網頁內容可能與最新版本有所差異。詳細情況請與我們聯繫。
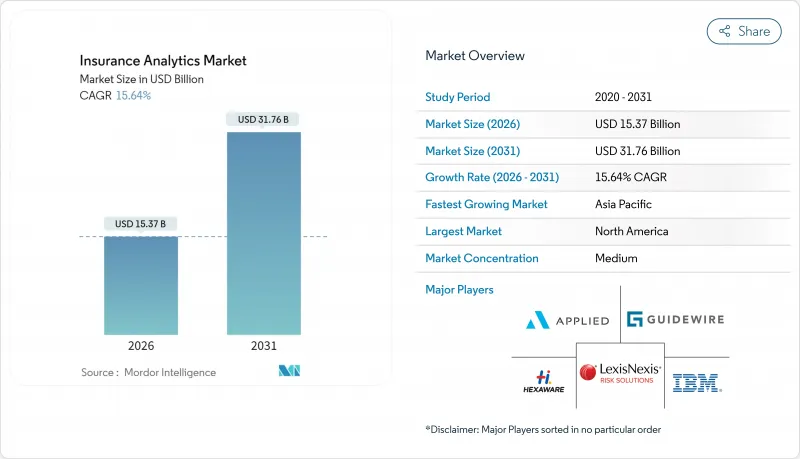
預計保險分析市場將從 2025 年的 132.9 億美元成長到 2026 年的 153.7 億美元,到 2031 年將達到 317.6 億美元,2026 年至 2031 年的複合年成長率為 15.64%。
市場成長的促進因素包括:監管機構對即時償付能力報告的要求日益提高、物聯網設備資料流的快速成長,以及保險公司簡化承保和理賠流程的需求。對氣候風險量化需求的增加、嵌入式保險夥伴關係的興起以及雲端工具的廣泛應用,正在推動各種規模的公司採用人工智慧技術。現有技術供應商正尋求透過將生成式人工智慧直接嵌入核心系統來鞏固市場佔有率,而新興的參與企業則在詐欺預防、參數保險和健康型人壽保險承保等細分分析領域拓展業務。儘管持續的資料隱私法規和精算資料科學人才的短缺限制了市場成長,但保險分析市場仍然受益於人工智慧管治框架監管的清晰化,尤其是在北美和歐盟地區。
全球保險分析市場趨勢與洞察
先進技術的應用日益普及
2024年,保險公司加速採用人工智慧技術,其中88%的汽車保險公司、70%的住宅保險公司和58%的人壽保險公司都轉向了人工智慧驅動的營運。 IBM等供應商正在將產生模型融入核保和理賠工作流程,以實現理賠評估和最優提案的自動化。雲端優先平台現在整合了電腦視覺、圖論和大規模語言模型功能,可以處理非結構化圖像、文字和感測器資料流,並將其轉換為即時風險評分。從美國保險監督官協會(NAIC)到歐洲保險和職業退休金管理局(EIOPA)等監管機構都已表示,如果公司能夠證明其公平性、透明度和董事會監督,他們將接受人工智慧的使用。因此,企業在人工智慧基礎設施方面的支出激增,進一步推動了保險分析市場的發展。
保險公司之間的競爭日益加劇
憑藉人工智慧定價引擎的純數位化新興企業不斷擠壓現有保險公司的利潤空間,迫使傳統保險公司縮短產品週期並實現保險個人化。創業投資已轉向全端式保險科技公司,這些公司利用即時資料擷取提供超短期和點對點保險產品。現有保險公司正透過收購和策略合作來應對,加速現代化進程,同時確保跨通路資料可見度。日益激烈的競爭正促使經營團隊將工作重點從通路擴張轉向分析差異化,加速模組化風險評分API和雲端原生資料架構的需求。
嚴格的資料隱私和管治法規
歐盟人工智慧法規和GDPR將許多保險分析功能歸類為高風險,要求進行可解釋性評估、資料集文件編制和實施後監控。美國各州類似的監管規定要求保險公司提交風險管理模型認證,這延長了計劃週期並增加了合規預算。跨國保險公司必須協調不同司法管轄區的管控措施,這推高了無法自動進行資料沿襲和偏差檢測的分析平台的總體擁有成本。這些合規負擔正在減緩分析平台的普及,尤其是在中小企業中,導致預期複合年成長率下降2.1個百分點。
細分市場分析
到2025年,工具類產品將佔保險分析市場規模的90.1億美元(67.79%),反映出保險公司優先考慮對其數據資產保持策略控制權。服務類產品雖然規模較小,但正以14.6%的複合年成長率成長,這主要得益於保險公司尋求人工智慧管治框架和多重雲端最佳化的專家指導。儘管供應商正在整合低程式碼模型管理儀表板和預先建置的風險庫,但保險公司仍依賴系統整合商將這些功能改造到原有的核心系統中。向基於績效的定價模式(即與賠付率改善掛鉤的諮詢費收費系統)的轉變,進一步推動了服務類產品的成長。
擁有不同保單管理系統的公司傾向於選擇資料策略研討會、模型檢驗練習和監管報告自動化等服務,以避免高成本的平台重構;而規模較小的公司則喜歡提供內建指導的打包分析套件。這凸顯了保險分析市場互補而非競爭的結構。
至2025年,理賠管理領域將佔保險分析市場的34.12%,其核心是直通式處理引擎,可提高負責人的工作效率和顧客滿意度。然而,隨著保險公司部署異常檢測網路,在幾秒鐘內識別可疑理賠,從而將損失成本降低兩位數百分比,欺詐檢測解決方案預計將以18.95%的複合年成長率成長。整合的影像取證和行為分析模組將進一步縮短調查週期,並為財務領導者帶來令人信服的投資報酬率 (ROI) 數據。
成長動力也將來自以API為先導的詐欺偵測平台,這些平台能夠與第三方資料仲介無縫整合,無需大規模內部工程即可增強風險訊號。在預測期內,基於機器學習的詐欺偵測工具將從先導計畫走向企業標準,隨著監管機構強制要求採取反詐欺措施,這將重塑保險分析市場格局。
保險分析市場報告按組件(工具和服務)、業務應用(理賠管理、風險管理等)、部署模式(本地部署、雲端部署)、最終用戶(保險公司等)、保險類型(人壽保險和健康保險、產物保險等)、組織規模(大型企業、中小企業等)和地區對行業進行細分。市場預測以以金額為準。
區域分析
預計到2025年,北美將以38.02%的收入佔有率領先保險分析市場。這主要得益於強勁的雲端運算應用、雄厚的資本市場以及美國保險監理協會(NAIC)的人工智慧模型指令。該指令明確了監管方向,並加快了技術投資決策。美國保險公司受惠於成熟的保險科技資金籌措管道和便利的專業數據供應商資源,而加拿大公司則利用跨境技術夥伴關係,在無需相應增加員工人數的情況下擴展其分析能力。
亞太地區預計到2031年將以16.25%的複合年成長率成長,主要得益於中國、印度和東南亞地區數位保險滲透率的加速提升。該地區現有超大規模資料中心業者正與超大規模資料中心合作,快速推出按里程付費的汽車保險和短期旅遊保險,這兩種保險都依賴即時數據收集。新加坡和韓國政府透過提供監管沙盒和鼓勵產品試驗,為保險分析市場的發展創造了良好的環境。
儘管受到GDPR和歐盟人工智慧法規的嚴格合規要求約束,歐洲仍維持均衡成長。德國、法國和英國的保險公司正大力投資可解釋人工智慧工具,以滿足監管要求並從中提取洞察,用於承保分析。北歐保險公司在分析領域處於領先地位,正在試行氣候情境生成工具和嵌入式保險編配層,這些工具和層有望在歐洲範圍內廣泛應用。
其他福利:
- Excel格式的市場預測(ME)表
- 3個月的分析師支持
目錄
第1章 引言
- 研究假設和市場定義
- 調查範圍
第2章調查方法
第3章執行摘要
第4章 市場洞察
- 市場概覽
- 市場促進因素
- 先進技術的應用日益普及
- 保險公司之間的競爭日益加劇
- 內部和外部資料流的數量不斷成長
- 需要對氣候風險進行量化。
- 擴展嵌入式保險生態系統
- 監理機關推動即時償付能力報告
- 市場限制
- 嚴格的資料隱私和管治法規
- 網路安全和資料外洩問題日益令人擔憂
- 精算資料科學人才短缺
- 供應商鎖定和資料可攜性限制
- 價值鏈分析
- 監管環境
- 技術展望
- 波特五力模型
- 供應商的議價能力
- 買方的議價能力
- 新進入者的威脅
- 替代品的威脅
- 競爭對手之間的競爭
- 產業生態系分析
- 主要用例和案例研究
- 宏觀經濟趨勢評估
- 投資分析
第5章 市場區隔
- 按組件
- 工具
- 服務
- 透過業務應用
- 索賠管理
- 風險管理
- 詐欺檢測與預防
- 流程最佳化
- 客戶管理與個人化
- 透過部署模式
- 本地部署
- 雲
- 最終用戶
- 保險公司
- 政府機構
- 第三方管理機構、仲介和顧問公司
- 按保險類型
- 人壽保險和醫療保險
- 產物保險
- 車
- 專業
- 按組織規模
- 主要企業
- 中小企業
- 按地區
- 北美洲
- 美國
- 加拿大
- 墨西哥
- 南美洲
- 巴西
- 阿根廷
- 哥倫比亞
- 南美洲其他地區
- 歐洲
- 德國
- 英國
- 法國
- 義大利
- 西班牙
- 俄羅斯
- 荷蘭
- 其他歐洲地區
- 亞太地區
- 中國
- 日本
- 韓國
- 印度
- 澳洲
- 新加坡
- 亞太其他地區
- 中東和非洲
- 中東
- 沙烏地阿拉伯
- 阿拉伯聯合大公國
- 其他中東地區
- 非洲
- 南非
- 埃及
- 其他非洲地區
- 中東
- 北美洲
第6章 競爭情勢
- 市場集中度
- 策略趨勢
- 市佔率分析
- 公司簡介
- IBM Corporation
- Oracle Corporation
- SAP SE
- SAS Institute Inc.
- Microsoft Corporation
- Guidewire Software Inc.
- LexisNexis Risk Solutions(RELX plc)
- Hexaware Technologies Ltd.
- Applied Systems Inc.
- Sapiens International Corporation NV
- OpenText Corporation
- MicroStrategy Incorporated
- Verisk Analytics, Inc.
- Salesforce, Inc.(Tableau)
- Accenture plc
- Cognizant Technology Solutions Corp.
- BAE Systems plc
- Palantir Technologies Inc.
- Fair Isaac Corporation(FICO)
- DataRobot, Inc.
- Optum, Inc.(UnitedHealth Group)
第7章 市場機會與未來展望
The insurance analytics market is expected to grow from USD 13.29 billion in 2025 to USD 15.37 billion in 2026 and is forecast to reach USD 31.76 billion by 2031 at 15.64% CAGR over 2026-2031.
Market expansion is underpinned by mounting regulatory demands for real-time solvency reporting, rapid data-stream proliferation from IoT devices, and insurers' need to streamline underwriting and claims workflows. Heightened climate-risk quantification requirements, rising embedded-insurance partnerships, and the democratization of cloud tools have widened adoption across organization sizes. Incumbent technology vendors are defending share by embedding generative AI directly into core systems, while insurtech entrants scale niche analytics that target fraud, parametric cover, and wellness-based life underwriting. Persistent data-privacy obligations and a tightening actuarial-data-science talent pool temper growth, yet the insurance analytics market continues to benefit from regulators clarifying AI governance frameworks, especially in North America and the European Union.
Global Insurance Analytics Market Trends and Insights
Increased Adoption of Advanced Technologies
Insurers accelerated AI deployment in 2024, with 88% of auto, 70% of home, and 58% of life carriers moving toward AI-enabled operations. Vendors such as IBM embedded generative models into underwriting and claims workflows, enabling automated damage assessment and next-best-offer recommendations . Cloud-first platforms now package computer-vision, graph, and large-language-model capabilities that handle unstructured image, text, and sensor streams, converting them into real-time risk scores. Regulatory bodies from the NAIC to EIOPA signaled acceptance of AI usage when firms document fairness, transparency, and board oversight. Consequently, enterprise spending on AI-ready infrastructure rose sharply, further fueling the insurance analytics market.
Rise in Competition Among Insurers
Digital-only challengers armed with AI pricing engines continue to pressure incumbent margins, forcing traditional carriers to shorten product cycles and personalize coverage. Venture capital funding shifted toward full-stack insurtechs that leverage real-time data ingestion to launch micro-duration or peer-to-peer products. Incumbents responded through acquisitions and strategic partnerships that fast-track modernization while securing cross-channel data visibility. Competitive intensity has reoriented C-suite priorities from channel expansion to analytical differentiation, accelerating demand for modular risk-scoring APIs and cloud-native data fabrics.
Stringent Data-Privacy and Governance Regulations
The EU AI Act and GDPR classify many insurance analytics functions as high risk, mandating explainability assessments, dataset documentation, and post-deployment monitoring. Similar rulemaking in U.S. states obliges carriers to file model-risk-management attestations, extending project timelines and compliance budgets. Multinational carriers must harmonize controls across jurisdictions, driving up the total cost of ownership for analytics platforms that cannot automate lineage logging or bias detection. These compliance burdens slow deployment, particularly for smaller firms, and subtract 2.1 percentage points from forecast CAGR.
Other drivers and restraints analyzed in the detailed report include:
- Growing Volume of Internal and External Data Streams
- Climate-Risk Quantification Demands
- High Concern Over Cybersecurity and Data Breaches
For complete list of drivers and restraints, kindly check the Table Of Contents.
Segment Analysis
Tools contributed USD 9.01 billion to the insurance analytics market size in 2025, equating to 67.79% share and reflecting carriers' preference for retaining strategic control of data assets. Services, although smaller, are scaling at 14.6% CAGR as insurers seek expert guidance for AI-governance frameworks and multi-cloud optimization. Vendors integrate low-code model-management dashboards and pre-built risk libraries, but carriers still rely on systems integrators to retrofit these capabilities into legacy cores. The push toward outcome-based pricing, where consultancy fees hinge on loss-ratio improvements, further underpins services growth.
Enterprises with heterogeneous policy-administration stacks often choose services to avoid costly platform rewrites, engaging providers for data-strategy workshops, model-validation exercises, and regulatory-filing automation. Meanwhile, SMEs favor packaged analytics suites that offer embedded guidance, illustrating how services and tools complement rather than cannibalize each other in the insurance analytics market.
Claims management held a 34.12% insurance analytics market share in 2025, anchored by straight-through-processing engines that boost adjuster productivity and customer satisfaction metrics. Yet fraud detection solutions are projected to scale at a 18.95% CAGR, as carriers deploy anomaly-detection networks that flag suspicious claims within seconds, helping to cut loss costs by double-digit percentages. Integrated image-forensics and behavioral-analytics modules further compress investigation cycles, driving ROI narratives that appeal to finance chiefs.
Growth momentum also arises from API-first fraud platforms that connect seamlessly with third-party data brokers, enriching risk signals without extensive in-house engineering. Over the forecast period, machine-learning-based fraud utilities will migrate from pilot projects to enterprise standards, reshaping the insurance analytics market as regulatory bodies mandate anti-fraud controls.
Insurance Analytics Market Report Segments the Industry Into by Component (Tools and Services), Business Application (Claims Management, Risk Management, and More), Deployment Mode (On-Premise, Cloud), End-User (Insurance Companies, and More), Insurance Line (Life and Health, Property and Casualty, and More), Organization Size (Large Enterprises, and SMEs), and Geography. The Market Forecasts are Provided in Terms of Value (USD).
Geography Analysis
North America led the insurance analytics market with 38.02% revenue share in 2025, buoyed by robust cloud adoption, deep capital markets, and the NAIC's AI Model Bulletin, which provides regulatory clarity and accelerates tech-investment decisions. U.S. carriers benefit from mature insurtech funding pipelines and ready access to specialized data vendors, while Canadian firms leverage cross-border technology partnerships to extend analytic capabilities without proportional head-count increases.
Asia-Pacific is projected to post a 16.25% CAGR through 2031, driven by accelerating digital-insurance penetration in China, India, and Southeast Asia. Regional incumbents collaborate with hyper-scalers to launch pay-as-you-drive auto cover and micro-duration travel policies, both reliant on real-time data ingestion. Governments in Singapore and South Korea provide regulatory sandboxes that stimulate product experimentation, thereby fostering a fertile environment for insurance analytics market expansion.
Europe maintains balanced growth despite stringent GDPR and EU AI Act compliance requirements. Carriers in Germany, France, and the United Kingdom invest heavily in explainable-AI tooling to satisfy regulators while unlocking underwriting insights. Nordic insurers act as analytics bellwethers, piloting climate-scenario generators and embedded-insurance orchestration layers that could shape wider continental adoption.
- IBM Corporation
- Oracle Corporation
- SAP SE
- SAS Institute Inc.
- Microsoft Corporation
- Guidewire Software Inc.
- LexisNexis Risk Solutions (RELX plc)
- Hexaware Technologies Ltd.
- Applied Systems Inc.
- Sapiens International Corporation N.V.
- OpenText Corporation
- MicroStrategy Incorporated
- Verisk Analytics, Inc.
- Salesforce, Inc. (Tableau)
- Accenture plc
- Cognizant Technology Solutions Corp.
- BAE Systems plc
- Palantir Technologies Inc.
- Fair Isaac Corporation (FICO)
- DataRobot, Inc.
- Optum, Inc. (UnitedHealth Group)
Additional Benefits:
- The market estimate (ME) sheet in Excel format
- 3 months of analyst support
TABLE OF CONTENTS
1 INTRODUCTION
- 1.1 Study Assumptions and Market Definition
- 1.2 Scope of the Study
2 RESEARCH METHODOLOGY
3 EXECUTIVE SUMMARY
4 MARKET INSIGHTS
- 4.1 Market Overview
- 4.2 Market Drivers
- 4.2.1 Increased adoption of advanced technologies
- 4.2.2 Rise in competition among insurers
- 4.2.3 Growing volume of internal and external data streams
- 4.2.4 Climate-risk quantification demands
- 4.2.5 Embedded-insurance ecosystem expansion
- 4.2.6 Regulatory push toward real-time solvency reporting
- 4.3 Market Restraints
- 4.3.1 Stringent data-privacy and governance regulations
- 4.3.2 High concern over cybersecurity and data breaches
- 4.3.3 Actuarial-data-science talent gap
- 4.3.4 Vendor lock-in and data-portability limitations
- 4.4 Value Chain Analysis
- 4.5 Regulatory Landscape
- 4.6 Technological Outlook
- 4.7 Porter's Five Forces
- 4.7.1 Bargaining Power of Suppliers
- 4.7.2 Bargaining Power of Buyers
- 4.7.3 Threat of New Entrants
- 4.7.4 Threat of Substitutes
- 4.7.5 Competitive Rivalry
- 4.8 Industry Ecosystem Analysis
- 4.9 Key Use Cases and Case Studies
- 4.10 Assessment of Macroeconomic Trends
- 4.11 Investment Analysis
5 MARKET SEGMENTATION
- 5.1 By Component
- 5.1.1 Tools
- 5.1.2 Services
- 5.2 By Business Application
- 5.2.1 Claims Management
- 5.2.2 Risk Management
- 5.2.3 Fraud Detection and Prevention
- 5.2.4 Process Optimization
- 5.2.5 Customer Management and Personalization
- 5.3 By Deployment Mode
- 5.3.1 On-Premise
- 5.3.2 Cloud
- 5.4 By End-User
- 5.4.1 Insurance Companies
- 5.4.2 Government Agencies
- 5.4.3 Third-Party Administrators, Brokers and Consultancies
- 5.5 By Insurance Line
- 5.5.1 Life and Health
- 5.5.2 Property and Casualty
- 5.5.3 Auto
- 5.5.4 Specialty Lines
- 5.6 By Organization Size
- 5.6.1 Large Enterprises
- 5.6.2 Small and Medium Enterprises (SMEs)
- 5.7 By Geography
- 5.7.1 North America
- 5.7.1.1 United States
- 5.7.1.2 Canada
- 5.7.1.3 Mexico
- 5.7.2 South America
- 5.7.2.1 Brazil
- 5.7.2.2 Argentina
- 5.7.2.3 Colombia
- 5.7.2.4 Rest of South America
- 5.7.3 Europe
- 5.7.3.1 Germany
- 5.7.3.2 United Kingdom
- 5.7.3.3 France
- 5.7.3.4 Italy
- 5.7.3.5 Spain
- 5.7.3.6 Russia
- 5.7.3.7 Netherlands
- 5.7.3.8 Rest of Europe
- 5.7.4 Asia-Pacific
- 5.7.4.1 China
- 5.7.4.2 Japan
- 5.7.4.3 South Korea
- 5.7.4.4 India
- 5.7.4.5 Australia
- 5.7.4.6 Singapore
- 5.7.4.7 Rest of Asia-Pacific
- 5.7.5 Middle East and Africa
- 5.7.5.1 Middle East
- 5.7.5.1.1 Saudi Arabia
- 5.7.5.1.2 United Arab Emirates
- 5.7.5.1.3 Rest of Middle East
- 5.7.5.2 Africa
- 5.7.5.2.1 South Africa
- 5.7.5.2.2 Egypt
- 5.7.5.2.3 Rest of Africa
- 5.7.5.1 Middle East
- 5.7.1 North America
6 COMPETITIVE LANDSCAPE
- 6.1 Market Concentration
- 6.2 Strategic Moves
- 6.3 Market Share Analysis
- 6.4 Company Profiles (includes Global level Overview, Market level overview, Core Segments, Financials as available, Strategic Information, Market Rank/Share for key companies, Products and Services, and Recent Developments)
- 6.4.1 IBM Corporation
- 6.4.2 Oracle Corporation
- 6.4.3 SAP SE
- 6.4.4 SAS Institute Inc.
- 6.4.5 Microsoft Corporation
- 6.4.6 Guidewire Software Inc.
- 6.4.7 LexisNexis Risk Solutions (RELX plc)
- 6.4.8 Hexaware Technologies Ltd.
- 6.4.9 Applied Systems Inc.
- 6.4.10 Sapiens International Corporation N.V.
- 6.4.11 OpenText Corporation
- 6.4.12 MicroStrategy Incorporated
- 6.4.13 Verisk Analytics, Inc.
- 6.4.14 Salesforce, Inc. (Tableau)
- 6.4.15 Accenture plc
- 6.4.16 Cognizant Technology Solutions Corp.
- 6.4.17 BAE Systems plc
- 6.4.18 Palantir Technologies Inc.
- 6.4.19 Fair Isaac Corporation (FICO)
- 6.4.20 DataRobot, Inc.
- 6.4.21 Optum, Inc. (UnitedHealth Group)
7 MARKET OPPORTUNITIES AND FUTURE OUTLOOK
- 7.1 White-space and Unmet-Need Assessment
 保險分析市場報告:按組件、部署類型、企業規模、應用程式、最終用戶和地區分類(2026-2034 年)
 2026年全球保險分析市場報告
 保險分析市場分析及預測(至 2035 年):按類型、產品、服務、技術、組件、應用、部署、最終用戶和解決方案分類
 全球保險分析市場:市場規模、佔有率、成長率、產業分析、依類型、應用和地區劃分的分析及預測(2026-2034年)
 保險分析市場規模、佔有率和趨勢分析報告:按組件、應用、部署、公司規模、最終用途、地區和細分市場預測,2026-2033 年日本保險分析市場報告(按組件、部署模式、企業規模、應用、最終用戶和地區分類,2026-2034 年)
 保險分析市場規模、佔有率和成長分析(按部署模式、組件、應用、最終用戶和地區分類)-2026-2033年產業預測
 全球保險分析市場(按保險類型、用例、部署模式、組織規模和最終用戶分類)—2025-2032年全球預測
 2025-2029年全球保險分析市場
 全球保險分析市場:依組件、部署模式、應用、最終用戶、地區、機會及預測,2018-2032