


 |
市場調查報告書
商品編碼
1910808
熱解油:市場佔有率分析、產業趨勢與統計、成長預測(2026-2031)Pyrolysis Oil - Market Share Analysis, Industry Trends & Statistics, Growth Forecasts (2026 - 2031) |
||||||
※ 本網頁內容可能與最新版本有所差異。詳細情況請與我們聯繫。
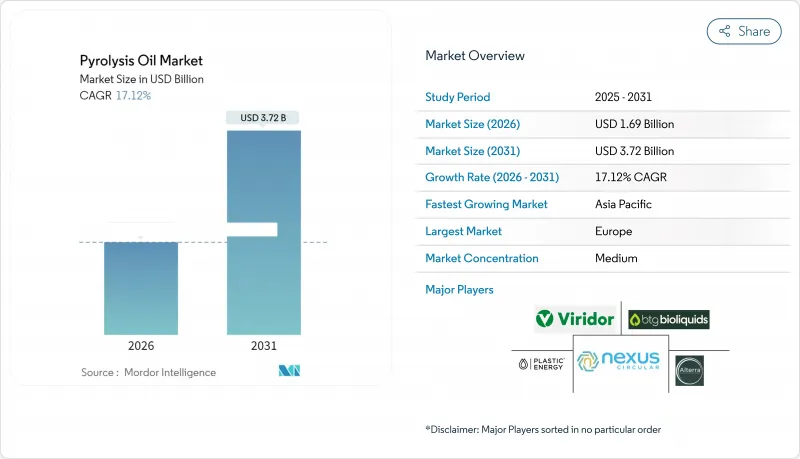
2025 年熱解油市場價值為 14.4 億美元,預計從 2026 年的 16.9 億美元成長到 2031 年的 37.2 億美元,在預測期(2026-2031 年)內複合年成長率為 17.12%。
更嚴格的塑膠廢棄物法規、循環經濟政策以及煉油廠共加工技術的進步正在加速需求成長,而慷慨的碳權計畫則改善了工廠的經濟效益。來自歐洲創新基金和日本新能源產業技術綜合開發機構(NEDO)的策略性資金支持產能擴張,使競爭格局向政策環境有利的地區傾斜。生產商正尋求與煉油廠進行垂直整合,以降低資本支出並確保銷售保障。同時,技術授權公司正競相將微波輔助和超臨界製程等能夠提高產量和減少排放的製程商業化。然而,隨著以規格為導向的客戶收緊容差限值,污染物控制,特別是多環芳烴(PAHs)的控制,仍然是一項重大的營運挑戰。
全球熱解油市場趨勢與洞察
對可再生和循環燃料替代品的需求不斷成長
加州的低碳燃料標準(LCFS)旨在2030年將碳排放強度降低30%,並頒發高價值的碳權額度,使廢棄物衍生的熱解油能夠與石油原料競爭。加拿大的無污染燃料法規設定了15%的減排目標,並提供15億美元的資金用於國內生產,提振了北美市場的需求。同時,日本的塑膠資源循環策略和美國的永續航空燃料稅額扣抵熱解油定位為一種具有直接經濟效益的合格原料。這些措施正在將廢棄油從環境負擔轉變為一種合規的脫碳商品。
加強全球對塑膠廢棄物的監管和禁令
歐洲到2030年實現包裝100%回收的強制性要求,以及中國到2025年回收40億噸固態廢棄物的目標,正以指數級速度推動對機械回收以外加工方式的需求成長。加拿大將於2025年9月生效的聯邦塑膠登記制度,將為原料建立透明的追蹤系統,有利於具備品質認證能力的先進設施。印尼30%的廢棄物減量目標也將進一步拓寬原料來源。這些監管趨勢將確保原料供應的長期穩定,並鼓勵對高效熱解技術的投資。
儲存和運輸過程中的腐蝕性和不穩定性
輪胎衍生油通常含有10%或以上的多環芳烴,例如苯並[a]芘,因此需要使用不鏽鋼或內襯儲罐,並進行惰性氣體吹掃,從而推高了物流成本。混合塑膠油的硫、氧和氯化物含量較高,如果不進行預處理,會污染煉油催化劑。生產後的持續反應會導致其在長途運輸過程中黏度和酸度發生變化,因此需要添加穩定劑並進行溫度控制。這些技術難題限制了跨境貿易,阻礙了標準化進程,延緩了其在全球的推廣應用。
細分市場分析
到2025年,廢棄塑膠將佔熱解油市場佔有率的55.02%,預計到2031年,該細分市場將以18.92%的複合年成長率成長。由於全球塑膠廢棄物每年超過3.8億噸,而機械回收率卻停滯在10%以下,因此,以廢棄塑膠為原料的熱解油市場規模預計也將擴大。
混合塑膠加工技術的進步,例如Resonac公司60%以上的產率技術以及聚丙烯與生質能的協同共熱解技術,簡化了原料製備流程並降低了分類成本。廢舊輪胎作為第二大主要原料,雖然受益於有序的收集,但其多環芳烴(PAH)污染程度較高,導致價格折扣。生質能原料在脫氧方面面臨挑戰,且需要高成本的加氫處理,限制了即時擴大生產規模。精煉原料中氯化物和硫含量的嚴格監管推動了對高純度塑膠油的需求,從而在整個原料市場中催生了一個高階細分市場。
《熱解油報告》按原料(廢棄塑膠、廢輪胎、生質能及其他)、應用(燃料和化學品)以及地區(亞太地區、北美地區、歐洲地區、南美地區以及中東和非洲地區)進行細分。市場預測以美元以金額為準。
區域分析
在政策明確和專案資金籌措來源的支持下,歐洲在 2025 年佔全球銷售量的 35.74%。該地區擁有利安德巴塞爾公司年產能 5 萬噸的韋瑟林工廠和 OMV 公司年產能 16,000 噸的 ReOil 工廠,這兩家工廠都提供可擴展的生產能力,並且與焚燒相比,碳足跡更低。
亞太地區是成長最快的市場,複合年成長率高達22.98%,這主要得益於日本新能源產業技術綜合開發機構(NEDO)的資金支持、中國40億噸廢棄物利用目標,以及諸如茨城縣ENEOS-三菱化學水熱發電廠等開創性計劃。東南亞地區也緊跟其後,印尼合作夥伴JGC和丸紅株式會社正在評估模組化的Pyro-Blue系統,以應對日益嚴重的海洋塑膠污染問題。
在北美,長期供應協議和健全的低碳燃料標準(LCFS)積分系統正在推動潛在成長。陶氏化學與Freepoint的供應協議為其位於亞利桑那州的年產能18萬噸的生產基地提供支持;而Nova Chemicals正在安大略省採用Plastic Energy的Tacoil工藝,新增年產能6.6萬噸,這有助於該公司實現到2030年產品中再生材料含量達到30%的目標。
其他福利:
- Excel格式的市場預測(ME)表
- 分析師支持(3個月)
目錄
第1章 引言
- 研究假設和市場定義
- 調查範圍
第2章調查方法
第3章執行摘要
第4章 市場情勢
- 市場概覽
- 市場促進因素
- 對可再生和循環燃料替代品的需求不斷成長
- 加強全球塑膠廢棄物的監管和禁令
- 化學回收投資項目正在增加
- FCC/加氫處理聯合供應可降低煉油廠資本支出
- 低碳熱解油的排碳權貨幣化
- 市場限制
- 儲存和運輸過程中的腐蝕性和不穩定性
- 高額資本投入與規模擴張風險
- 對多環芳烴(PAHs)和污染物的擔憂導致監管延誤
- 價值鏈分析
- 波特五力模型
- 供應商的議價能力
- 買方的議價能力
- 新進入者的威脅
- 替代產品和服務的威脅
- 競爭程度
第5章 市場規模與成長預測
- 按原料
- 廢棄塑膠
- 廢輪胎
- 生質能
- 其他
- 透過使用
- 燃料
- 化學品
- 按地區
- 亞太地區
- 中國
- 印度
- 日本
- 韓國
- 馬來西亞
- 泰國
- 印尼
- 越南
- 亞太其他地區
- 北美洲
- 美國
- 加拿大
- 墨西哥
- 歐洲
- 德國
- 英國
- 法國
- 義大利
- 西班牙
- 北歐國家
- 土耳其
- 俄羅斯
- 其他歐洲地區
- 南美洲
- 巴西
- 阿根廷
- 哥倫比亞
- 南美洲其他地區
- 中東和非洲
- 沙烏地阿拉伯
- 南非
- 奈及利亞
- 卡達
- 埃及
- 阿拉伯聯合大公國
- 摩洛哥
- 其他中東和非洲地區
- 亞太地區
第6章 競爭情勢
- 市場集中度
- 策略趨勢
- 市佔率(%)/排名分析
- 公司簡介
- Agilyx
- Alterra Energy, LLC
- Arbios Biotech
- Bioenergy AE Cote-Nord
- BTG Bioliquids(Green Fuel Nordic Oy)
- Kerry Group plc
- New Energy Kft.
- New Hope Energy
- Nexus Circular
- Plastic Energy
- Pyrocell(Setra)
- Scandinavian Enviro Systems AB
- Trident Fuels pty ltd
- Twence
- Viridor Limited
第7章 市場機會與未來展望
The Pyrolysis Oil Market was valued at USD 1.44 billion in 2025 and estimated to grow from USD 1.69 billion in 2026 to reach USD 3.72 billion by 2031, at a CAGR of 17.12% during the forecast period (2026-2031).
Heightened plastic-waste regulations, circular-economy mandates and refinery co-processing breakthroughs together accelerate demand, while generous carbon-credit schemes improve plant economics. Strategic funding from Europe's Innovation Fund and Japan's NEDO program underpins capacity additions that shift the competitive balance toward regions with supportive policy ecosystems. Producers pursue vertical integration with refiners to reduce capital outlays and secure guaranteed offtake, and technology licensors are racing to commercialize microwave-assisted or supercritical routes that improve yield and cut emissions. At the same time, contaminant management, particularly for polycyclic aromatic hydrocarbons, remains the key operational hurdle as specification-driven customers tighten acceptance limits.
Global Pyrolysis Oil Market Trends and Insights
Rising Demand for Renewable and Circular Fuel Substitutes
California's Low Carbon Fuel Standard now targets a 30% carbon-intensity cut by 2030, issuing high-value credits that make waste-derived pyrolysis oil competitive with petroleum inputs. Canada's Clean Fuel Regulations set a 15% reduction goal and earmark USD 1.5 billion for domestic production, reinforcing North American demand. In parallel, Japan's plastics resource-circulation strategy and U.S. sustainable aviation-fuel tax credits position pyrolysis oil as a qualifying feedstock with direct financial upside. Together these measures transform waste oil from an environmental liability into a compliance-grade decarbonization commodity.
Stricter Plastic-Waste Regulations and Bans Worldwide
Europe's mandate for 100% recyclable packaging by 2030 and China's push to recycle 4 billion tons of bulk solid waste by 2025 sharply raise demand for processing routes beyond mechanical recycling. Canada's Federal Plastics Registry, effective September 2025, adds transparent feedstock tracking that favors advanced facilities capable of quality certification. Indonesia's 30% waste-reduction target further broadens the raw-material pool. These regulatory forces provide predictable long-term feedstock streams and catalyze investments in high-efficiency thermal decomposition.
Corrosivity and Instability During Storage/Transport
Tire-derived oils often contain more than 10% polycyclic aromatic hydrocarbons such as benzo[a]pyrene, requiring stainless or lined tanks and inert-gas blanketing, which inflate logistics costs. Mixed-plastic oils exhibit elevated sulfur, oxygen and chloride levels that foul refinery catalysts unless pre-treated. Ongoing post-production reactions alter viscosity and acidity during long-haul shipment, demanding stabilizers and temperature control. These technical complications restrict cross-border trade and limit standardization, slowing global adoption.
Other drivers and restraints analyzed in the detailed report include:
- FCC/Hydro-Processing Co-Feeding Lowers Refinery CAPEX
- Carbon-Credit Monetization for Low-Carbon Pyrolysis Oil
- PAH/Contaminant Concerns Triggering Regulatory Delays
For complete list of drivers and restraints, kindly check the Table Of Contents.
Segment Analysis
Waste plastics held 55.02% of the pyrolysis oil market share in 2025, and the segment is tracking a 18.92% CAGR through 2031. The pyrolysis oil market size attributable to waste-plastic feedstock is projected to rise in tandem as global plastic waste exceeds 380 million t y while mechanical recycling stalls below 10% recovery.
Advances in mixed-plastic processing, such as Resonac's more than or equal to 60% yield technology and synergistic co-pyrolysis of polypropylene with biomass, simplify feed preparation and cut sorting costs. Tire waste, the second-largest input group, benefits from well-organized collection but suffers from higher PAH contamination that commands price discounts. Biomass streams face oxygen-removal challenges that require costly hydrotreatment, limiting immediate scale-up. As regulators tighten chloride and sulfur limits for refinery feed, demand is rising for high-purity plastic oils, creating a premium segment within overall feedstock markets.
The Pyrolysis Oil Report is Segmented by Raw Material (Waste Plastics, Waste Tires, Biomass, and Others), Application (Fuels and Chemicals), and Geography (Asia-Pacific, North America, Europe, South America, and Middle-East and Africa). The Market Forecasts are Provided in Terms of Value (USD).
Geography Analysis
Europe accounted for 35.74% of global sales in 2025, underpinned by policy clarity and dedicated funding streams. The region hosts LyondellBasell's 50,000 tons per year Wesseling unit and OMV's 16,000 tons per year ReOil plant, both demonstrating scalable output with lower carbon footprints versus incineration.
Asia-Pacific is the fastest-growing market at a 22.98% CAGR, fueled by Japan's NEDO funding, China's 4 billion-t waste-utilization target and breakthrough projects such as ENEOS-Mitsubishi Chemical's hydrothermal plant in Ibaraki. Southeast Asia is following suit, with Indonesian partners JGC and Marubeni evaluating modular Pyro-Blue systems to tackle rising marine-plastic inflows.
North America shows accelerating potential through long-term offtake contracts and robust LCFS credit structures. Dow's supply deal with Freepoint anchors a 180,000 tons per year Arizona complex, and NOVA Chemicals will add 66,000 tons per year of capacity in Ontario using Plastic Energy's Tacoil process, supporting its 30% recycled content pledge by 2030.
- Agilyx
- Alterra Energy, LLC
- Arbios Biotech
- Bioenergy AE Cote-Nord
- BTG Bioliquids (Green Fuel Nordic Oy)
- Kerry Group plc
- New Energy Kft.
- New Hope Energy
- Nexus Circular
- Plastic Energy
- Pyrocell (Setra)
- Scandinavian Enviro Systems AB
- Trident Fuels pty ltd
- Twence
- Viridor Limited
Additional Benefits:
- The market estimate (ME) sheet in Excel format
- 3 months of analyst support
TABLE OF CONTENTS
1 Introduction
- 1.1 Study Assumptions and Market Definition
- 1.2 Scope of the Study
2 Research Methodology
3 Executive Summary
4 Market Landscape
- 4.1 Market Overview
- 4.2 Market Drivers
- 4.2.1 Rising demand for renewable and circular fuel substitutes
- 4.2.2 Stricter plastic-waste regulations and bans worldwide
- 4.2.3 Rising chemical-recycling investment pipelines
- 4.2.4 FCC / hydro-processing co-feeding lowers refinery CAPEX
- 4.2.5 Carbon-credit monetisation for low-carbon pyrolysis oil
- 4.3 Market Restraints
- 4.3.1 Corrosivity and instability during storage/transport
- 4.3.2 High CAPEX and scale-up execution risk
- 4.3.3 PAH/contaminant concerns triggering regulatory delays
- 4.4 Value Chain Analysis
- 4.5 Porter's Five Forces
- 4.5.1 Bargaining Power of Suppliers
- 4.5.2 Bargaining Power of Buyers
- 4.5.3 Threat of New Entrants
- 4.5.4 Threat of Substitute Products and Services
- 4.5.5 Degree of Competition
5 Market Size and Growth Forecasts (Value)
- 5.1 By Raw Material
- 5.1.1 Waste Plastics
- 5.1.2 Waste Tires
- 5.1.3 Biomass
- 5.1.4 Others
- 5.2 By Application
- 5.2.1 Fuels
- 5.2.2 Chemicals
- 5.3 By Geography
- 5.3.1 Asia-Pacific
- 5.3.1.1 China
- 5.3.1.2 India
- 5.3.1.3 Japan
- 5.3.1.4 South Korea
- 5.3.1.5 Malaysia
- 5.3.1.6 Thailand
- 5.3.1.7 Indonesia
- 5.3.1.8 Vietnam
- 5.3.1.9 Rest of Asia-Pacific
- 5.3.2 North America
- 5.3.2.1 United States
- 5.3.2.2 Canada
- 5.3.2.3 Mexico
- 5.3.3 Europe
- 5.3.3.1 Germany
- 5.3.3.2 United Kingdom
- 5.3.3.3 France
- 5.3.3.4 Italy
- 5.3.3.5 Spain
- 5.3.3.6 Nordic Countries
- 5.3.3.7 Turkey
- 5.3.3.8 Russia
- 5.3.3.9 Rest of Europe
- 5.3.4 South America
- 5.3.4.1 Brazil
- 5.3.4.2 Argentina
- 5.3.4.3 Colombia
- 5.3.4.4 Rest of South America
- 5.3.5 Middle-East and Africa
- 5.3.5.1 Saudi Arabia
- 5.3.5.2 South Africa
- 5.3.5.3 Nigeria
- 5.3.5.4 Qatar
- 5.3.5.5 Egypt
- 5.3.5.6 United Arab Emirates
- 5.3.5.7 Morocco
- 5.3.5.8 Rest of Middle-East and Africa
- 5.3.1 Asia-Pacific
6 Competitive Landscape
- 6.1 Market Concentration
- 6.2 Strategic Moves
- 6.3 Market Share (%)/Ranking Analysis
- 6.4 Company Profiles (includes Global level Overview, Market level overview, Core Segments, Financials as available, Strategic Information, Market Rank/Share for key companies, Products and Services, and Recent Developments)
- 6.4.1 Agilyx
- 6.4.2 Alterra Energy, LLC
- 6.4.3 Arbios Biotech
- 6.4.4 Bioenergy AE Cote-Nord
- 6.4.5 BTG Bioliquids (Green Fuel Nordic Oy)
- 6.4.6 Kerry Group plc
- 6.4.7 New Energy Kft.
- 6.4.8 New Hope Energy
- 6.4.9 Nexus Circular
- 6.4.10 Plastic Energy
- 6.4.11 Pyrocell (Setra)
- 6.4.12 Scandinavian Enviro Systems AB
- 6.4.13 Trident Fuels pty ltd
- 6.4.14 Twence
- 6.4.15 Viridor Limited
7 Market Opportunities and Future Outlook
- 7.1 White-space and Unmet-need Assessment
 廢棄物衍生熱解油市場分析及預測(至2035年):類型、產品類型、技術、應用、最終用戶、製程、安裝類型、設備、解決方案與階段
 2026-2034年全球輪胎熱解產品市場規模、佔有率、趨勢和成長分析報告
 熱解油市場規模、佔有率和成長分析(按類型、原料、原料、改質方法、製程技術、應用和地區分類)—產業預測(2026-2033 年)
 全球輪胎熱解產品市場:市場規模、佔有率、趨勢分析(按產品、最終用途和地區分類)、細分市場預測(2025-2033 年)
 輪胎熱解產品市場:依產品類型、製程技術、營運規模、應用、最終用戶、國家及地區分類-全球產業分析、市場規模、市場佔有率及2025-2032年預測
 全球熱解油市場全球輪胎熱解產品市場
 全球廢棄塑膠熱解油市場預測(至2032年):按塑膠類型、熱解方法、反應器配置、營運規模、分銷管道、最終用戶和地區分類
 生質能熱解油市場-全球產業規模、佔有率、趨勢、機會和預測,按類型、應用、地區和競爭細分,2020-2030 年
 塑膠廢棄物熱解油市場機會、成長動力、產業趨勢分析及2025-2034年預測