


 |
市場調查報告書
商品編碼
1910641
工程服務:市場佔有率分析、產業趨勢與統計、成長預測(2026-2031)Engineering Services - Market Share Analysis, Industry Trends & Statistics, Growth Forecasts (2026 - 2031) |
||||||
※ 本網頁內容可能與最新版本有所差異。詳細情況請與我們聯繫。
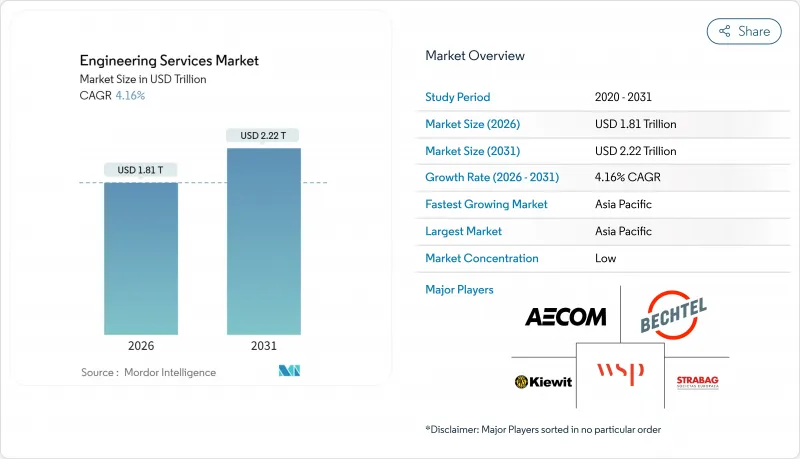
預計到 2026 年,工程服務市場規模將達到 1.81 兆美元,從 2025 年的 1.74 兆美元成長到 2031 年的 2.22 兆美元,2026 年至 2031 年的年複合成長率(CAGR)為 4.16%。
公共部門基礎設施規劃的增加、私人資本湧入能源轉型資產以及數位雙胞胎技術的加速應用,是推動這一成長的關鍵因素。土木工程和電氣工程專業共同支撐著大多數契約,混合式現場-海上交付模式使供應商能夠在計劃複雜性和成本最佳化之間取得平衡。中型企業透過專注於氫能、碳捕獲和小型模組化反應器(SMR)等業務,不斷擴大市場佔有率,政府獎勵也增強了市場需求。儘管亞太地區仍然是最大的區域機遇,但隨著聯邦清潔能源資金流入電網現代化和國防項目,北美市場也呈現出強勁的成長動能。
全球工程服務市場趨勢與洞察
工業IoT與數位雙胞胎實施的演變
製造商正在擴展數位雙胞胎,以減少停機時間並最佳化資產利用率,從而催生了對多學科工程支援的高需求。預測性維護能夠穩定運營,通常可節省 15% 至 25% 的成本。兼具機械實力和分析能力的供應商可以獲得更高的收費,但此類混合技能的短缺導致利潤空間有限。隨著操作技術網路與企業 IT 系統的連接,網路安全加固設計已成為一項必備要素,進一步提升了計劃的價值和複雜性。這一趨勢在半導體工廠、電池工廠和海上生產平台尤為明顯,因為這些場所對計劃外停機的接受度極低。從中長期來看,跨領域專業知識將決定競爭優勢,使專家超越通才。
快速的都市化推動了對民用基礎設施的需求。
到2025年,世界主要城市每年需要9兆美元的投資,以緩解交通堵塞和應對氣候變遷。亞洲城市人口正以每年2.3%的速度成長,推動了公共交通線路、防洪系統和智慧電網建設方面創紀錄的支出。工程顧問公司正在幫助市政當局建立資金籌措的公私合營(PPP)項目,這種能力正在吸引機構資本。在美國,光是聯邦水利基礎設施撥款每年就能產生60億美元的工程需求。強制性的環境合規要求,特別是針對污水處理和災害應變計劃的要求,正在延長規劃週期,並增加對經驗豐富的土木工程公司的需求。因此,長期成長將始終根植於城市發展需求與日益嚴格的永續性標準的交匯點。
政治不穩定和技術純熟勞工嚴重短缺
在政治不穩定的地區,跨國計劃的風險溢價不斷攀升,導致保險成本增加,核准流程延長。同時,退休潮導致經驗豐富的技術人員供應短缺,而此時市場需求卻正處於高峰期。企業報告稱,關鍵的網實整合職位職位高達40%,迫使企業支付25%至35%的薪資溢價。過度依賴分包商降低了利潤率,並招致品質審查,而簽證和認證方面的瓶頸限制了人員的快速調配。目前,企業正在投資內部培訓機構和國際輪調項目,以穩定人才儲備,但短期產能限制阻礙了市場的發展速度。
細分市場分析
到2025年,土木工程將佔總收入的37.86%,因為各國政府將繼續優先發展交通走廊和韌性水系統。同時,在歐盟綠色交易資金以及美國3,690億美元清潔能源激勵措施的推動下,電氣工程預計將以4.93%的複合年成長率快速成長。機械設備產業的需求成長主要得益於工廠自動化和機器人維修,而結構和管道工程的成長則與整體建設週期一致。電氣工程師擴大將軟體編碼、網路安全和IEC-61850電網通訊協定的專業知識融入傳統的工程設計工作中,從而推高了平均售價。隨著分散式能源的普及,公用事業公司正在簽署涵蓋變電站數位化和儲能系統整合研究的多年合約。這些趨勢正在推動工程服務市場朝向電氣化方向發展。
學科界線的模糊化正在重塑人才策略,企業在招募資料科學家的同時,也聘請持有專業工程師(PE)認證的工程師,以支援數位雙胞胎專案的交付。 IEEE 和 ISO-55000 等認證在競標評估中日益受到重視,這使得擁有良好合規記錄的企業更具優勢。因此,即使在對價格敏感的新興市場,高單價計費率也得以維持。預計到 2031 年,電氣工程合約收入將接近土木工程業,從而加劇競爭。為了脫穎而出,企業將越來越專注於車輛到電網(V2G)系統和高壓直流(HVDC)連接等細分領域。
由於受監管計劃需要面對面協調,到2025年,本地項目將佔市場佔有率的66.83%,但離岸項目執行正以5.05%的複合年成長率成長。雲端原生CAD/CAM平台透過將交付成果外包給位於印度、菲律賓和東歐的中心,實現了24小時不間斷的設計週期。對於常規繪圖工作,與本地團隊相比,40-60%的成本差異仍然具有吸引力,這使得現場人員能夠專注於相關人員管理和現場監督。混合工作規範(規定交付成果而非人員數量)正在工程服務市場中逐漸成為主流,從而緩解了客戶對傳統遠端品管的擔憂。
供應商的選擇標準正從單純的工時費率轉向網路安全態勢和資料隔離能力。 ISO-27001 和 SOC-2 認證如今已成為強制性要求。為了遵守出口管制法規,政府計畫甚至設立了完全由盟國國民組成的無塵室式離岸部門。隨著文件和模型檢驗自動化程度的提高,高階架構師的日薪預計將保持穩定,而生產效率的提升可望逐步提高利潤率。這一趨勢表明,離岸外包正從簡單的成本節約措施演變為一種策略性資源放大器。
區域分析
亞太地區預計到2025年將佔全球收入的39.52%,這主要得益於每年1.7兆美元的基礎建設支出。中國的「一帶一路」計劃和印度的地鐵系統推動了強勁的土木工程訂單,而製造業回流亞太地區也帶動了工廠自動化和電網升級的訂單。區域各國政府正將氣候變遷調適津貼用於海岸防護工程,進而推動了沿海土木工程產業的發展。因此,在主權財富基金湧入大型企劃的推動下,該地區的工程服務市場預計將實現5.13%的最高區域複合年成長率。
北美佔據第二大市場佔有率,這得益於3,690億美國的清潔能源激勵措施和1.2兆美元的基礎設施現代化建設資金。國防費用和小型模組化反應器(SMR)試驗進一步推動了對高技能工程人才的需求。加拿大的液化天然氣和核能計畫以及墨西哥的近岸工廠建設正在擴大北美大陸的計劃儲備。供應商的機會涵蓋電網互聯研究、氫能樞紐前端工程設計(FEED)合約以及關鍵礦物加工廠等。
在歐洲,歐盟綠色交易的資金重點用於淨零排放維修和離岸風電擴建。德國5000億歐元(5,500億美元)的基礎設施基金和英國的塞茲韋爾C核能計劃是大型計畫的典型例子。嚴格的分類規則確保資金流向經認證的永續計劃,並獎勵那些在環境、社會和治理(ESG)報告方面表現出色的公司。同時,中東和非洲正致力於能源多元化,包括在沿岸地區綠色氨出口中心,以及在北非發展公用事業規模的太陽能發電。然而,政治穩定性問題和勞動力短缺減緩了中東和北非部分市場的成長。
其他福利:
- Excel格式的市場預測(ME)表
- 3個月的分析師支持
目錄
第1章 引言
- 研究假設和市場定義
- 調查範圍
第2章調查方法
第3章執行摘要
第4章 市場情勢
- 市場概覽
- 市場促進因素
- 工業IoT與數位雙胞胎技術的發展
- 快速的都市化推動了對民用基礎設施的需求。
- 加速的產品生命週期推動研發外包
- 能源轉型大型企劃(氫能、碳捕獲、利用與封存)對工程、採購、施工和管理(EPCM)專業知識的需求
- 經合組織國家的淨零排放建築維修規定
- 國防無人機和高超音速工程的特殊工程需求
- 市場限制
- 政治不穩定和技術純熟勞工嚴重短缺
- 投入成本和供應鏈波動性
- 由於智慧財產權安全方面的擔憂,國防領域的外包受到限制。
- 大型可再生能源發電核准程序延誤
- 產業價值鏈分析
- 監管環境
- 技術展望
- 波特五力分析
- 供應商的議價能力
- 買方的議價能力
- 新進入者的威脅
- 替代品的威脅
- 競爭對手之間的競爭
- 對宏觀經濟趨勢的市場評估
第5章 市場規模與成長預測
- 按技術領域
- 土木工程
- 機器
- 電
- 管道和結構
- 以規定形式
- 離岸
- 當地的
- 透過服務
- 產品工程
- 程式工程
- 自動化相關服務
- 資產管理相關服務
- 按最終用戶行業分類
- 航太與國防
- 車
- 化工/石油化工
- 發電
- 市政公共產業計劃
- 礦業
- 石油和天然氣
- 製藥
- 運輸
- 電訊
- 核能計劃
- 其他終端用戶產業
- 按地區
- 北美洲
- 美國
- 加拿大
- 墨西哥
- 南美洲
- 巴西
- 阿根廷
- 其他南美洲
- 歐洲
- 德國
- 英國
- 法國
- 義大利
- 西班牙
- 其他歐洲地區
- 亞太地區
- 中國
- 日本
- 印度
- 新加坡
- 澳洲
- 馬來西亞
- 亞太其他地區
- 中東和非洲
- 中東
- 沙烏地阿拉伯
- 阿拉伯聯合大公國
- 其他中東地區
- 非洲
- 南非
- 埃及
- 其他非洲地區
- 中東
- 北美洲
第6章 競爭情勢
- 市場集中度
- 策略趨勢
- 市佔率分析
- 公司簡介
- AECOM Engineering company
- Bechtel Corporation
- Kiewit Corporation
- WSP Global Inc.
- STRABAG SE
- Fluor Corporation
- Tetra Tech, Inc.
- Arcadis NV
- Stantec Inc.
- AtkinsRealis Inc.
- NV5 Global, Inc.
- Black & Veatch Holding Co.
- Balfour Beatty plc
- HDR, Inc.
- Wood PLC
- China Communications Construction Co. Ltd.
- Gilbane Building Company
- Brasfield & Gorrie LLC
- Jacobs Solutions Inc.
- Barton Malow Inc.
第7章 市場機會與未來展望
The engineering services market size in 2026 is estimated at USD 1.81 trillion, growing from 2025 value of USD 1.74 trillion with 2031 projections showing USD 2.22 trillion, growing at 4.16% CAGR over 2026-2031.
Rising public-sector infrastructure programs, private capital pouring into energy-transition assets, and accelerating digital-twin adoption are the primary vectors supporting that expansion. Civil and electrical disciplines jointly underpin most contracts, while hybrid onsite, offshore delivery helps vendors balance project complexity with cost optimization. Mid-sized firms continue to gain share by specializing in hydrogen, carbon-capture, and small modular reactor (SMR) work, where government incentives strengthen demand visibility. Asia Pacific sustains the largest regional opportunity set, yet North America posts resilient growth as federal clean-energy funds flow into grid-modernization and defense programs.
Global Engineering Services Market Trends and Insights
Evolution of Industrial IoT and Digital-Twin Adoption
Manufacturers are scaling digital twins to cut downtime and fine-tune asset utilization, triggering premium demand for multidisciplinary engineering support. Engagements commonly promise 15-25% cost reductions once predictive maintenance stabilizes operations. Vendors that couple mechanical strength with analytics talent win higher bill rates, yet the scarcity of such hybrid skills keeps margins firm. As operational-technology networks connect to enterprise IT, cyber-hardening design has become a mandatory scope element, further widening project value and complexity. The trend is most visible in semiconductor fabs, battery-cell plants, and offshore production platforms, where tolerance for unplanned outages is minimal. Over the medium term, cross-domain expertise will define competitive advantage, giving specialist firms room to outpace generalists.
Rapid Urbanization Spurring Civil-Infrastructure Demand
Global cities require USD 9 trillion annually through 2025 to relieve congestion and climate stress. Asia's 2.3% yearly urban-population increment forces record spending on mass-transit corridors, flood-control systems, and smart-utility grids. Engineering consultancies help municipalities structure bankable public-private partnership (PPP) deals, a capability that attracts institutional capital. In the United States, federal water infrastructure grants alone create a USD 6 billion annual engineering opportunity. Environmental-compliance mandates, particularly for wastewater and storm-resilience projects, lengthen scoping phases and raise demand for experienced civil firms. Long-term growth, therefore, remains anchored in the intersection of urban build-out needs and stricter sustainability codes.
Political Instability and Acute Skilled-Labor Shortage
Cross-border project risk premiums widen in politically volatile regions, inflating insurance costs and elongating approval cycles. Concurrently, retirements reduce the available experienced-engineer pool just as demand peaks. Firms report up to 40% vacancy rates for critical cyber-physical roles, forcing salary premiums of 25-35%. Over-reliance on subcontractors erodes margin and invites quality scrutiny, while visa and certification bottlenecks limit rapid redeployment of personnel. Companies now invest in internal academies and international rotation programs to stabilize workforce pipelines, but near-term capacity constraints remain a drag on market velocity.
Other drivers and restraints analyzed in the detailed report include:
- Accelerated Product Life-Cycle Driving Outsourced Research and Development
- Energy-Transition Mega-Projects Requiring EPCM Expertise
- IP-Security Concerns Limiting Defense Outsourcing
For complete list of drivers and restraints, kindly check the Table Of Contents.
Segment Analysis
Civil engineering retained 37.86% of 2025 revenue as governments continued to prioritize transportation corridors and resilient water systems. Electrical work, however, is forecast to grow at a 4.93% CAGR, the fastest among disciplines, propelled by USD 369 billion in U.S. clean-energy incentives and parallel EU Green Deal funding. Mechanical services gain traction through factory automation and robotics retrofits, while structural and piping segments trace the broader construction cycle. Electrical practitioners increasingly bundle software coding, cybersecurity, and IEC-61850 grid-protocol expertise with traditional design scopes, a convergence that maintains high average selling prices. As distributed energy resources proliferate, utilities award multi-year frameworks covering substation digitalization and storage-integration studies. These developments keep the engineering services market on an electrification-tilted growth arc.
The blurring of disciplinary boundaries also reshapes talent strategies; firms now recruit data scientists alongside PE-licensed engineers to satisfy digital-twin deliverables. Certification regimes such as IEEE and ISO-55000 factor heavily into bid evaluations, elevating firms with proven compliance track records. Consequently, premium billing rates remain sticky even in price-sensitive emerging markets. By 2031, electrical contracts are expected to approach civil's revenue scale, tightening competition and prompting niche specialization, such as vehicle-to-grid systems and high-voltage direct-current interconnects, to preserve differentiation.
On-site work held a 66.83% share in 2025 due to the need for face-to-face coordination on regulated projects, yet offshore execution is expanding at a 5.05% CAGR. Cloud-native CAD/CAM platforms enable 24-hour design cycles by handing deliverables to centers in India, the Philippines, and Eastern Europe. Cost arbitrage of 40-60% versus local teams remains compelling for routine drafting, freeing onsite staff for stakeholder management and field supervision. The engineering services market increasingly coalesces around hybrid statements of work that specify deliverables, not headcount, thereby defusing earlier client concerns about remote quality control.
Vendor selection now pivots on cybersecurity posture and data-segmentation capabilities rather than solely on hourly rates. ISO-27001 and SOC-2 attestations have become table stakes. For government-sensitive scopes, clients sometimes carve out clean-room offshore pods staffed exclusively by citizens of allied nations to comply with export-control regulations. With automation in documentation and model-checking advancing, firms expect incremental margin lift from productivity gains, even as daily rates for senior architects remain flat. The trend confirms offshore's evolution from tactical cost lever to strategic resource multiplier.
The Engineering Services Market Report is Segmented by Engineering Disciplines (Civil, Mechanical, and More), Delivery Model (Offshore, and Onsite), Services (Product Engineering, Process Engineering, and More), End-User Industry (Aerospace and Defense, Automotive, and More), and Geography (North America, South America, Europe, Asia-Pacific, and Middle East and Africa). The Market Forecasts are Provided in Terms of Value (USD).
Geography Analysis
Asia Pacific retained 39.52% of 2025 revenue, anchored by USD 1.7 trillion in annual infrastructure spending. China's Belt and Road initiatives and India's mass rapid-transit build-outs secure a robust civil-work backlog, while Asia-Pacific manufacturing-reshoring funnels orders into factory-automation and utility-grid upgrades. Regional governments allocate climate-adaptation grants toward coastal-protection engineering, propelling coastal-civil sub-disciplines. As a result, the engineering services market registers its fastest 5.13% regional CAGR here, sustained by sovereign wealth deployment into mega-projects.
North America holds the second-largest share, buoyed by USD 369 billion in U.S. clean-energy incentives and USD 1.2 trillion for broader infrastructure modernization. Defense spending and SMR pilots further sharpen demand for high-clearance engineering talent. Canada's LNG and nuclear programs, along with Mexico's near-shoring-induced factory builds, enlarge the continental project funnel. Vendor opportunities span grid-interconnect studies, hydrogen-hub FEED contracts, and critical-mineral processing plants.
Europe pivots on net-zero retrofits and offshore-wind expansion financed by the EU Green Deal.Germany's EUR 500 billion (USD 550 billion) infrastructure fund and the U.K.'s Sizewell C nuclear project typify large pipeline items. Strict taxonomy rules steer capital toward certified sustainable projects, rewarding firms adept at ESG reporting. Meanwhile, the Middle East and Africa focus on energy diversification, such as green-ammonia export hubs in the Gulf and utility-scale solar in North Africa. Political stability issues and labor shortages, however, temper growth velocity in selected Middle East and Africa markets.
- AECOM Engineering company
- Bechtel Corporation
- Kiewit Corporation
- WSP Global Inc.
- STRABAG SE
- Fluor Corporation
- Tetra Tech, Inc.
- Arcadis NV
- Stantec Inc.
- AtkinsRealis Inc.
- NV5 Global, Inc.
- Black & Veatch Holding Co.
- Balfour Beatty plc
- HDR, Inc.
- Wood PLC
- China Communications Construction Co. Ltd.
- Gilbane Building Company
- Brasfield & Gorrie LLC
- Jacobs Solutions Inc.
- Barton Malow Inc.
Additional Benefits:
- The market estimate (ME) sheet in Excel format
- 3 months of analyst support
TABLE OF CONTENTS
1 INTRODUCTION
- 1.1 Study Assumptions and Market Definition
- 1.2 Scope of the Study
2 RESEARCH METHODOLOGY
3 EXECUTIVE SUMMARY
4 MARKET LANDSCAPE
- 4.1 Market Overview
- 4.2 Market Drivers
- 4.2.1 Evolution of Industrial IoT and Digital Twin Adoption
- 4.2.2 Rapid Urbanization Spurring Civil Infrastructure Demand
- 4.2.3 Accelerated Product Life-Cycle Driving Outsourced Research and Development
- 4.2.4 Energy-Transition Mega-Projects (Hydrogen, CCUS) Requiring EPCM Expertise
- 4.2.5 Net-Zero Building Retrofit Mandates in OECD Economies
- 4.2.6 Defense Drone and Hypersonic Programs Needing Specialized Engineering
- 4.3 Market Restraints
- 4.3.1 Political Instability and Acute Skilled Labor Shortage
- 4.3.2 Input Cost and Supply-Chain Volatility
- 4.3.3 IP Security Concerns Limiting Defense Outsourcing
- 4.3.4 Slow Permitting for Utility-Scale Renewables
- 4.4 Industry Value Chain Analysis
- 4.5 Regulatory Landscape
- 4.6 Technological Outlook
- 4.7 Porter's Five Forces Analysis
- 4.7.1 Bargaining Power of Suppliers
- 4.7.2 Bargaining Power of Buyers
- 4.7.3 Threat of New Entrants
- 4.7.4 Threat of Substitutes
- 4.7.5 Intensity of Competitive Rivalry
- 4.8 Assessment of Macro-economic Trends on the Market
5 MARKET SIZE AND GROWTH FORECASTS (VALUE)
- 5.1 By Engineering Disciplines
- 5.1.1 Civil
- 5.1.2 Mechanical
- 5.1.3 Electrical
- 5.1.4 Piping and Structural
- 5.2 By Delivery Model
- 5.2.1 Offshore
- 5.2.2 Onsite
- 5.3 By Services
- 5.3.1 Product Engineering
- 5.3.2 Process Engineering
- 5.3.3 Automation Related Services
- 5.3.4 Asset Management Related Services
- 5.4 By End-user Industry
- 5.4.1 Aerospace and Defense
- 5.4.2 Automotive
- 5.4.3 Chemical and Petrochemical
- 5.4.4 Electric Power Generation
- 5.4.5 Municipal Utility Projects
- 5.4.6 Mining
- 5.4.7 Oil and Gas
- 5.4.8 Pharmaceuticals
- 5.4.9 Transportation
- 5.4.10 Telecommunications
- 5.4.11 Nuclear Projects
- 5.4.12 Other End-user Industries
- 5.5 By Geography
- 5.5.1 North America
- 5.5.1.1 United States
- 5.5.1.2 Canada
- 5.5.1.3 Mexico
- 5.5.2 South America
- 5.5.2.1 Brazil
- 5.5.2.2 Argentina
- 5.5.2.3 Rest of South America
- 5.5.3 Europe
- 5.5.3.1 Germany
- 5.5.3.2 United Kingdom
- 5.5.3.3 France
- 5.5.3.4 Italy
- 5.5.3.5 Spain
- 5.5.3.6 Rest of Europe
- 5.5.4 Asia-Pacific
- 5.5.4.1 China
- 5.5.4.2 Japan
- 5.5.4.3 India
- 5.5.4.4 Singapore
- 5.5.4.5 Australia
- 5.5.4.6 Malaysia
- 5.5.4.7 Rest of Asia-Pacific
- 5.5.5 Middle East and Africa
- 5.5.5.1 Middle East
- 5.5.5.1.1 Saudi Arabia
- 5.5.5.1.2 United Arab Emirates
- 5.5.5.1.3 Rest of Middle East
- 5.5.5.2 Africa
- 5.5.5.2.1 South Africa
- 5.5.5.2.2 Egypt
- 5.5.5.2.3 Rest of Africa
- 5.5.5.1 Middle East
- 5.5.1 North America
6 COMPETITIVE LANDSCAPE
- 6.1 Market Concentration
- 6.2 Strategic Moves
- 6.3 Market Share Analysis
- 6.4 Company Profiles (includes Global level Overview, Market level overview, Core Segments, Financials as available, Strategic Information, Market Rank/Share for key companies, Products and Services, and Recent Developments)
- 6.4.1 AECOM Engineering company
- 6.4.2 Bechtel Corporation
- 6.4.3 Kiewit Corporation
- 6.4.4 WSP Global Inc.
- 6.4.5 STRABAG SE
- 6.4.6 Fluor Corporation
- 6.4.7 Tetra Tech, Inc.
- 6.4.8 Arcadis NV
- 6.4.9 Stantec Inc.
- 6.4.10 AtkinsRealis Inc.
- 6.4.11 NV5 Global, Inc.
- 6.4.12 Black & Veatch Holding Co.
- 6.4.13 Balfour Beatty plc
- 6.4.14 HDR, Inc.
- 6.4.15 Wood PLC
- 6.4.16 China Communications Construction Co. Ltd.
- 6.4.17 Gilbane Building Company
- 6.4.18 Brasfield & Gorrie LLC
- 6.4.19 Jacobs Solutions Inc.
- 6.4.20 Barton Malow Inc.
7 MARKET OPPORTUNITIES AND FUTURE OUTLOOK
- 7.1 White-space and Unmet-Need Assessment
 工程服務市場:2026-2032年全球市場預測(依服務類型、經營模式、交付模式、服務期限、產業及客戶類型分類)
 工程實驗室即服務 (ELaaS) 市場:市場規模、佔有率和趨勢分析(按實驗室類型、訪問模式、最終用途和地區分類),細分市場預測(2026-2033 年)繪圖服務市場:全球市場按產品類型、價格範圍、應用和最終用戶分類的預測 - 2026-2032 年
 2026年全球人工智慧(AI)工程市場報告2026年全球工程服務市場報告2026年全球工程研發外包市場報告2026年全球物理、工程與生命科學市場報告
 2026-2030年全球工程服務市場
 美國工程服務:市場佔有率分析、行業趨勢和統計數據、成長預測(2026-2031 年)冷彎型鋼工程服務市場按服務類型、型材類型、最終用途、通路和應用分類,全球預測(2026-2032年)