


 |
市場調查報告書
商品編碼
1910633
硬質塑膠包裝:市場佔有率分析、產業趨勢與統計、成長預測(2026-2031)Rigid Plastic Packaging - Market Share Analysis, Industry Trends & Statistics, Growth Forecasts (2026 - 2031) |
||||||
※ 本網頁內容可能與最新版本有所差異。詳細情況請與我們聯繫。
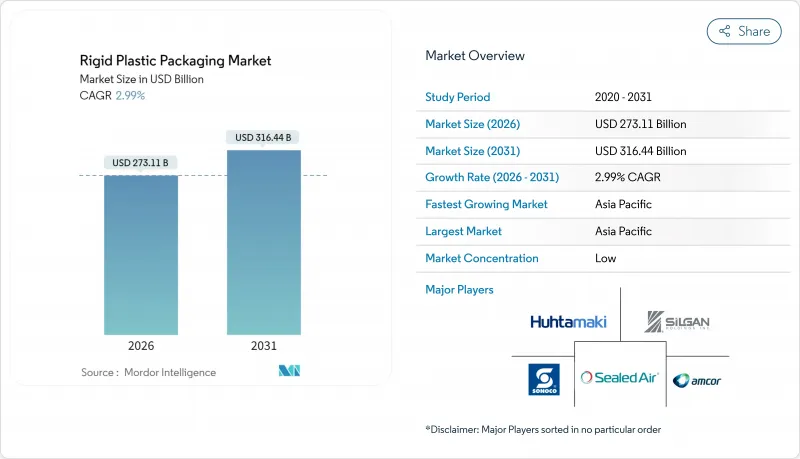
預計硬質塑膠包裝市場將從 2025 年的 2,651.8 億美元成長到 2026 年的 2,731.1 億美元,到 2031 年將達到 3,164.4 億美元,2026 年至 2031 年的複合年成長率為 2.99%。
在永續性勢在必行以及對供應鏈韌性的需求驅動下,硬質塑膠包裝市場正處於穩步擴張階段,力求在銷售和價值創造之間取得平衡。電子商務的成長推動了抗衝擊包裝的需求,監管壓力促使企業採用單一材料設計,而人口結構變化也帶動了食品和醫療保健行業對一次性包裝的需求,這些因素共同促進了硬質塑膠包裝市場的發展。生產商正在提高再生材料的使用比例,以應對生產者延伸責任制(EPR)帶來的成本上漲,而對再生資產的垂直整合則提高了原料的透明度,並有助於抵禦聚合物價格的波動。亞太地區憑藉其規模優勢、政策獎勵和快速成長的都市區消費主導市場;歐洲正利用嚴格的循環經濟法規加速高階解決方案的發展;而北美則在推動低溫運輸物流的發展,這需要堅固耐用的包裝容器。隨著大型加工商尋求併購以增強其採購能力、創新廣度和合規應對力,日益激烈的競爭正在改變小型企業的進入門檻。
全球硬質塑膠包裝市場趨勢與洞察
循環經濟政策推動了對再生包裝的需求
目前已有63個國家實施生產者延伸責任制(EPR),其費用隨可回收性呈指數級成長,從而推動成本結構向消費後回收(PCR)原料和整體式設計傾斜。 PCR PET的價格比原生樹脂高出10-15%,顛覆了傳統的定價模式,促使加工商透過收購和長期合約來確保再生原料的供應。隨著丹麥2025年數據報告法規的實施,數位化可追溯系統正在興起,端到端透明度也正在加速提升。隨著歐盟回收義務期限的臨近,大量資金正湧入食品級認證的清潔、擠出和化學回收設施。這一因素正在推動規模化投資,並加速硬質塑膠包裝市場從以銷售量衡量標準轉變為循環價值的標準。
電子商務的蓬勃發展推動了對防震、便於運輸的包裝形式的需求。
在直接面對消費者 (D2C) 的物流模式中,初級包裝容器承受的搬運力比傳統零售通路高出 40%,這增加了品牌所有者的破損成本風險。剛性設計,特別是射出成型成型和熱成型的托盤,無需二次包裝即可吸收衝擊力,從而降低體積重量費用和損壞退貨率。零售商正在強制推行「自營出貨」通訊協定,該流程建議採用能夠承受自動化倉庫中 50 公斤以上載重的堅固結構。目前的創新重點在於邊角加固結構和內建緩衝肋,這些設計在保護內容物的同時,也能減少樹脂的使用。這種結構要求也符合永續性的概念,因為厚實的、可重複使用的剛性包裝容器可以減少末端配送中一次性紙板的廢棄物。這些趨勢正在推動硬質塑膠包裝市場的成長和創新。
聚合物價格波動加劇,對加工商的利潤率帶來壓力。
原料供應中斷導致聚乙烯價格在2024年六個月內波動幅度高達35%,給受固定價格合約約束的加工商帶來壓力。規模較小、避險能力有限的公司產運轉率不到70%,面臨營運資金透支的風險。亞洲烯烴裂解裝置正在降低運轉率以應對負價差,這限制了樹脂供應並推高了現貨溢價。硬質塑膠包裝市場對成本衝擊的吸收並不均衡,全球巨頭利用規模經濟效應簽訂的合約獲利,而區域性公司則延後投資和產能現代化改造。
細分市場分析
到2025年,瓶罐將佔硬質塑膠包裝市場規模的42.83%,反映了飲料、個人護理和非處方藥品行業的穩定需求。卓越的透明度、防篡改功能和標籤相容性將支撐其穩定的需求,即使輕量化趨勢導致單位樹脂用量減少。創新產品包括繫繩式瓶蓋,這種瓶蓋符合一次性塑膠法規並提高了可回收性。該領域的成長主要依賴飲料產量而非顛覆性創新,因此對於大型加工商而言,這是一個穩定的收入來源。
儘管托盤市場佔有率較小,但其複合年成長率高達4.43%,是成長最快的產品,這主要得益於電子商務自動化,尤其是嵌入式RFID和物聯網賦能的裝載容器的應用。可重複使用的塑膠托盤在耐用性和衛生性方面優於木質托盤,使其成為藥品和生鮮食品低溫運輸的關鍵環節。標準化的形狀有助於高層倉庫的自動化,而序列化則支援資產追蹤資訊服務,從而創造額外收入。隨著零售商採用閉合迴路共享系統,托盤供應商正在將追蹤軟體和硬體捆綁銷售,從而在硬質塑膠包裝市場打造以服務主導的差異化優勢。
2025年,PET憑藉其優異的阻隔性能和完善的瓶到瓶回收循環體系,仍將佔據硬質塑膠包裝市場31.05%的佔有率。歐洲押金制度實現了76.7%的PET回收率,由於其較高的消費後生質塑膠的複合年成長率(CAGR)達到4.98%。中國每年新增70萬噸PBAT和10萬噸PLA產能,正穩定供應並逐步降低價格溢價。
排碳權計畫正在將生物基樹脂的溫室氣體減排量貨幣化,從而改變生命週期經濟模式。主要飲料品牌正在試驗使用100%生物基寶特瓶,瓶蓋製造商也正在向植物來源HDPE過渡。因此,硬質塑膠包裝市場正在努力平衡傳統石化產業鏈的成本效益與向低碳聚合物的策略性多元化發展,以確保產品組合能夠應對未來日益嚴格的監管。
這份《硬質塑膠包裝報告》依產品類型(瓶罐、托盤容器等)、材料(聚乙烯、聚對苯二甲酸乙二醇酯、聚丙烯等)、終端用戶產業(食品、醫療保健、化妝品及個人護理、工業等)、製造流程(射出成型、擠出吹塑成型成型等)和地區對市場進行分析。市場預測以美元以金額為準。
區域分析
預計到2025年,亞太地區將佔全球硬質塑膠包裝收入的38.85%,複合年成長率(CAGR)為5.62%。這主要得益於印度吸引了14.6億美元的生產關聯投資(PLI),以及中國生物分解性塑膠的擴張,從而支撐了區域供應鏈。為了減少運輸排放,本地加工商正與全球品牌保持同步,在更靠近消費者的地方建立生產設施並擴大產能。監管政策向可回收或生物基包裝材料的轉變,為那些開展技術轉移合作的企業提供了先發優勢。
在北美,電子商務和低溫運輸藥品運輸的擴張持續推動著對能夠確保產品在長途物流運輸過程中保持品質的堅固包裝的需求。各州提出的生產者延伸責任制(EPR)提案正在推動包裝設計的重新調整,但實施時間的不均衡緩解了監管措施的突發影響。較高的平均收入水準支撐著高階一次性包裝的需求,從而推動了高利潤率硬質塑膠包裝市場的成長。
歐洲市場需求成熟,但由於積極的循環經濟政策,其產品附加價值密度極高。 《包裝及包裝廢棄物法規》(PPWR) 正在推動單一材料解決方案的普及,刺激資本流入回收基礎設施,並催生了一個價值150億美元的合規市場。德國、荷蘭和法國的創新叢集正在領先化學回收試點項目,確保該地區的消費後回收 (PCR) 供應,並建立通往亞洲的出口管道。
在南美洲和中東及非洲,新興機會正因回收不足和政策執行緩慢而受阻。跨國公司正在部署模組化回收工廠,以確保當地再生塑膠(PCR)的供應,並力求達到全球含量目標。南非的《生產者責任延伸法》和肯亞的《生產者責任法案》體現了政策的趨同,這正在推動更嚴格的設計標準和對符合規範的硬質塑膠解決方案日益成長的需求。投資激勵措施和低廉的勞動力成本正在吸引擠出和射出成型線的遷入,使這些地區成為未來硬質塑膠包裝市場的出口中心。
其他福利:
- Excel格式的市場預測(ME)表
- 3個月的分析師支持
目錄
第1章 引言
- 研究假設和市場定義
- 調查範圍
第2章調查方法
第3章執行摘要
第4章 市場情勢
- 市場概覽
- 市場促進因素
- 循環經濟政策推動了對再生材料包裝的需求。
- 電子商務的蓬勃發展推動了對防震、適於運輸的包裝形式的需求。
- 家庭規模縮小推動了對單一硬質容器的需求。
- 推出高阻隔性、單一材料解決方案,以符合歐盟2027年回收目標
- 低溫運輸物流的快速成長對超強剛性容器的需求日益成長。
- 市場限制
- 聚合物價格波動加劇,對加工商的利潤率帶來壓力。
- 消費者擴大轉向柔軟性的紙質替代品
- 生產者延伸責任制(EPR)成本增加總擁有成本
- 新興經濟體缺乏回收基礎設施,限制了消費後消費品的供應。
- 產業價值鏈分析
- 監管環境
- 技術展望
- 宏觀經濟因素如何影響市場
- 波特五力分析
- 供應商的議價能力
- 買方和消費者的議價能力
- 新進入者的威脅
- 替代品的威脅
- 競爭對手之間的競爭
第5章 市場規模與成長預測
- 依產品類型
- 瓶子和罐子
- 托盤和容器
- 中型散貨箱(IBC)
- 調色盤
- 其他產品類型
- 材料
- 聚乙烯(PE)
- 聚對苯二甲酸乙二醇酯(PET)
- 聚丙烯(PP)
- 聚苯乙烯(PS)和發泡聚苯乙烯(EPS)
- 生質塑膠
- 其他材料
- 按最終用戶行業分類
- 食物
- 飲料
- 衛生保健
- 化妝品和個人護理
- 產業
- 建築/施工
- 車
- 其他終端用戶產業
- 透過製造程序
- 射出成型
- 擠出吹塑成型
- 注塑吹塑成型
- 拉伸吹塑成型
- 熱成型
- 旋轉成型
- 壓縮成型
- 按地區
- 北美洲
- 美國
- 加拿大
- 墨西哥
- 南美洲
- 巴西
- 阿根廷
- 墨西哥
- 南美洲其他地區
- 歐洲
- 德國
- 法國
- 英國
- 義大利
- 西班牙
- 波蘭
- 其他歐洲
- 亞太地區
- 中國
- 印度
- 日本
- 泰國
- 澳洲
- 韓國
- 亞太其他地區
- 中東和非洲
- 中東
- 沙烏地阿拉伯
- 阿拉伯聯合大公國
- 土耳其
- 其他中東地區
- 非洲
- 南非
- 奈及利亞
- 埃及
- 其他非洲地區
- 中東
- 北美洲
第6章 競爭情勢
- 市場集中度
- 策略趨勢
- 市佔率分析
- 公司簡介
- Amcor plc
- Alpha Packaging Holdings, Inc.
- ALPLA Werke Alwin Lehner GmbH & Co KG
- Silgan Holdings Inc.
- Sealed Air Corporation
- Plastipak Holdings, Inc.
- Sonoco Products Company
- Resilux NV
- Graham Packaging Company, LP
- Greif, Inc.
- Mauser Packaging Solutions Holding Company
- Pact Group Holdings Ltd
- Gerresheimer AG
- Huhtamaki Oyj
- Coveris Management GmbH
- Logoplaste Consultores Tecnicos SA
- International Paper Company(DS Smith Plc)
- Weener Plastics Group BV
- Anchor Packaging LLC
- Visy Industries Holdings Pty Ltd
- Altium Packaging LLC
- Serioplast Group SpA
- Mpact Limited
第7章 市場機會與未來展望
The Rigid Plastic Packaging Market is expected to grow from USD 265.18 billion in 2025 to USD 273.11 billion in 2026 and is forecast to reach USD 316.44 billion by 2031 at 2.99% CAGR over 2026-2031.
Underscoring a steady expansion phase that balances volume with value creation driven by sustainability mandates and supply-chain resilience needs. The rigid plastic packaging market benefits from e-commerce growth that favors impact-resistant formats, regulatory pressure that rewards monomaterial design, and demographic trends that lift single-serve demand across food and healthcare channels. Producers elevate recycled-content integration to meet Extended Producer Responsibility (EPR) cost curves, while vertical integration into recycling assets secures feedstock visibility and buffers polymer price swings. Asia-Pacific leads with scale, policy incentives, and rapid urban consumption, Europe leverages stringent circular-economy rules to accelerate premium solutions, and North America advances cold-chain logistics that require robust containers. Competitive intensity rises as top converters merge to gain procurement muscle, innovation breadth, and compliance readiness, resetting entry barriers for smaller firms.
Global Rigid Plastic Packaging Market Trends and Insights
Circular-economy mandates driving recycled-content packaging demand
Sixty-three countries now levy EPR fees that scale sharply with recyclability, shifting cost structures in favor of post-consumer recycled (PCR) feedstock and monomaterial design. Premiums of 10-15% for PCR PET over virgin resin invert traditional price hierarchies, prompting converters to lock in recycled supply through acquisitions and long-term contracts. Digital traceability systems emerge as firms comply with Denmark's 2025 data-reporting rules, accelerating end-to-end transparency. As EU recyclability deadlines approach, capital flows toward washing, extrusion, and chemical recycling facilities that can certify food-grade output. This driver underpins scale investment rationales and reinforces the rigid plastic packaging market's pivot from volume metrics to circular-value metrics.
Surge in e-commerce accelerating demand for impact-resistant ship-ready formats
Direct-to-consumer fulfillment exposes primary containers to handling forces 40% higher than traditional retail routes, elevating failure-cost risk for brand owners. Rigid designs- especially injection-molded tubs and thermoformed trays- absorb shock without secondary packaging, reducing dimensional weight fees and damage returns. Retailers mandate "ship-in-own-container" protocols that favor sturdy formats capable of stack loads exceeding 50 kg during automated warehousing. Innovation now focuses on corner-reinforcement geometry and built-in cushioning ribs that protect contents while trimming resin use. This structural requirement aligns with sustainability imperatives because thicker, reusable rigid containers offset single-use corrugated waste in last-mile delivery. These trends are driving growth and innovation in the rigid plastic packaging market.
Escalating polymer price volatility compressing converter margins
Feedstock disruptions lifted polyethylene price swings to 35% within six months during 2024, squeezing converters locked into fixed-price contracts. Smaller firms with limited hedging capability operate at sub-70% plant utilization, risking covenant breaches on working-capital lines. Asian olefin crackers cut run rates to manage negative spreads, constraining resin availability and inflating spot premiums. The rigid plastic packaging market absorbs cost shocks unevenly; global majors leverage scale contracts, whereas regional players delay investments, slowing capacity modernization.
Other drivers and restraints analyzed in the detailed report include:
- Demographic shift toward smaller households fueling single-serve rigid packs
- Adoption of high-barrier monomaterial solutions to meet 2027 EU recyclability targets
- Increasing consumer shift to flexible and paper-based alternatives
For complete list of drivers and restraints, kindly check the Table Of Contents.
Segment Analysis
Bottles and jars accounted for 42.83% of the rigid plastic packaging market size in 2025, reflecting entrenched usage in beverages, personal care, and over-the-counter medicines. Superior clarity, tamper evidence, and label compatibility keep demand steady even as lightweight initiatives trim resin per unit. Innovations include tethered caps that satisfy single-use plastics directives and improve recyclability. Growth remains volume-linked to beverage output rather than disruptive technology shifts, positioning the segment as a stable revenue base for large converters.
Pallets, though a smaller share, are the fastest-rising product at a 4.43% CAGR, powered by e-commerce automation that values RFID-embedded, IoT-ready load carriers. Reusable plastic pallets outperform wood on durability and hygiene, which is critical for cold-chain pharmaceuticals and fresh produce. Standardized footprints facilitate high-bay warehouse robotics, and serialization unlocks asset-tracking data services that generate ancillary revenue. As retailers adopt closed-loop pooling systems, pallet suppliers bundle tracking software with hardware, creating service-driven differentiation within the rigid plastic packaging market.
PET retained 31.05% of the rigid plastic packaging market share in 2025, owing to its strong barrier profile and established bottle-to-bottle recycling loops. Deposit schemes in Europe achieve 76.7% PET recovery, enabling high PCR content that lowers EPR liabilities. Yet bioplastics show a 4.98% CAGR as policy and brand commitments prioritize bio-based feedstocks. Chinese capacity expansions to 700,000 t/y PBAT and 100,000 t/y PLA stabilize supply and chip away at price premiums.
Lifecycle economics shift as carbon-credit schemes monetize greenhouse-gas savings from bio-based resins. Major beverage brands test 100% bio-PET bottles, and cap manufacturer programs move toward plant-derived HDPE. The rigid plastic packaging market, therefore, balances cost efficiencies in legacy petrochemical chains with strategic diversification into low-carbon polymers that future-proof portfolios against regulatory escalation.
The Rigid Plastic Packaging Report is Segmented by Product Type (Bottles and Jars, Trays and Containers, and More), Material (Polyethylene, Polyethylene Terephthalate, Polypropylene, and More), End User Industry (Food, Healthcare, Cosmetics and Personal Care, Industrial, and More), Manufacturing Process (Injection Molding, Extrusion Blow Molding, and More), and Geography. The Market Forecasts are Provided in Terms of Value (USD).
Geography Analysis
Asia-Pacific generated 38.85% of 2025 sales in rigid plastic packaging and is forecast to expand at 5.62% CAGR, buoyed by India's USD 1.46 billion PLI-attracted investments and China's biodegradable-plastic build-out that anchors regional supply chains. Local converters scale capacity alongside global brands, locating production near consumers to cut freight emissions. Regulatory pivots toward recyclable or bio-based packaging create first-mover advantages for firms with technology transfer alliances.
North America enjoys steady growth as e-commerce and cold-chain pharmaceuticals escalate demand for robust containers that preserve product integrity across extended logistics routes. State-level EPR proposals prompt design re-evaluation, yet fragmented timelines moderate compliance shocks. High average incomes support premium single-serve formats, reinforcing volume for high-margin rigid segments.
Europe exhibits mature volume but high value density because of aggressive circular-economy directives. The Packaging and Packaging Waste Regulation drives adoption of monomaterial solutions and propels capital into recycling infrastructure, creating a USD 15 billion compliance market. Innovation clusters in Germany, the Netherlands, and France pioneer chemical recycling pilots that secure local PCR supplies and feed export channels into Asia.
South America and the Middle East and Africa present emerging opportunities tempered by collection shortfalls and policy lag. Multinationals deploy modular recycling plants to capture local PCR and fulfill global content pledges. South Africa's EPR law and Kenya's producer-responsibility draft demonstrate policy convergence that will tighten design standards and escalate demand for compliant rigid solutions. Investment incentives and lower labor costs attract extruder and injection-molding line relocations, positioning these regions as future export hubs within the rigid plastic packaging market.
- Amcor plc
- Alpha Packaging Holdings, Inc.
- ALPLA Werke Alwin Lehner GmbH & Co KG
- Silgan Holdings Inc.
- Sealed Air Corporation
- Plastipak Holdings, Inc.
- Sonoco Products Company
- Resilux NV
- Graham Packaging Company, L.P.
- Greif, Inc.
- Mauser Packaging Solutions Holding Company
- Pact Group Holdings Ltd
- Gerresheimer AG
- Huhtamaki Oyj
- Coveris Management GmbH
- Logoplaste Consultores Tecnicos SA
- International Paper Company (DS Smith Plc)
- Weener Plastics Group BV
- Anchor Packaging LLC
- Visy Industries Holdings Pty Ltd
- Altium Packaging LLC
- Serioplast Group SpA
- Mpact Limited
Additional Benefits:
- The market estimate (ME) sheet in Excel format
- 3 months of analyst support
TABLE OF CONTENTS
1 INTRODUCTION
- 1.1 Study Assumptions and Market Definition
- 1.2 Scope of the Study
2 RESEARCH METHODOLOGY
3 EXECUTIVE SUMMARY
4 MARKET LANDSCAPE
- 4.1 Market Overview
- 4.2 Market Drivers
- 4.2.1 Circular-economy mandates driving recycled-content packaging demand
- 4.2.2 Surge in e-commerce accelerating demand for impact-resistant ship-ready formats
- 4.2.3 Demographic shift toward smaller households fueling single-serve rigid packs
- 4.2.4 Adoption of high-barrier monomaterial solutions to meet 2027 EU recyclability targets
- 4.2.5 Rapid growth of cold-chain logistics requiring ultra-robust rigid containers
- 4.3 Market Restraints
- 4.3.1 Escalating polymer price volatility compressing converter margins
- 4.3.2 Increasing consumer shift to flexible and paper-based alternatives
- 4.3.3 Extended Producer Responsibility (EPR) fees raising total cost of ownership
- 4.3.4 Recycling-infrastructure gaps in emerging economies limiting PCR supply
- 4.4 Industry Value Chain Analysis
- 4.5 Regulatory Landscape
- 4.6 Technological Outlook
- 4.7 Impact of Macroeconomic Factors on the Market
- 4.8 Porter's Five Forces Analysis
- 4.8.1 Bargaining Power of Suppliers
- 4.8.2 Bargaining Power of Buyers/Consumers
- 4.8.3 Threat of New Entrants
- 4.8.4 Threat of Substitutes
- 4.8.5 Intensity of Competitive Rivalry
5 MARKET SIZE AND GROWTH FORECASTS (VALUE)
- 5.1 By Product Type
- 5.1.1 Bottles and Jars
- 5.1.2 Trays and Containers
- 5.1.3 Intermediate Bulk Containers (IBCs)
- 5.1.4 Pallets
- 5.1.5 Other Product Types
- 5.2 By Material
- 5.2.1 Polyethylene (PE)
- 5.2.2 Polyethylene Terephthalate (PET)
- 5.2.3 Polypropylene (PP)
- 5.2.4 Polystyrene (PS) and Expanded Polystyrene (EPS)
- 5.2.5 Bioplastics
- 5.2.6 Other Materials
- 5.3 By End User Industry
- 5.3.1 Food
- 5.3.2 Beverage
- 5.3.3 Healthcare
- 5.3.4 Cosmetics and Personal Care
- 5.3.5 Industrial
- 5.3.6 Building and Construction
- 5.3.7 Automotive
- 5.3.8 Other End-user Industries
- 5.4 By Manufacturing Process
- 5.4.1 Injection Molding
- 5.4.2 Extrusion Blow Molding
- 5.4.3 Injection Blow Molding
- 5.4.4 Stretch Blow Molding
- 5.4.5 Thermoforming
- 5.4.6 Rotational Molding
- 5.4.7 Compression Molding
- 5.5 By Geography
- 5.5.1 North America
- 5.5.1.1 United States
- 5.5.1.2 Canada
- 5.5.1.3 Mexico
- 5.5.2 South America
- 5.5.2.1 Brazil
- 5.5.2.2 Argentina
- 5.5.2.3 Mexico
- 5.5.2.4 Rest of South America
- 5.5.3 Europe
- 5.5.3.1 Germany
- 5.5.3.2 France
- 5.5.3.3 United Kingdom
- 5.5.3.4 Italy
- 5.5.3.5 Spain
- 5.5.3.6 Poland
- 5.5.3.7 Rest of Europe
- 5.5.4 Asia-Pacific
- 5.5.4.1 China
- 5.5.4.2 India
- 5.5.4.3 Japan
- 5.5.4.4 Thailand
- 5.5.4.5 Australia
- 5.5.4.6 South Korea
- 5.5.4.7 Rest of Asia-Pacific
- 5.5.5 Middle East and Africa
- 5.5.5.1 Middle East
- 5.5.5.1.1 Saudi Arabia
- 5.5.5.1.2 United Arab Emirates
- 5.5.5.1.3 Turkey
- 5.5.5.1.4 Rest of Middle East
- 5.5.5.2 Africa
- 5.5.5.2.1 South Africa
- 5.5.5.2.2 Nigeria
- 5.5.5.2.3 Egypt
- 5.5.5.2.4 Rest of Africa
- 5.5.5.1 Middle East
- 5.5.1 North America
6 COMPETITIVE LANDSCAPE
- 6.1 Market Concentration
- 6.2 Strategic Moves
- 6.3 Market Share Analysis
- 6.4 Company Profiles (includes Global level Overview, Market level overview, Core Segments, Financials as available, Strategic Information, Market Rank/Share for key companies, Products and Services, and Recent Developments)
- 6.4.1 Amcor plc
- 6.4.2 Alpha Packaging Holdings, Inc.
- 6.4.3 ALPLA Werke Alwin Lehner GmbH & Co KG
- 6.4.4 Silgan Holdings Inc.
- 6.4.5 Sealed Air Corporation
- 6.4.6 Plastipak Holdings, Inc.
- 6.4.7 Sonoco Products Company
- 6.4.8 Resilux NV
- 6.4.9 Graham Packaging Company, L.P.
- 6.4.10 Greif, Inc.
- 6.4.11 Mauser Packaging Solutions Holding Company
- 6.4.12 Pact Group Holdings Ltd
- 6.4.13 Gerresheimer AG
- 6.4.14 Huhtamaki Oyj
- 6.4.15 Coveris Management GmbH
- 6.4.16 Logoplaste Consultores Tecnicos SA
- 6.4.17 International Paper Company (DS Smith Plc)
- 6.4.18 Weener Plastics Group BV
- 6.4.19 Anchor Packaging LLC
- 6.4.20 Visy Industries Holdings Pty Ltd
- 6.4.21 Altium Packaging LLC
- 6.4.22 Serioplast Group SpA
- 6.4.23 Mpact Limited
7 MARKET OPPORTUNITIES AND FUTURE OUTLOOK
- 7.1 White-space and Unmet-need Assessment
 硬質塑膠包裝市場規模、佔有率、趨勢和預測:按產品、材料、製造程序、最終用途行業和地區分類,2026-2034年
 硬質塑膠包裝市場規模、佔有率和成長分析:按製造流程、原料、包裝類型、最終用戶和地區分類-2026-2033年產業預測
 硬質塑膠包裝市場:依產品類型、材料類型、製造流程和最終用途產業分類-2026-2032年全球市場預測
 硬質塑膠包裝市場分析及預測(至2035年):類型、產品類型、材質類型、技術、應用、最終用戶、功能、製程和設備
 全球硬質塑膠包裝市場規模、佔有率、趨勢和成長分析報告(2026-2034年)
 2026年全球硬質塑膠包裝市場報告
 硬質塑膠包裝市場報告:按材料類型、產品類型、最終用途產業和地區分類
 歐洲硬質塑膠包裝市場:市場佔有率分析、產業趨勢與統計、成長預測(2026-2031年)
 硬質塑膠包裝市場規模、佔有率和趨勢分析報告:按材料、產品、應用、地區和細分市場預測(2026-2033 年)
 硬質塑膠包裝的印度市場:類別,各流程,各產品,各終端用戶產業,各地區,機會,預測,2019年~2033年