


 |
市場調查報告書
商品編碼
1910629
工業標籤:市場佔有率分析、產業趨勢與統計、成長預測(2026-2031)Industrial Labels - Market Share Analysis, Industry Trends & Statistics, Growth Forecasts (2026 - 2031) |
||||||
※ 本網頁內容可能與最新版本有所差異。詳細情況請與我們聯繫。
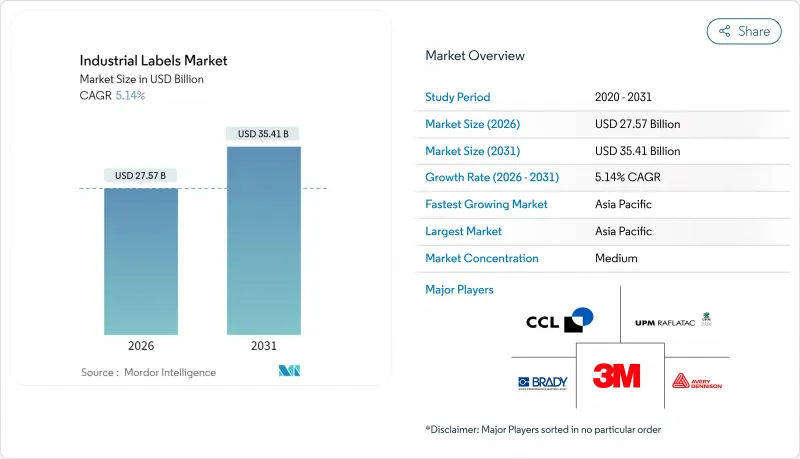
預計到 2025 年,工業標籤市場價值將達到 262.2 億美元,到 2026 年將達到 275.7 億美元,到 2031 年將達到 354.1 億美元,預測期(2026-2031 年)的複合年成長率為 5.14%。
這一成長動能凸顯了市場對可靠的產品識別、可追溯性和安全溝通的持續需求,而這種需求的驅動力來自日益嚴格的法規和數位化製造的擴張。新的合規要求、快速的電商物流以及數位和智慧印刷技術的加速應用,正在重塑加工商、原料供應商和設備製造商的成本結構和競爭策略。工業標籤市場受益於工廠自動化和物流可視化投資的增加,但聚合物和黏合劑價格的波動以及日益嚴格的VOC法規持續對利潤率構成壓力。總體而言,該行業呈現出成熟的終端用戶需求和新興創新領域均衡的組合,預計未來五年將共同支撐其保持個位數的溫和成長。
全球工業標籤市場趨勢與洞察
對食品和飲料合規標籤的需求日益成長
為遵守美國食品藥物管理局 (FDA) 將於 2026 年 1 月生效的食品可追溯性規則,製造商迫切需要使用能夠顯示2D條碼和序列化追溯批號的標籤。新的食品標籤法規將於 2028 年統一實施,這促使市場對能夠適應不斷變化的資料欄位的列印系統提出了更高的要求。市場對耐用、耐候且在整個低溫運輸中都能保持清晰可讀的基材的需求也不斷成長。2D條碼的普及性提高了印表機的解析度要求,而早期零售試點項目使用嵌入式 RFID 烘焙標籤,則展示了合規性和供應鏈最佳化之間的完美結合。隨著品牌對其生產線維修,工業標籤市場正迎來高規格食品級產品的激增。
電子商務和物流標籤的加速成長
自動化履約中心正在大規模應用ERP系統產生的可變資料標籤,這些標籤在機器人驅動的倉庫中穿梭,推動物流標籤市場以9.98%的複合年成長率成長。沃爾瑪的RFID擴展政策要求上游供應商在每個產品上嵌入編碼嵌體。具備即時定位功能的BLE標籤的廣泛應用,標誌著被動條碼正向支援人工智慧庫存管理演算法的物聯網標籤轉變。亞太地區跨境電商的快速成長進一步刺激了對能夠實現機器可讀且無誤識別的工業標籤的需求。
原料和黏合劑價格波動
聚乙烯醇價格的下跌趨勢與運費溢價交替出現,阻礙了亞太地區加工商的利潤規劃。黏合劑原料和矽膠襯紙的價格受石油和能源市場的影響而快速波動,導致合約頻繁重新談判。 2024年第四季採購報告指出,特種塗料供應不穩定,迫使加工商持有緩衝庫存,加劇了營運資金壓力。儘管需求強勁,但上述因素共同導致工業標籤市場整體成長略有放緩。
細分市場分析
由於其優異的耐化學性,聚合物標籤到 2025 年將保持 51.98% 的工業標籤市場佔有率,但預計紙基環保基材將以 9.38% 的複合年成長率超越它們,到 2031 年擴大其在工業標籤市場的佔有率。 PP 和 PET 薄膜由於其耐磨性,仍用於汽車、農藥和潤滑劑應用,但結合金屬和聚合物層的混合層壓材料正被用於惡劣環境。
對永續性的追求正在推動材料快速替代。 Carbon Action 的紙製品系列和麻纖維標籤紙可大幅減少環境影響。由水果廢棄物和堅果殼製成的紙製品實現了農產品的再利用,並受到高階食品品牌的青睞。一些先驅者在報價中加入了“生產過程開始前的排放”,這在工業標籤市場尚屬首例,以此來凸顯自身優勢。
到2025年,受日常消費品(FMCG)和製藥廠快速且靈活的標籤生產線的推動,壓敏膠標籤將佔據工業標籤市場43.05%的佔有率。同時,隨著吹塑成型和射出成型機在初級成型階段整合裝飾工藝,套模和熱轉印標籤的複合年成長率將達到8.78%。
無底紙標籤技術兼俱生產效率和永續性優勢,每卷標籤數量增加 80%,停機時間減少。 OptiCut WashOff 無底紙標籤在回收槽中可完全剝離,有助於建構閉合迴路PET 回收系統。相容機器人的貼標機進一步將這些技術整合到工業 4.0 生產線中,加速工業標籤市場的發展。
工業標籤市場報告按材料(聚合物/塑膠、金屬等)、機制(壓敏、黏合劑等)、產品類型(警告/安全標籤、資產標籤等)、印刷技術(類比、數位、混合、網版印刷等)、識別技術(條碼、RFID等)、電子用戶產業(食品飲料、電子終端等)和地區進行細分。市場預測以美元以金額為準。
區域分析
預計到2025年,亞太地區將佔據工業標籤市場38.10%的佔有率,並在2031年之前以8.52%的複合年成長率成長,這主要得益於電子、汽車和電子商務中心的擴張。中國和印度在產能擴張方面處於主導,而東南亞國協的優惠政策則促進了本地採購。政府主導的工業4.0計畫正在加速待開發區工廠採用智慧標籤,鞏固了該地區在全球工業標籤市場成長中的關鍵地位。
北美受益於完善的法規結構和大型零售商的強制性要求。艾利丹尼森位於克雷塔羅的RFID工廠表明,墨西哥已崛起為美國加工商的低成本供應合作夥伴。加拿大的VOC法規和美國對供應鏈安全的重視,推動了消費品和戰略性產業對標籤的強勁需求,增強了該地區工業標籤市場的穩定性。
在歐洲,嚴格的生態設計和廢棄物指令抑制了成熟市場的需求。隨著品牌所有者積極響應歐洲綠色交易的目標,可回收標籤創新技術正被儘早採用。德國在自動化領域的領先地位支撐著先進的生產設施,而英國脫歐後監管政策的差異則促使多語言和多格式標籤策略的出現。中東、非洲和南美洲的新興產業叢集發展軌跡不平衡,但對於那些尋求在新興工業標籤市場獲得先發優勢的加工商而言,這些地區仍然具有吸引力。
其他福利:
- Excel格式的市場預測(ME)表
- 3個月的分析師支持
目錄
第1章 引言
- 研究假設和市場定義
- 調查範圍
第2章調查方法
第3章執行摘要
第4章 市場情勢
- 市場概覽
- 市場促進因素
- 食品和飲料行業對合規標籤的需求日益成長
- 電子商務和物流標籤的加速成長
- 數位和混合印刷技術的快速普及
- 可追溯性和安全性方面的監理要求
- 工業4.0:智慧標籤與物聯網的融合
- 混合列印技術可實現大規模客製化
- 市場限制
- 原料和黏合劑價格波動;
- 針對塑膠和揮發性有機化合物(VOCs)的嚴格環境法規
- 數位色彩管理領域技術純熟勞工短缺
- 特種油墨和襯紙供應鏈中斷
- 供應鏈分析
- 監管環境
- 技術展望
- 波特五力分析
- 供應商的議價能力
- 買方的議價能力
- 新進入者的威脅
- 替代品的威脅
- 競爭對手之間的競爭
第5章 市場規模與成長預測
- 按原料
- 聚合物/塑膠標籤
- 金屬標籤
- 紙基環保基材
- 混合層壓板及其他
- 按組織
- 感壓標籤
- 黏合劑標籤
- 收縮套標
- 套模和熱轉印標籤
- 無底紙標籤
- 依產品類型
- 警告/安全標籤
- 資產和庫存標籤
- 品牌和促銷標籤
- 耐候耐用標籤
- 追蹤溯源(智慧/RFID)標籤
- 透過印刷技術
- 類比印刷
- 數位印刷
- 混合印刷
- 網版印刷
- 透過識別技術
- 條碼
- RFID
- NFC
- QR碼與2D碼
- 其他識別技術
- 按最終用戶行業分類
- 食品/飲料
- 電子設備和電器
- 汽車和運輸設備
- 醫療和藥品
- 化學品和危險材料
- 建築和重型設備
- 物流和倉儲管理
- 其他終端用戶產業
- 按地區
- 北美洲
- 美國
- 加拿大
- 墨西哥
- 歐洲
- 德國
- 英國
- 法國
- 義大利
- 西班牙
- 俄羅斯
- 其他歐洲地區
- 亞太地區
- 中國
- 印度
- 日本
- 韓國
- 澳洲和紐西蘭
- 亞太其他地區
- 中東和非洲
- 中東
- 阿拉伯聯合大公國
- 沙烏地阿拉伯
- 土耳其
- 其他中東地區
- 非洲
- 南非
- 奈及利亞
- 埃及
- 其他非洲地區
- 中東
- 南美洲
- 巴西
- 阿根廷
- 其他南美洲
- 北美洲
第6章 競爭情勢
- 市場集中度
- 策略舉措與發展
- 市佔率分析
- 公司簡介
- Avery Dennison Corporation
- CCL Industries Inc.
- 3M Company
- Brady Corporation
- UPM Raflatac
- DuPont de Nemours Inc.
- Brook+Whittle Ltd
- Multi-Color Corporation
- Fuji Seal International
- Honeywell International Inc.
- SATO Holdings Corporation
- Zebra Technologies Corporation
- Lintec Corporation
- TSC Auto ID Technology
- Checkpoint Systems Inc.
- DIC Corporation
- Skanem Group
- Weber Packaging Solutions
- Resource Label Group
- Smartrac Technology GmbH
第7章 市場機會與未來展望
The industrial labels market was valued at USD 26.22 billion in 2025 and estimated to grow from USD 27.57 billion in 2026 to reach USD 35.41 billion by 2031, at a CAGR of 5.14% during the forecast period (2026-2031).
This growth momentum underscores sustained demand for reliable product identification, traceability, and safety communication as regulations tighten and digital manufacturing expands. New compliance mandates, rapid e-commerce fulfillment, and accelerating adoption of digital and smart printing technologies are reshaping cost structures and competitive strategies across converters, raw-material suppliers, and equipment manufacturers. The industrial labels market benefits from rising investment in factory automation and logistics visibility, yet pricing volatility for polymers and adhesives and stricter VOC limits continue to pressure margins. Overall, the sector demonstrates a balanced mix of mature end-use demand and emerging innovation pockets that collectively support mid-single-digit growth over the next five years.
Global Industrial Labels Market Trends and Insights
Rising demand from food and beverage compliance labelling
Manufacturers face imminent January 2026 enforcement of the FDA Food Traceability Rule, forcing adoption of labels capable of carrying 2D codes and serialized Traceability Lot Codes.Uniform compliance dates set for new food labeling rules in 2028 heighten the need for print systems that flex with evolving data fields. Demand is rising for durable, weather-resistant substrates that stay legible across cold chains. The push toward 2D barcodes is increasing printer resolution requirements, and early retail pilots with RFID-embedded bakery labels illustrate how compliance intersects with supply-chain optimization. As brands retrofit lines, the industrial labels market records a surge in high-specification food-grade products.
Accelerating e-commerce and logistics labelling growth
Automated fulfillment centers are scaling variable-data labels that originate in ERP systems and travel through robotics-driven warehouses, aligning with a 9.98% CAGR in logistics labeling. Walmart's expanded RFID directive compels upstream suppliers to embed encoded inlays at item level. Real-time location sensing printed BLE labels show how IoT-ready tags are replacing passive barcodes to meet AI-powered inventory algorithms. APAC's booming cross-border e-commerce further accelerates industrial labels market demand for machine-readable, error-free identification.
Volatile raw-material and adhesive pricing
Downward swings in polyvinyl alcohol costs, interspersed with freight surcharges, hamper profit planning in Asia-Pacific converting hubs. Contract renegotiations become frequent as adhesive feedstocks and silicone liners move sharply with oil and energy markets. Q4 2024 sourcing reports flag erratic availability of specialty coatings, prompting converters to hold buffer inventories that erode working capital. Combined, these shocks slightly temper overall industrial labels market expansion despite healthy demand.
Other drivers and restraints analyzed in the detailed report include:
- Rapid adoption of digital and hybrid printing technologies
- Regulatory mandates for traceability and safety
- Stringent environmental regulations on plastics and VOCs
For complete list of drivers and restraints, kindly check the Table Of Contents.
Segment Analysis
Polymer labels retained 51.98% industrial labels market share in 2025 due to superior chemical resistance, yet paper-based eco substrates are set to outpace with a 9.38% CAGR, lifting their slice of industrial labels market size through 2031. Automotive, agrochemical, and lubricants applications still rely on PP and PET films for abrasion resistance, while hybrid laminates combine metal and polymer layers for extreme environments.
Sustainability imperatives are catalyzing rapid material substitution. Carbon-action paper lines and hemp-fiber label stocks demonstrate measurable footprint reductions. Fruit-waste and nut-shell papers repurpose agricultural by-products, appealing to premium food brands. Early adopters differentiate by reporting cradle-to-gate emissions in quotations, a first in the industrial labels market.
Pressure-sensitive constructions led with 43.05% industrial labels market share in 2025 on the strength of fast, flexible application lines across FMCG and pharma plants. Concurrently, in-mold and heat-transfer labels present an 8.78% CAGR as blow-molders and injection molders integrate decoration into primary forming.
Linerless technology illustrates dual gains in productivity and sustainability, providing 80% more labels per roll and reducing downtime. OptiCut WashOff linerless labels detach cleanly in recycling baths, aiding closed-loop PET systems. Robotics-ready applicators further integrate these mechanisms into Industry 4.0 lines, enhancing industrial labels market adoption.
The Industrial Labels Market Report is Segmented by Raw Material (Polymer/Plastic, Metal, and More), Mechanism (Pressure-Sensitive, Glue-Applied, and More), Product Type (Warning/Security, Asset Tags, and More), Printing Technology (Analog, Digital, Hybrid, Screen), Identification Technology (Barcode, RFID, and More), End-User Industry (Food/Beverage, Electronics, and More), and Geography. Market Forecasts in Value (USD).
Geography Analysis
Asia-Pacific dominated with 38.10% industrial labels market share in 2025 and is projected to compound at 8.52% through 2031 thanks to expanding electronics, automotive, and e-commerce hubs. China and India spearhead capacity additions, while ASEAN incentives attract near-shoring. Government Industry 4.0 programs accelerate smart-label adoption inside new greenfield plants, cementing the region's pivotal role in global industrial labels market growth.
North America benefits from entrenched regulatory frameworks and big-box retail mandates. Avery Dennison's Queretaro RFID plant underscores Mexico's ascent as a low-cost supply partner for U.S. converters Averydennison. Canadian VOC controls and the U.S. emphasis on supply-chain security keep label demand resilient across consumer and strategic industries, reinforcing regional industrial labels market stability.
Europe exhibits mature demand moderated by strict eco-design and waste directives. Recyclable label innovations enjoy early adoption as brand owners align with European Green Deal goals. Germany's automation leadership sustains high-spec production tools, while UK regulatory divergence post-Brexit prompts multi-language, multi-format label strategies. Emerging clusters in the Middle East & Africa and South America show variable trajectories but remain attractive for converters seeking first-mover gains in developing industrial labels markets.
- Avery Dennison Corporation
- CCL Industries Inc.
- 3M Company
- Brady Corporation
- UPM Raflatac
- DuPont de Nemours Inc.
- Brook + Whittle Ltd
- Multi-Color Corporation
- Fuji Seal International
- Honeywell International Inc.
- SATO Holdings Corporation
- Zebra Technologies Corporation
- Lintec Corporation
- TSC Auto ID Technology
- Checkpoint Systems Inc.
- DIC Corporation
- Skanem Group
- Weber Packaging Solutions
- Resource Label Group
- Smartrac Technology GmbH
Additional Benefits:
- The market estimate (ME) sheet in Excel format
- 3 months of analyst support
TABLE OF CONTENTS
1 INTRODUCTION
- 1.1 Study Assumptions and Market Definition
- 1.2 Scope of the Study
2 RESEARCH METHODOLOGY
3 EXECUTIVE SUMMARY
4 MARKET LANDSCAPE
- 4.1 Market Overview
- 4.2 Market Drivers
- 4.2.1 Rising demand from food and beverage compliance labelling
- 4.2.2 Accelerating e-commerce and logistics labelling growth
- 4.2.3 Rapid adoption of digital and hybrid printing technologies
- 4.2.4 Regulatory mandates for traceability and safety
- 4.2.5 Industry 4.0 integration of smart labels and IoT
- 4.2.6 Hybrid printing enabling mass-customisation
- 4.3 Market Restraints
- 4.3.1 Volatile raw-material and adhesive pricing
- 4.3.2 Stringent environmental regulations on plastics and VOCs
- 4.3.3 Skilled-labour shortage in digital colour management
- 4.3.4 Supply-chain disruptions for specialty inks and liners
- 4.4 Supply-Chain Analysis
- 4.5 Regulatory Landscape
- 4.6 Technological Outlook
- 4.7 Porter's Five Forces Analysis
- 4.7.1 Bargaining Power of Suppliers
- 4.7.2 Bargaining Power of Buyers
- 4.7.3 Threat of New Entrants
- 4.7.4 Threat of Substitutes
- 4.7.5 Intensity of Competitive Rivalry
5 MARKET SIZE AND GROWTH FORECASTS (VALUE)
- 5.1 By Raw Material
- 5.1.1 Polymer / Plastic Labels
- 5.1.2 Metal Labels
- 5.1.3 Paper-based Eco Substrates
- 5.1.4 Hybrid Laminates and Others
- 5.2 By Mechanism
- 5.2.1 Pressure-Sensitive Labeling
- 5.2.2 Glue-Applied Labeling
- 5.2.3 Shrink-Sleeve Labeling
- 5.2.4 In-Mold and Heat-Transfer Labeling
- 5.2.5 Liner-less Labeling
- 5.3 By Product Type
- 5.3.1 Warning / Security Labels
- 5.3.2 Asset and Inventory Tags
- 5.3.3 Branding and Promotional Labels
- 5.3.4 Weather-proof and Durable Labels
- 5.3.5 Track-and-Trace (Smart / RFID) Labels
- 5.4 By Printing Technology
- 5.4.1 Analog Printing
- 5.4.2 Digital Printing
- 5.4.3 Hybrid Printing
- 5.4.4 Screen Printing
- 5.5 By Identification Technology
- 5.5.1 Barcode
- 5.5.2 RFID
- 5.5.3 NFC
- 5.5.4 QR and 2-D Codes
- 5.5.5 Other Identification Technology
- 5.6 By End-user Industry
- 5.6.1 Food and Beverage
- 5.6.2 Electronics and Electricals
- 5.6.3 Automotive and Transportation
- 5.6.4 Healthcare and Pharmaceuticals
- 5.6.5 Chemicals and Hazardous Goods
- 5.6.6 Construction and Heavy Equipment
- 5.6.7 Logistics and Warehousing
- 5.6.8 Other End-user Industry
- 5.7 By Geography
- 5.7.1 North America
- 5.7.1.1 United States
- 5.7.1.2 Canada
- 5.7.1.3 Mexico
- 5.7.2 Europe
- 5.7.2.1 Germany
- 5.7.2.2 United Kingdom
- 5.7.2.3 France
- 5.7.2.4 Italy
- 5.7.2.5 Spain
- 5.7.2.6 Russia
- 5.7.2.7 Rest of Europe
- 5.7.3 Asia-Pacific
- 5.7.3.1 China
- 5.7.3.2 India
- 5.7.3.3 Japan
- 5.7.3.4 South Korea
- 5.7.3.5 Australia and New Zealand
- 5.7.3.6 Rest of Asia-Pacific
- 5.7.4 Middle East and Africa
- 5.7.4.1 Middle East
- 5.7.4.1.1 United Arab Emirates
- 5.7.4.1.2 Saudi Arabia
- 5.7.4.1.3 Turkey
- 5.7.4.1.4 Rest of Middle East
- 5.7.4.2 Africa
- 5.7.4.2.1 South Africa
- 5.7.4.2.2 Nigeria
- 5.7.4.2.3 Egypt
- 5.7.4.2.4 Rest of Africa
- 5.7.4.1 Middle East
- 5.7.5 South America
- 5.7.5.1 Brazil
- 5.7.5.2 Argentina
- 5.7.5.3 Rest of South America
- 5.7.1 North America
6 COMPETITIVE LANDSCAPE
- 6.1 Market Concentration
- 6.2 Strategic Moves and Developments
- 6.3 Market Share Analysis
- 6.4 Company Profiles (includes Global level Overview, Market level overview, Core Segments, Financials as available, Strategic Information, Market Rank/Share for key companies, Products and Services, and Recent Developments)
- 6.4.1 Avery Dennison Corporation
- 6.4.2 CCL Industries Inc.
- 6.4.3 3M Company
- 6.4.4 Brady Corporation
- 6.4.5 UPM Raflatac
- 6.4.6 DuPont de Nemours Inc.
- 6.4.7 Brook + Whittle Ltd
- 6.4.8 Multi-Color Corporation
- 6.4.9 Fuji Seal International
- 6.4.10 Honeywell International Inc.
- 6.4.11 SATO Holdings Corporation
- 6.4.12 Zebra Technologies Corporation
- 6.4.13 Lintec Corporation
- 6.4.14 TSC Auto ID Technology
- 6.4.15 Checkpoint Systems Inc.
- 6.4.16 DIC Corporation
- 6.4.17 Skanem Group
- 6.4.18 Weber Packaging Solutions
- 6.4.19 Resource Label Group
- 6.4.20 Smartrac Technology GmbH
7 MARKET OPPORTUNITIES AND FUTURE OUTLOOK
- 7.1 White-space and Unmet-need Assessment


