


 |
市場調查報告書
商品編碼
1910562
石腦油:市場佔有率分析、產業趨勢與統計、成長預測(2026-2031)Naphtha - Market Share Analysis, Industry Trends & Statistics, Growth Forecasts (2026 - 2031) |
||||||
※ 本網頁內容可能與最新版本有所差異。詳細情況請與我們聯繫。
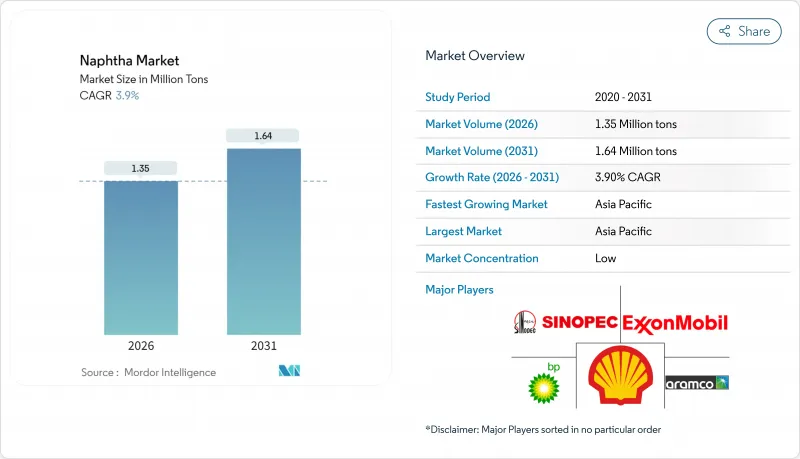
預計石腦油市場將從 2025 年的 130 萬噸成長到 2026 年的 135 萬噸,到 2031 年將達到 164 萬噸,2026 年至 2031 年的複合年成長率為 3.9%。
石腦油作為烯烴和芳烴的主要石化原料,其需求受到支撐;而大型蒸汽裂解裝置傾向於使用輕質餾分油以提高乙烯產率,進一步強化了這一需求。美國墨西哥灣沿岸冷凝油分離裝置的投資以及亞洲新建一體化煉油廠正在重塑全球貿易流量,而新增的生物石腦油產能則提供了一種補充性的低碳供應來源。主要煉油企業正將上游原油供應與下游石化轉化結合,以在整個價值鏈上創造價值。然而,原油-石腦油價差的波動、天然氣液作為替代原料日益成長的吸引力以及日益嚴格的碳排放法規,都為利潤率穩定性和資本配置決策帶來了不確定性。
全球石腦油市場趨勢與洞察
亞洲蒸氣裂解裝置推動烯烴和芳烴原料需求激增
在中國,運作大型裂解裝置正在投產,以提升輕質石腦油的消費量,因為石蠟餾分能最大限度地提高乙烯產量。這些新裝置到2028年的總煉油能力將達到每日80萬至110萬桶,其設計包含整合的冷凝油分離裝置,旨在提高石腦油的收率。恆力石化和福建石化的產能擴張將維持需求的成長趨勢,並導致高凝析油含量原油進口的結構性成長,使區域價格與更廣泛的石腦油市場價格接軌。供應安全獎勵促使中東生產商與亞洲裂解裝置營運商簽署了長期承購協議,進一步加強了區域價值鏈。淨收益計算表明,每新增一套蒸汽裂解裝置,區域輕質石腦油需求每年將增加150萬噸,證實了這一促進因素對整體成長的顯著貢獻。
中東石腦油重整裝置與煉油廠升級改造計劃的整合
巴林石油公司(Bapco)的現代化計畫和沙烏地阿美投資110億美元的阿米拉爾煉油廠項目,標誌著一種戰略轉變,即位置混合原料裂解裝置和催化重整裝置,以提高汽油辛烷值和芳烴的產量。這種模式將傳統上流入車用燃料池的直餾石腦油轉化為高利潤的石化產品,從而提高煉油廠的整體毛利率。此外,透過共用公用設施,此一體化專案還將提高能源效率,並提供靈活的原料選擇,以降低利潤波動。光是阿米拉爾煉油廠每年就需要約500萬噸石腦油,這將使該地區成為亞洲的重要供應地,有助於實現更緊密的區域供需平衡,並支持更強勁的石腦油市場。
原油-石腦油價差的波動對裂解利潤帶來壓力。
地緣政治事件和煉廠運作導致石腦油裂解價差劇烈波動,對煉廠營運計畫帶來挑戰,並迫使煉廠削減產能。 2024年初,亞丁灣成品油輪遭襲擊事件將亞洲石腦油裂解價推至兩年來的最高點,但隨著套利貨物的到來,價差迅速回落。自2019年以來,美國煉廠產能仍比尖峰時段低62萬桶/日,全球供應緩衝不足,加劇了市場波動。在不利條件下,這種波動可能導致煉廠運轉率下降高達8%,增加貿易商的營運資金需求,並限制石腦油市場擴張。
細分市場分析
2025年,輕質石腦油佔全球石腦油市場的57.62%,主要歸功於其高石蠟含量,而現代裂解裝置偏好這種高石蠟含量的原料,因為它能獲得更高的乙烯產率。預計到2031年,該細分市場將以4.55%的複合年成長率成長,成為各餾分油中成長最快的。美國和亞洲的冷凝油油分離器擴建計畫旨在生產符合裂解裝置原料要求的石蠟餾分油,這進一步鞏固了該細分市場在石腦油市場的主導地位。每10萬桶/日的分離器大約生產3萬桶/日的輕質石腦油,這形成了供需緊張的局面,並支撐了其相對於汽油級原料的溢價。一體化業者正在將裂解液與重整裝置的產出混合,以對沖利潤週期波動並提高整體資產運轉率。
由於重質石腦油芳烴含量高、乙烯轉化率低,其市場成長較為溫和,僅達個位數。然而,它仍然是催化重整裝置提高辛烷值以及生產苯、甲苯和二甲苯的重要原料。對鉑錫和鉑錸雙金屬催化劑的投資提高了重整裝置的重質餾分耐受性,擴大了重質原料的處理能力。隨著汽油價差收窄,煉油商利用芳烴銷售協議來變現重質餾分,從而維持了其對石腦油市場的支撐作用,但其貢獻有減弱。
石腦油市場報告按類型(輕質石腦油和重質石腦油)、來源(煉廠來源、生物石腦油及其他)、終端用戶行業(石油化工、農業、油漆塗料、航太及其他)和地區(亞太、北美、歐洲、南美以及中東和非洲)進行細分。市場預測以噸為單位。
區域分析
到2025年,亞太地區將佔全球石腦油市場佔有率的43.65%,預計到2031年將以4.65%的複合年成長率成長,這主要得益於石化產品和化肥行業的同步成長。預計到2023年,中國原油加工量將達到創紀錄的1,480萬桶/日,進一步增強其原料自給能力;而印度的聚合物需求預計到2028年將達到3,500萬噸。沙烏地阿美持有恆力石化10%的股份,加上福建計劃,將進一步推動區域一體化,把中東的供應與東亞不斷成長的需求連結起來。
由於對冷凝油分離裝置的投資以及頁岩油產量的增加,北美輕質石腦油持續面臨結構性供應過剩。預計美國煉油產能將在2023年成長2%,並在2024年初達到每日1,840萬桶的名義運作產能。然而,由於液態天然氣(NGL)供應激增,分流了部分石化產品需求,該地區的石腦油市場擴張速度正在放緩。對拉丁美洲出口的成長以及偶爾對歐洲的套利貿易正在抵消季節性供應過剩的影響。
隨著可再生燃料生產取代化石原料,歐洲對石腦油的需求將略有下降,但剩餘的重整產能將繼續提供芳烴和高辛烷值汽油調和成分。煉油廠正在維修現有設施以生產HVO(高純度生物柴油)和SAF(永續航空燃料),而不是新建設施,從而騰出空間投資於旨在減少傳統石腦油排放的碳捕獲試點項目。中東將利用一體化重整-裂解計劃,在套利機會出現時,將自己定位為亞洲和歐洲的邊緣供應商。南美和非洲正透過奈及利亞的丹格特煉油廠等計劃擴大其影響力,該煉油廠將生產高達8萬桶/日的汽油和石腦油,逐步改變該地區的貿易平衡。
其他福利:
- Excel格式的市場預測(ME)表
- 3個月的分析師支持
目錄
第1章 引言
- 研究假設和市場定義
- 調查範圍
第2章調查方法
第3章執行摘要
第4章 市場情勢
- 市場概覽
- 市場促進因素
- 亞洲蒸氣裂解裝置對烯烴和芳烴原料的需求激增
- 中東石腦油重整裝置與煉油廠升級改造計劃的整合
- 印度化肥需求不斷成長
- 美國沿岸地區輕質石腦油生產用冷凝油油分離器投資增加
- 透過可再生燃料強制政策擴大生物石腦油的規模
- 市場限制
- 美國對液態天然氣(NGL)的需求
- 原油/石腦油價格差的波動對裂解利潤帶來壓力。
- 監管部門大力推動低碳替代材料和再生材料
- 價值鏈分析
- 波特五力分析
- 供應商的議價能力
- 消費者議價能力
- 新進入者的威脅
- 替代品的威脅
- 競爭對手之間的競爭
- 原料分析
第5章 市場規模及成長預測(數量與價值)
- 按類型
- 輕石腦油
- 重石腦油
- 按來源
- 煉油廠
- 生物石腦油
- 其他
- 按最終用戶行業分類
- 石油化學產品
- 農業
- 油漆和塗料
- 航太工業
- 其他行業
- 按地區
- 亞太地區
- 中國
- 印度
- 日本
- 韓國
- 亞太其他地區
- 北美洲
- 美國
- 加拿大
- 墨西哥
- 歐洲
- 德國
- 英國
- 法國
- 義大利
- 其他歐洲地區
- 南美洲
- 巴西
- 阿根廷
- 其他南美洲
- 中東和非洲
- 沙烏地阿拉伯
- 阿拉伯聯合大公國
- 南非
- 奈及利亞
- 其他中東和非洲地區
- 亞太地區
第6章 競爭情勢
- 市場集中度
- 策略趨勢
- 市佔率分析
- 公司簡介
- Alexandria Mineral Oils Company
- BP plc
- Chevron Phillips Chemical Company LLC
- China Petrochemical Corporation
- CNPC
- ENEOS Holdings Inc.
- Exxon Mobil Corporation
- Formosa Petrochemical Corporation
- Idemitsu Kosan Co.,Ltd.
- Indian Oil Corporation Ltd.
- Kuwait Petroleum Corporation
- LG Chem
- LyondellBasell Industries Holdings BV
- MGT Petroil
- PetroChina Company Limited
- Petroleos Mexicanos
- PTT Global Chemical Public Company Limited
- QatarEnergy
- Reliance Industries Limited
- SABIC
- Sasol Limited
- Saudi Arabian Oil Co.
- Shell plc
- SK Inc.
- TotalEnergies
第7章 市場機會與未來展望
The Naphtha market is expected to grow from 1.30 million tons in 2025 to 1.35 million tons in 2026 and is forecast to reach 1.64 million tons by 2031 at 3.9% CAGR over 2026-2031.
Demand is anchored by naphtha's role as the dominant petrochemical feedstock for olefins and aromatics, a position reinforced by large-scale steam crackers that prefer light fractions for higher ethylene yields. Investments in condensate splitters along the U.S. Gulf Coast and new integrated refineries in Asia are reshaping global trade flows, while bio-naphtha capacity additions provide a complementary, low-carbon supply stream. Leading refiners integrate upstream crude supply with downstream petrochemical conversion to capture value across the chain. However, volatile crude-naphtha spreads, the growing appeal of natural gas liquids as alternative feedstocks, and increasingly stringent carbon regulations inject uncertainty into margin stability and capital-allocation decisions.
Global Naphtha Market Trends and Insights
Surging Demand for Olefins and Aromatics Feedstocks from Asian Steam Crackers
China is commissioning a wave of mega-crackers that elevate consumption of light naphtha because its paraffinic composition maximizes ethylene output. New capacity totaling 0.8-1.1 million b/d of refining throughput by 2028 is designed with integrated condensate splitters that raise naphtha yield ratios. Capacity additions at Hengli Petrochemical and Fujian Petrochemical will maintain upward demand momentum, translating into structurally higher imports of condensate-rich crudes and driving regional price alignment with the broader naphtha market. Supply security incentives are prompting long-term offtake agreements between Middle-East producers and Asian crackers, further knitting regional value chains. Net-back calculations suggest that each incremental steam cracker complex boosts regional light naphtha requirements by 1.5 million tons annually, underpinning the driver's substantial contribution to overall growth.
Integration of Naphtha Reformers with Refinery Upgrading Projects in the Middle East
Bahrain's Bapco Modernization Programme and Saudi Aramco's USD 11 billion AMIRAL complex illustrate the strategic shift toward co-locating catalytic reformers with mixed-feed crackers to enhance gasoline octane and aromatic output. The model diverts straight-run naphtha that previously entered the motor-fuel pool into higher-margin petrochemical streams, improving overall refinery gross margins. Integration delivers energy-efficiency gains through shared utilities and furnishes flexible feedstock menus that dampen margin volatility. With AMIRAL alone requiring about 5 million tons of naphtha annually, the region becomes a swing supplier to Asia, tightening inter-regional balances and supporting a more robust naphtha market.
Volatile Crude-Naphtha Spreads Undermining Crack Margins
Geopolitical incidents and refining capacity outages drive sharp swings in naphtha crack spreads, challenging refinery scheduling and prompting throughput cuts. An attack on a product tanker in the Gulf of Aden sent Asian naphtha cracks to a two-year high in early 2024, yet spreads retraced swiftly as arbitrage cargoes arrived. With post-2019 U.S. refinery capacity still 620,000 b/d below the peak, global supply buffers remain thin, magnifying volatility. This instability dampens refinery utilization rates by up to 8% in adverse periods and raises working-capital requirements for traders, tempering naphtha market expansion.
Other drivers and restraints analyzed in the detailed report include:
- Rising Demand for Fertilizers in India
- Bio-Naphtha Scale-up Backed by Renewable-Fuel Mandates
- Regulatory Push for Low-Carbon Alternatives and Recycled Feedstocks
For complete list of drivers and restraints, kindly check the Table Of Contents.
Segment Analysis
Light naphtha generated 57.62% of the global naphtha market in 2025 as modern crackers favor its high paraffin content for superior ethylene yield. The segment is projected to grow at 4.55% CAGR to 2031, the briskest pace among cut types. Condensate splitter expansions in the United States and Asia are calibrated to produce paraffinic cuts that align with cracker slate requirements, reinforcing segment leadership in the naphtha market. Each 100,000 b/d splitter yields around 30,000 b/d of light naphtha, tightening balances and supporting premiums to gasoline-grade material. Integrated operators blend splitter streams with reformer output to hedge margin cycles and improve overall asset utilization.
Heavy naphtha lags with mid-single-digit growth owing to its higher aromatic content and lower ethylene productivity. Nonetheless, it remains an essential feedstock for catalytic reformers that upgrade octane and generate benzene, toluene, and xylenes. Investments in platinum-tin and platinum-rhenium bimetallic catalysts improve reformer severity tolerance, widening the processing window for heavier grades. Refiners leverage aromatics marketing agreements to monetize heavy cuts when gasoline spreads compress, preserving a supportive though less dynamic contribution to the naphtha market.
The Naphtha Market Report is Segmented by Type (Light Naphtha and Heavy Naphtha), Source (Refinery-Based, Bio-Naphtha, and Others), End-User Industry (Petrochemicals, Agriculture, Paints and Coatings, Aerospace, and Other Industries), and Geography (Asia Pacific, North America, Europe, South America, and Middle East and Africa). The Market Forecasts are Provided in Terms of Volume (tons).
Geography Analysis
Asia-Pacific led the naphtha market with 43.65% share in 2025, and its 4.65% forecast CAGR to 2031 stems from synchronized growth in petrochemicals and fertilizers. China processed a record 14.8 million b/d of crude in 2023, underpinning self-sufficiency in feedstocks, while India's polymer demand is on track to hit 35 million tons by 2028. Aramco's 10% stake in Hengli Petrochemical and the Fujian project further expand regional integration, aligning Middle-East supply with East-Asian demand growth.
North America remains structurally long light naphtha due to condensate splitter investments and rising shale liquids output. U.S. refining capacity climbed 2% in 2023, taking operable nameplate to 18.4 million b/d at the start of 2024. Yet surging NGL availability diverts petrochemical demand, moderating the regional naphtha market expansion pace. Export growth into Latin America and occasional arbitrage to Europe balances seasonal surpluses.
Europe's naphtha demand contracts modestly as renewable fuel production displaces fossil feedstocks, but residual reformer capacity supplies aromatics chains and high-octane gasoline blendstocks. Refiners retrofit existing units for HVO and SAF rather than building greenfield assets, freeing investment for carbon-capture pilots that lower the embedded emissions of conventional naphtha. The Middle East capitalizes on integration projects that couple reformers and crackers, positioning itself as the marginal supplier into Asia and Europe when arbitrage windows open. South America and Africa gain influence through projects such as Nigeria's Dangote refinery, which will produce up to 80 kbd of gasoline and naphtha, gradually transforming regional trade balances.
- Alexandria Mineral Oils Company
- BP p.l.c.
- Chevron Phillips Chemical Company LLC
- China Petrochemical Corporation
- CNPC
- ENEOS Holdings Inc.
- Exxon Mobil Corporation
- Formosa Petrochemical Corporation
- Idemitsu Kosan Co.,Ltd.
- Indian Oil Corporation Ltd.
- Kuwait Petroleum Corporation
- LG Chem
- LyondellBasell Industries Holdings B.V.
- MGT Petroil
- PetroChina Company Limited
- Petroleos Mexicanos
- PTT Global Chemical Public Company Limited
- QatarEnergy
- Reliance Industries Limited
- SABIC
- Sasol Limited
- Saudi Arabian Oil Co.
- Shell plc
- SK Inc.
- TotalEnergies
Additional Benefits:
- The market estimate (ME) sheet in Excel format
- 3 months of analyst support
TABLE OF CONTENTS
1 Introduction
- 1.1 Study Assumptions and Market Definition
- 1.2 Scope of the Study
2 Research Methodology
3 Executive Summary
4 Market Landscape
- 4.1 Market Overview
- 4.2 Market Drivers
- 4.2.1 Surging Demand for Olefins and Aromatics Feedstocks from Asian Steam Crackers
- 4.2.2 Integration of Naphtha Reformers with Refinery Upgrading Projects in the Middle East
- 4.2.3 Rising Demand for Fertilizers in India
- 4.2.4 Rising Investments in USGC Condensate Splitters Targeting Light Naphtha Output
- 4.2.5 Bio-Naphtha Scale-up Backed by Renewable-Fuel Mandates
- 4.3 Market Restraints
- 4.3.1 Natural Gas Liquid Demand in the United States
- 4.3.2 Volatile Crude-Naphtha Spreads Undermining Crack Margins
- 4.3.3 Regulatory Push for Low-Carbon Alternatives and Recycled Feedstocks
- 4.4 Value Chain Analysis
- 4.5 Porter's Five Forces Analysis
- 4.5.1 Bargaining Power of Suppliers
- 4.5.2 Bargaining Power of Consumers
- 4.5.3 Threat of New Entrants
- 4.5.4 Threat of Substitutes
- 4.5.5 Intensity of Competitive Rivalry
- 4.6 Feedstock Analysis
5 Market Size and Growth Forecasts (Volume and Value)
- 5.1 By Type
- 5.1.1 Light Naphtha
- 5.1.2 Heavy Naphtha
- 5.2 By Source
- 5.2.1 Refinery-Based
- 5.2.2 Bio-Naphtha
- 5.2.3 Others
- 5.3 By End-user Industry
- 5.3.1 Petrochemicals
- 5.3.2 Agriculture
- 5.3.3 Paints and Coatings
- 5.3.4 Aerospace
- 5.3.5 Other Industries
- 5.4 By Geography
- 5.4.1 Asia-Pacific
- 5.4.1.1 China
- 5.4.1.2 India
- 5.4.1.3 Japan
- 5.4.1.4 South Korea
- 5.4.1.5 Rest of Asia-Pacific
- 5.4.2 North America
- 5.4.2.1 United States
- 5.4.2.2 Canada
- 5.4.2.3 Mexico
- 5.4.3 Europe
- 5.4.3.1 Germany
- 5.4.3.2 United Kingdom
- 5.4.3.3 France
- 5.4.3.4 Italy
- 5.4.3.5 Rest of Europe
- 5.4.4 South America
- 5.4.4.1 Brazil
- 5.4.4.2 Argentina
- 5.4.4.3 Rest of South America
- 5.4.5 Middle East and Africa
- 5.4.5.1 Saudi Arabia
- 5.4.5.2 United Arab Emirates
- 5.4.5.3 South Africa
- 5.4.5.4 Nigeria
- 5.4.5.5 Rest of Middle East and Africa
- 5.4.1 Asia-Pacific
6 Competitive Landscape
- 6.1 Market Concentration
- 6.2 Strategic Moves
- 6.3 Market Share Analysis
- 6.4 Company Profiles {(includes Global level Overview, Market level overview, Core Segments, Financials as available, Strategic Information, Market Rank/Share for key companies, Products and Services, and Recent Developments)}
- 6.4.1 Alexandria Mineral Oils Company
- 6.4.2 BP p.l.c.
- 6.4.3 Chevron Phillips Chemical Company LLC
- 6.4.4 China Petrochemical Corporation
- 6.4.5 CNPC
- 6.4.6 ENEOS Holdings Inc.
- 6.4.7 Exxon Mobil Corporation
- 6.4.8 Formosa Petrochemical Corporation
- 6.4.9 Idemitsu Kosan Co.,Ltd.
- 6.4.10 Indian Oil Corporation Ltd.
- 6.4.11 Kuwait Petroleum Corporation
- 6.4.12 LG Chem
- 6.4.13 LyondellBasell Industries Holdings B.V.
- 6.4.14 MGT Petroil
- 6.4.15 PetroChina Company Limited
- 6.4.16 Petroleos Mexicanos
- 6.4.17 PTT Global Chemical Public Company Limited
- 6.4.18 QatarEnergy
- 6.4.19 Reliance Industries Limited
- 6.4.20 SABIC
- 6.4.21 Sasol Limited
- 6.4.22 Saudi Arabian Oil Co.
- 6.4.23 Shell plc
- 6.4.24 SK Inc.
- 6.4.25 TotalEnergies
7 Market Opportunities and Future Outlook
- 7.1 White-space and Unmet-Need Assessment
 生物基石腦油市場規模、佔有率和成長分析:按原料、產品類型、應用、製造技術、終端用戶產業、分銷管道和地區分類-2026-2033年產業預測
 石腦油市場:2026-2032年全球市場預測(依產品類型、原料、應用、最終用途及通路分類)
 全球可再生石腦油市場規模、佔有率、趨勢和成長分析報告(2026-2034年)
 2026-2030年全球石腦油市場
 石腦油市場分析及預測(至2035年):類型、應用、終端用戶、產品、製程、技術、組件、安裝類型及設施
 日本C4精製油市場規模、佔有率、趨勢和預測:按類型、應用和地區分類,2026-2034年石腦油市場報告:按應用和地區分類 2026-2034 年
 石腦油市場-全球產業規模、佔有率、趨勢、機會與預測:按產品、應用、地區和競爭對手分類,2021-2031年可再生石腦油市場依產品類型、原料、生產流程、純度等級、通路及應用分類-2026-2032年全球預測生物石腦油市場規模、佔有率、成長及全球產業分析:按類型、應用和地區劃分的洞察與預測(2026-2034 年)