


 |
市場調查報告書
商品編碼
1910558
保險科技:市場佔有率分析、產業趨勢與統計、成長預測(2026-2031)Insurtech - Market Share Analysis, Industry Trends & Statistics, Growth Forecasts (2026 - 2031) |
||||||
※ 本網頁內容可能與最新版本有所差異。詳細情況請與我們聯繫。
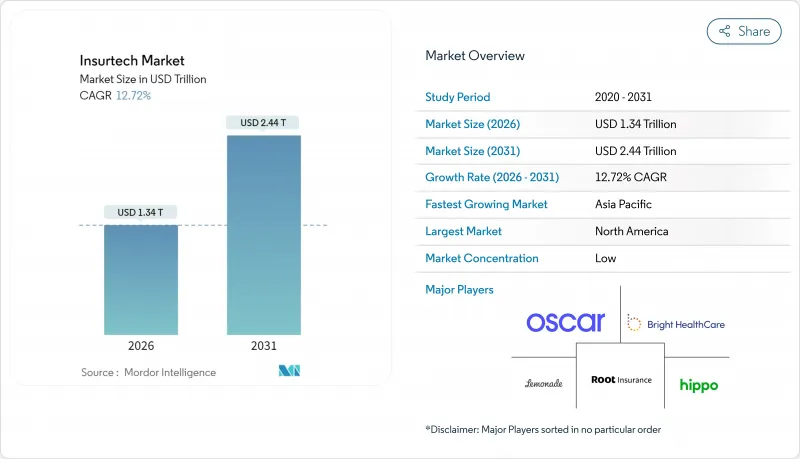
預計到 2025 年,保險科技市場規模將達到 1.19 兆美元,從 2026 年的 1.34 兆美元成長到 2031 年的 2.44 兆美元,在預測期(2026-2031 年)內,複合年成長率將達到 12.72%。
這種快速成長反映了保險公司在設計、銷售和服務保單方式上的結構性轉變,數位化優先體驗已成為必要條件。雲端原生轉型、人工智慧驅動的承保業務和嵌入式保險已從試點階段發展成為企業標準,使保險公司能夠降低營運成本、加快產品上市速度並拓展新的客戶群。在十多個司法管轄區,政府主導的沙盒專案正在加速解決方案的部署,而與行動和物聯網平台的策略合作正在重新定義汽車和產物保險領域的風險評估。競爭優勢不再僅僅取決於資產負債表的規模,而是取決於資料存取能力、平台敏捷性以及將保險無縫嵌入非保險購買流程的能力。
全球保險科技市場趨勢與洞察
在承保和理賠流程中擴大人工智慧和機器學習的應用
人工智慧驅動的決策引擎已基本實現了保單簽發和理賠分流的自動化,縮短了平均處理時間並提高了預測準確性。瑞士再保險公司報告稱,透過將其理賠分析遷移到微軟Azure,該公司已實現了大部分基礎設施的自動化,並將承保時間縮短了一半。那些已掌握利用自身資料集進行監督學習的保險公司正在獲得競爭優勢,並迫使競爭對手加快資料工程計畫。這項技術還催生了新的微型定期保險產品,例如基於使用量的出行保險,因為風險可以即時定價。隨著監管機構對可解釋模型的接受度越來越高,預計人工智慧在個人汽車保險、小規模商業保險和網路保險領域的應用將最為迅速。在雲端市場上提供預訓練模式的供應商生態系統進一步降低了採用門檻。
對個人化、按需保險產品的需求日益成長
消費者越來越希望保險流程能像電商網站一樣便捷,選擇保額和期限應該像把商品加入購物車一樣簡單。安聯與Cosmo Connected的合作項目,將意外險嵌入智慧頭盔,每月只需支付固定費用,就展示了物聯網資料如何實現無需紙本文件的自動保單啟動。同樣,參數型保險產品會在預設觸發條件滿足時自動賠付,避免了冗長的理賠流程,填補了旅行、農業和氣候風險領域的保障空白。提供健康指導和網路安全監控等附加價值服務的平台,透過提案滿足日常需求的客製化服務,提高了續保率。這種轉變迫使保險公司重組傳統的保單管理系統,轉向動態調整的附加險和保額,而非固定的年度合約。
整合遺留核心系統的複雜性
使用了幾十年的老舊大型主機往往缺乏現代化的應用程式介面(API),導致即時資料交換高成本且風險巨大。因此,保險公司面臨兩難:要麼徹底改造系統,要麼採取零散的升級和更新方式。轉型失敗會導致保單簽發和理賠延遲,損害客戶信心,並招致監管機構的審查。此外,出於合規目的,資料沿襲和審核追蹤的保留也會帶來隱性成本。因此,一些現有計劃選擇與新業務公司合作,而不是對其核心系統維修,從而延緩了其母公司內部的數位轉型進程。
細分市場分析
產物保險是推動收入成長的主要因素,預計到2025年將佔保險科技市場58.73%的佔有率,這反映了汽車和住宅保險的成熟需求。然而,包括網路保險、寵物保險、船舶保險和旅遊保險在內的專業保險預計將實現最快的保費成長,到2031年將以18.63%的複合年成長率成長。嵌入式物聯網感測器和參數觸發器使專業保險產品能夠避免傳統的理賠延誤,並提供卓越的客戶體驗,從而提高利潤率。像AXA XL這樣的保險公司已經推出了由生成式人工智慧驅動的網路保險產品,以應對企業採用人工智慧帶來的資料污染風險。隨著小眾風險的興起,專業保險領域的創新者可以獲得顯著的市場佔有率成長,預計這些領域的保險科技市場規模在預測期內將大幅擴張。
與此同時,現有產物保險保單為變革管理帶來了障礙。人壽和健康保險公司正在雲端平台上試點敏捷承保業務,但與不受監管的專業產品相比,嚴格的死亡率和發病率監管限制了其速度。再保險公司正在加強與網路管理總代理(MGA)的合作,以收集獨特的理賠資料集,從而提高投資組合建模的準確性。鑑於成長軌蹟的分化,投資人可能會將資金配置轉向那些展現出穩健風險管理和可擴展分銷能力的專業核保公司。
區域分析
2025年,北美在保險科技(InsurTech)市場維持了37.25%的佔有率,這得益於充裕的創業投資和成熟的創新中心。各州層級的監管競爭,例如肯塔基州保險創新沙盒(Kentucky Insurance Innovation Sandbox),正在加速試點計畫的推進,這些計畫通常在概念驗證結果達到償付能力標準後推廣至全國。美國汽車保險公司仍然是遠端資訊處理技術的早期採用者,而加拿大保險公司則正在採用雲端原生保單管理系統來克服地理服務分散的問題。併購活動活性化,現有企業紛紛收購技術能力。慕尼黑再保險公司以26億美元收購Next Insurance,標誌著該公司在2025年大幅擴張了在美國初級保險領域的業務。儘管市場成熟度限制了表面上的成長,但北美保險公司正透過降低營運成本和交叉銷售輔助服務(例如網路保險和隱私套餐)來增加收入。
亞太地區預計到2031年將以16.25%的年均成長率成長,這主要得益於智慧型手機的高普及率、政府主導的金融科技政策以及舊有系統限制的減少。中國和印度已放寬外資所有權限制,鼓勵全球保險公司在配備區域資料中心的超大規模雲端平台上部署人工智慧承保引擎。新加坡金融管理局正透過營運清晰的監管沙盒並頒發涵蓋人壽、非人壽和健康保險的數位混合牌照,加速區域擴張。日本保險公司正利用人工智慧驅動的年金定價來應對長壽風險,而韓國平台則將基於使用量的出行保險整合到共乘超級應用程式中。較低的保險普及率為新客戶獲取留下了充足的空間,而作為電商購物附加險銷售的嵌入式微額保險,儘管保費金額不高,卻正在推動銷售額的成長。
在符合GDPR的資料管治框架的支持下,歐洲維持了穩定的個位數成長,這提升了當地保險科技公司在隱私保護方面的信譽。即將訂定的歐盟資料法將強制要求車輛資料存取標準化,進一步推動遠端資訊處理產品的創新。英國將在脫歐後尋求監管柔軟性,加速產品核可,同時維持與償付能力II同等的跨國資本減免標準。德國的工業基礎將推動對先進商業和網路風險解決方案的需求,而法國大規模的個人保險市場則支持行為模式定價的規模經濟。在環境、社會和治理(ESG)資訊揭露法規日益嚴格的背景下,歐洲保險公司正在創新地為農業和可再生能源計劃開發參數化氣候風險保險,從而建立一個可推廣至其他地區的框架。
拉丁美洲和中東/非洲地區尚不成熟,但前景廣闊。巴西、肯亞和奈及利亞的行動支付環境正在突破傳統代理商管道的限制,涵蓋小額意外保險和住院現金津貼產品。政府對個人的支付平台提供即時保費收取管道,並降低了小額產品的風險。加勒比海和東非的主權風險池正在採用參數化的颶風和乾旱解決方案,可在24小時內啟動緊急資金,為更廣泛的災害保險市場概念驗證。國際發展機構經常參與初始投資組合的共同承保,並鼓勵私人保險公司在損失頻率模型成熟後參與其中。
其他福利:
- Excel格式的市場預測(ME)表
- 3個月的分析師支持
目錄
第1章 引言
- 研究假設和市場定義
- 調查範圍
第2章調查方法
第3章執行摘要
第4章 市場情勢
- 市場概覽
- 市場促進因素
- 人工智慧和機器學習在承保業務和理賠處理的應用日益廣泛
- 對個人化、按需保險產品的需求日益成長
- 向雲端原生核心系統的遷移日益增多
- 監理沙盒加速產品推出
- 與行動和物聯網平台的數據鏈接
- 嵌入式分散式模型的快速成長
- 市場限制
- 整合遺留核心系統的複雜性
- 監管和合規性碎片化
- MGA的再保險能力受限
- 投資者正將關注點從「成長優先」轉向「盈利優先」。
- 價值/供應鏈分析
- 監管環境
- 技術展望
- 波特五力模型
- 買方的議價能力
- 供應商的議價能力
- 新進入者的威脅
- 替代品的威脅
- 競爭對手之間的競爭
- 投資和資金籌措環境
- Start-Ups生態系分析
第5章 市場規模與成長預測
- 按產品線(保險類型)
- 人壽保險
- 健康保險
- 產物保險(P&C):汽車保險、住宅、商業責任險等。
- 特殊險種(例如:網路保險、寵物保險、船舶保險、旅遊保險)
- 透過分銷管道
- 直接面對消費者 (D2C) 數字
- 聚合平台/市場
- 數位仲介/MGA
- 嵌入式保險平台
- 傳統代理商和仲介(數位轉型)
- 銀行保險(數位化)
- 其他頻道
- 最終用戶
- 零售/個人
- 適用於中小企業/公司
- 大型公司/企業
- 政府/公共部門
- 按地區分類(價值,十億美元)
- 北美洲
- 加拿大
- 美國
- 墨西哥
- 南美洲
- 巴西
- 秘魯
- 智利
- 阿根廷
- 其他南美洲
- 歐洲
- 英國
- 德國
- 法國
- 西班牙
- 義大利
- 比荷盧經濟聯盟(比利時、荷蘭、盧森堡)
- 北歐國家(丹麥、芬蘭、冰島、挪威、瑞典)
- 其他歐洲地區
- 亞太地區
- 印度
- 中國
- 日本
- 澳洲
- 韓國
- 東南亞(新加坡、馬來西亞、泰國、印尼、越南、菲律賓)
- 亞太其他地區
- 中東和非洲
- 阿拉伯聯合大公國
- 沙烏地阿拉伯
- 南非
- 奈及利亞
- 其他中東和非洲地區
- 北美洲
第6章 競爭情勢
- 市場集中度
- 策略趨勢與發展
- 市佔率分析
- 公司簡介
- Lemonade
- Hippo Insurance
- Root Insurance
- Oscar Health
- Bright Health
- Clover Health
- Next Insurance
- ZhongAn
- Wefox
- Alan
- Devoted Health
- Coalition
- Slice Labs
- Metromile
- PolicyBazaar
- Digit Insurance
- ManyPets
- Pie Insurance
- Doma
- Kin Insurance
第7章 市場機會與未來展望
The insurtech market was valued at USD 1.19 trillion in 2025 and estimated to grow from USD 1.34 trillion in 2026 to reach USD 2.44 trillion by 2031, at a CAGR of 12.72% during the forecast period (2026-2031).
The sharp growth reflects a structural change in how insurers design, distribute, and service policies as digital-first experiences become table stakes. Cloud-native migrations, AI-enabled underwriting, and embedded insurance have shifted from pilot initiatives to enterprise standards, allowing carriers to cut operating costs, improve speed-to-market, and reach new customer segments. Government sandboxes in more than a dozen jurisdictions have accelerated solution rollouts, while strategic partnerships with mobility and IoT platforms are redefining risk assessment in auto and property lines. Competitive differentiation now rests on data access, platform agility, and the ability to embed coverage seamlessly into non-insurance purchase journeys, rather than on balance-sheet scale alone.
Global Insurtech Market Trends and Insights
Rising adoption of AI & ML for underwriting and claims
AI-driven decision engines now automate large portions of policy issuance and claims triage, shrinking average handling times and improving predictive accuracy. Swiss Re reported that shifting its claims analytics to Microsoft Azure enabled the majority of infrastructure automation, cutting assessment time in half. Insurers that master supervised learning on proprietary datasets gain defensible underwriting moats, pushing competitors to accelerate data-engineering roadmaps. The technology also unlocks new micro-duration products, such as usage-based mobility cover, because risk can be priced in real time. As regulators grow comfortable with explainable models, AI penetration is expected to rise fastest in personal auto, small commercial, and cyber lines. Vendor ecosystems offering pre-trained models on cloud marketplaces further lower adoption barriers.
Growing demand for personalized, on-demand insurance products
Consumers increasingly expect insurance to mimic e-commerce checkout flows, selecting coverage amounts and durations as easily as adding items to a cart. Allianz's partnership with Cosmo Connected embeds accident coverage in connected helmets for a fixed monthly fee, illustrating how IoT data can trigger automatic policy activation without paperwork . Parametric products are likewise filling gaps in travel, agriculture, and climate risk because they pay when predefined triggers hit, sidestepping lengthy claims adjustment. Marketplaces that bundle ancillary value-added services, such as health coaching or cyber monitoring, see higher renewal rates because propositions resonate with everyday needs. This shift forces carriers to re-platform legacy policy administration so riders and limits can adjust dynamically, moving away from static annual contracts.
Legacy core-system integration complexity
Decades-old mainframes often lack modern APIs, making real-time data exchange expensive and risky. Carriers, therefore, face a trade-off between wholesale replacement and piecemeal wrap-and-renew approaches. Failed conversions can stall policy issuance or claims payouts, eroding customer trust and drawing regulator scrutiny. Integration projects also carry hidden costs when data lineage and audit trails need preservation for compliance. As a result, some incumbents partner with greenfield entities instead of renovating core estates, slowing digital change within the mothership.
Other drivers and restraints analyzed in the detailed report include:
- Increasing migration to cloud-native core systems
- Regulatory sandboxes accelerating product launches
- Regulatory and compliance fragmentation
For complete list of drivers and restraints, kindly check the Table Of Contents.
Segment Analysis
Property & Casualty dominated revenue with a 58.73% insurtech market share in 2025, reflecting entrenched auto and homeowner demand foundations. Nonetheless, Specialty Lines, encompassing cyber, pet, marine, and travel, are forecast to expand at a 18.63% CAGR through 2031, delivering the fastest incremental premium. Embedded IoT sensors and parametric triggers allow Specialty products to circumvent traditional loss-adjustment delays, creating superior customer experiences that command higher margins. Carriers such as AXA XL have already debuted generative-AI cyber covers to address data-poisoning exposures arising from enterprise AI rollouts. As niche risks proliferate, Specialty innovators can capture outsized wallet-share increases, suggesting the insurtech market size for these lines will compound materially over the forecast window.
Property & Casualty incumbents, meanwhile, leverage telematics to reclaim pricing precision, yet their extensive legacy books create change-management headwinds. Life and Health insurers pilot accelerated underwriting on cloud platforms, but stricter mortality and morbidity regulations temper speed relative to non-regulated specialty covers. Reinsurers increasingly partner with cyber MGAs to collect proprietary claims datasets, improving portfolio modelling accuracy. Given the divergent growth curves, investors may shift capital allocations toward Specialty underwriters that demonstrate robust risk controls and scalable distribution frameworks.
The Insurtech Market Report is Segmented by Product Line (Insurance Type) (Life Insurance, Health Insurance, and More), Distribution Channel (Direct-To-Consumer (D2C) Digital, Aggregators/Marketplaces, and More), End User (Retail/Individual, SME/Commercial, and More), and Geography (North America, South America, and More). The Market Forecasts are Provided in Terms of Value (USD).
Geography Analysis
North America retained 37.25% insurtech market share in 2025, benefiting from deep venture capital pools and established innovation hubs. State-level regulatory competition, exemplified by the Kentucky Insurance Innovation Sandbox, accelerates pilots that often expand nationwide after proof-of-concept results meet solvency criteria. US auto insurers remain early adopters of telematics, while Canadian carriers deploy cloud-native policy administration to overcome geographic service dispersion. M&A activity intensifies as incumbents buy capabilities; Munich Re's USD 2.6 billion purchase of Next Insurance marked a notable 2025 expansion into US primary lines. Although market maturity constrains headline growth, North American carriers drive profit through operating expense reductions and cross-selling of ancillary cyber and identity-protection bundles.
Asia-Pacific, forecast to grow 16.25% annually to 2031, benefits from high smartphone penetration, government-backed fintech policies, and limited legacy system drag. China and India liberalised foreign ownership caps, encouraging global insurers to localise AI underwriting engines on hyperscale clouds with regional data centres. Singapore's Monetary Authority operates a well-defined sandbox and grants digital composite licences that cover life, general, and health, accelerating regional scaling. Japanese carriers tackle longevity risk with AI-enabled annuity pricing, and South Korean platforms integrate usage-based mobility cover into ride-hailing super-apps. Lower insurance penetration leaves ample headroom for first-time buyers, so embedded micro-policies sold alongside e-commerce purchases drive volume even at modest ticket sizes.
Europe sustains steady single-digit growth anchored by GDPR-aligned data-governance frameworks, which give local insurtechs credibility on privacy. The forthcoming EU Data Act will mandate standardised vehicle data access, further catalysing telematics product innovation. The UK pursues post-Brexit regulatory agility, enabling faster product approvals while remaining Solvency II-equivalent for cross-border capital relief. Germany's industrial base spurs demand for advanced commercial and cyber risk solutions, whereas France's sizeable personal-lines market supports scale economics for behavioural-based pricing. As ESG disclosure rules tighten, European carriers innovate parametric climate-risk covers for agriculture and renewable-energy projects, creating exportable frameworks for other regions.
South America along with the Middle East & Africa remain nascent but promising. Mobile-money ecosystems in Brazil, Kenya, and Nigeria increasingly bundle micro-accident and hospital-cash products, leapfrogging traditional agency networks. Government-to-person payment platforms provide instant premium-collection rails, de-risking small-ticket offerings. Sovereign risk pools in the Caribbean and East Africa adopt parametric hurricane and drought solutions that trigger emergency funds within 24 hours, validating proof of concept for broader disaster markets. International development agencies often co-underwrite early portfolios, encouraging private carriers to enter once loss-frequency models mature.
- Lemonade
- Hippo Insurance
- Root Insurance
- Oscar Health
- Bright Health
- Clover Health
- Next Insurance
- ZhongAn
- Wefox
- Alan
- Devoted Health
- Coalition
- Slice Labs
- Metromile
- PolicyBazaar
- Digit Insurance
- ManyPets
- Pie Insurance
- Doma
- Kin Insurance
Additional Benefits:
- The market estimate (ME) sheet in Excel format
- 3 months of analyst support
TABLE OF CONTENTS
1 Introduction
- 1.1 Study Assumptions & Market Definition
- 1.2 Scope of the Study
2 Research Methodology
3 Executive Summary
4 Market Landscape
- 4.1 Market Overview
- 4.2 Market Drivers
- 4.2.1 Rising adoption of AI & ML for underwriting & claims
- 4.2.2 Growing demand for personalized, on-demand insurance products
- 4.2.3 Increasing migration to cloud-native core systems
- 4.2.4 Regulatory sandboxes accelerating product launches
- 4.2.5 Data partnerships with mobility & IoT platforms
- 4.2.6 Rapid growth of embedded distribution models
- 4.3 Market Restraints
- 4.3.1 Legacy core-system integration complexity
- 4.3.2 Regulatory & compliance fragmentation
- 4.3.3 Re-insurance capacity constraints for MGAs
- 4.3.4 Investor pivot from "growth at all costs" to profitability
- 4.4 Value / Supply-Chain Analysis
- 4.5 Regulatory Landscape
- 4.6 Technological Outlook
- 4.7 Porter's Five Forces
- 4.7.1 Bargaining Power of Buyers
- 4.7.2 Bargaining Power of Suppliers
- 4.7.3 Threat of New Entrants
- 4.7.4 Threat of Substitutes
- 4.7.5 Competitive Rivalry
- 4.8 Investment & Funding Landscape
- 4.9 Start-up Ecosystem Analysis
5 Market Size & Growth Forecasts
- 5.1 By Product Line (Insurance Type)
- 5.1.1 Life Insurance
- 5.1.2 Health Insurance
- 5.1.3 Property & Casualty (P&C): Motor, Home, Commercial, Liability, etc.
- 5.1.4 Specialty Lines (e.g., cyber, pet, marine, travel)
- 5.2 By Distribution Channel
- 5.2.1 Direct-to-Consumer (D2C) Digital
- 5.2.2 Aggregators/Marketplaces
- 5.2.3 Digital Brokers/MGAs
- 5.2.4 Embedded Insurance Platforms
- 5.2.5 Traditional Agents/Brokers (digitally enabled)
- 5.2.6 Bancassurance (digitally enabled)
- 5.2.7 Other Channels
- 5.3 By End User
- 5.3.1 Retail/Individual
- 5.3.2 SME/Commercial
- 5.3.3 Large Enterprise/Corporate
- 5.3.4 Government/Public Sector
- 5.4 By Geography (Value, USD Bn)
- 5.4.1 North America
- 5.4.1.1 Canada
- 5.4.1.2 United States
- 5.4.1.3 Mexico
- 5.4.2 South America
- 5.4.2.1 Brazil
- 5.4.2.2 Peru
- 5.4.2.3 Chile
- 5.4.2.4 Argentina
- 5.4.2.5 Rest of South America
- 5.4.3 Europe
- 5.4.3.1 United Kingdom
- 5.4.3.2 Germany
- 5.4.3.3 France
- 5.4.3.4 Spain
- 5.4.3.5 Italy
- 5.4.3.6 BENELUX (Belgium, Netherlands, Luxembourg)
- 5.4.3.7 NORDICS (Denmark, Finland, Iceland, Norway, Sweden)
- 5.4.3.8 Rest of Europe
- 5.4.4 Asia-Pacific
- 5.4.4.1 India
- 5.4.4.2 China
- 5.4.4.3 Japan
- 5.4.4.4 Australia
- 5.4.4.5 South Korea
- 5.4.4.6 South East Asia (Singapore, Malaysia, Thailand, Indonesia, Vietnam, and Philippines)
- 5.4.4.7 Rest of Asia-Pacific
- 5.4.5 Middle East & Africa
- 5.4.5.1 United Arab Emirates
- 5.4.5.2 Saudi Arabia
- 5.4.5.3 South Africa
- 5.4.5.4 Nigeria
- 5.4.5.5 Rest of Middle East & Africa
- 5.4.1 North America
6 Competitive Landscape
- 6.1 Market Concentration
- 6.2 Strategic Moves & Developments
- 6.3 Market Share Analysis
- 6.4 Company Profiles (includes Global level Overview, Market level overview, Core Segments, Financials as available, Strategic Information, Market Rank/Share for key companies, Products & Services, and Recent Developments)
- 6.4.1 Lemonade
- 6.4.2 Hippo Insurance
- 6.4.3 Root Insurance
- 6.4.4 Oscar Health
- 6.4.5 Bright Health
- 6.4.6 Clover Health
- 6.4.7 Next Insurance
- 6.4.8 ZhongAn
- 6.4.9 Wefox
- 6.4.10 Alan
- 6.4.11 Devoted Health
- 6.4.12 Coalition
- 6.4.13 Slice Labs
- 6.4.14 Metromile
- 6.4.15 PolicyBazaar
- 6.4.16 Digit Insurance
- 6.4.17 ManyPets
- 6.4.18 Pie Insurance
- 6.4.19 Doma
- 6.4.20 Kin Insurance
7 Market Opportunities & Future Outlook
- 7.1 White-space & Unmet-Need Assessment
 保險科技市場規模、佔有率、趨勢和預測:按類型、服務、技術和地區分類,2026-2034年
 2026-2030年全球保險科技市場
 亞太地區保險科技:市場佔有率分析、產業趨勢與統計及成長預測(2026-2031)
 2026年全球保險科技市場報告
 保險科技市場分析及預測(至2035年):按類型、產品類型、服務、技術、組件、應用、部署類型、最終用戶和解決方案分類
 2026-2034年全球保險科技市場規模、佔有率、趨勢和成長分析報告
 全球保險科技市場(至 2035 年):依保險科技類型、服務類型、技術類型、最終用戶、公司類型、地區、產業趨勢和預測
 保險科技市場-全球產業規模、佔有率、趨勢、機會及預測(按類型、保費範圍、地區及競爭格局分類,2021-2031年)保險科技市場規模、佔有率、成長及全球產業分析:按類型、應用和地區劃分的洞察與預測(2026-2034)日本保險科技市場報告(按類型、服務、技術和地區分類,2026-2034年)