


 |
市場調查報告書
商品編碼
1910557
企業網路設備:市場佔有率分析、產業趨勢與統計、成長預測(2026-2031)Enterprise Network Equipment - Market Share Analysis, Industry Trends & Statistics, Growth Forecasts (2026 - 2031) |
||||||
※ 本網頁內容可能與最新版本有所差異。詳細情況請與我們聯繫。
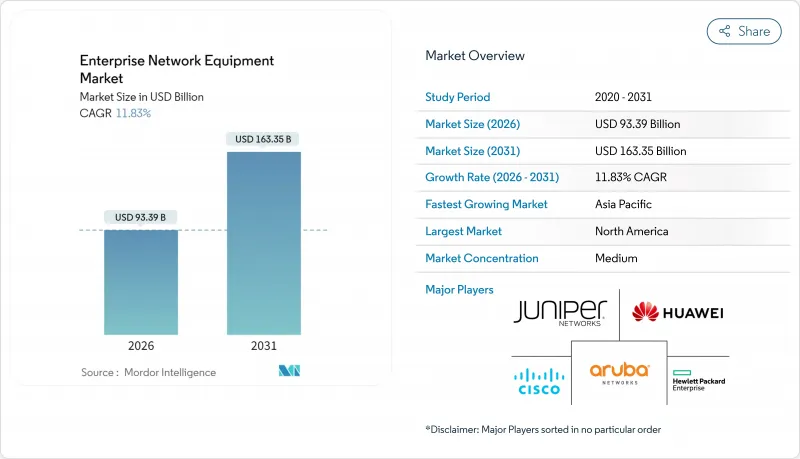
預計到 2025 年,企業網路設備市場規模將達到 835.1 億美元,從 2026 年的 933.9 億美元成長到 2031 年的 1,633.5 億美元。
預計在預測期(2026-2031 年)內,複合年成長率將達到 11.83%。
企業正從依賴傳統硬體轉向採用人工智慧最佳化、雲端管理的基礎設施,這種基礎設施強調軟體定義控制、頻寬可擴展性和自動化運營,而推動這一成長的正是這種趨勢。資料中心對 400G 和 800G 交換器的強勁需求、園區網路迫切需要升級到 Wi-Fi 7,以及分店對 SD-WAN 的日益普及,都進一步推動了支出成長。高速光收發器的供應鏈限制導致庫存緊張,使垂直整合的供應商獲得了價格優勢。同時,永續性計畫正在推動低功耗晶片的發展,在五年周期內將整體擁有成本降低 15-20%。平台供應商正在加速將交換、安全和人工智慧分析整合到統一的協定堆疊中,從而推動了產業整合。
全球企業網路設備市場趨勢與洞察
物聯網和邊緣運算推動了頻寬需求的激增。
邊緣架構將處理環節移至更靠近資料來源的位置,增加了傳統園區網路無法承受的流量負載。工業IoT站點傳輸Terabyte的感測器訊息,需要25G或100G的上行鏈路,且不能出現延遲。思科2025會計年度的財務預測顯示,其邊緣網路部門的營收將成長34%,主要得益於製造業和物流業的預測性維修計劃。整合的專用5G和Wi-Fi網路將提高混合設備的密度,電腦視覺工作負載的頻寬將比以往增加10到15倍,因此需要採用東西向而非南北向的流量設計。
快速將企業範圍內的網路升級到 Wi-Fi 7 園區區域網
在無線速度驅動生產力指標的時代,Wi-Fi 7 加速了裝置更新換代週期。 IEEE 802.11be 標準在 320 MHz 頻道上可達到 46 Gbps 的傳輸速度,使企業能夠以可靠的無線連結取代有線桌面。 Arista 報告稱,2025 年第一季園區交換器業務將成長 27.6%,其中 60% 的成長與 Wi-Fi 7回程傳輸和 PoE 升級相關。高密度場所(例如會議區)受益於確定性延遲,從而支持製造業和醫療培訓中的擴增實境 (AR) 應用。
高成本的維護成本和合規性主導的安全成本
HIPAA、PCI DSS 4.0 和新的人工智慧法規要求持續監控、資料分段和審核日誌記錄,導致營運成本佔 IT 預算的 20% 至 30%。金融公司正在實施零信任架構,這需要專用設備和專業服務,其生命週期成本甚至超過了初始硬體成本。
細分市場分析
2025年,交換器將佔企業網路設備市場41.12%的佔有率,凸顯其在園區網路和資料中心拓樸結構中的核心地位。隨著人工智慧工作負載的成長,對400G和800G網路架構線速無阻塞效能的需求日益成長,預計交換器的企業網路設備市場也將隨之擴大。無線區域網路將維持其最快成長速度,複合年成長率將達到13.45%,這主要得益於Wi-Fi 7在辦公室、醫療和教育環境中實現的高密度、低延遲移動性。路由器在SD-WAN領域仍將扮演重要角色,而網路安全設備則因微隔離和行為分析技術的進步而日益普及。
園區現代化改造將整合 PoE 升級和新型多Gigabit佈線,以支援電力消耗量的Wi-Fi 7網路基地台。接入控制器將採用雲端控制面板,實現頻道分配和威脅防禦的自動化。邊緣交換器將整合時間敏感網路 (TSN) 技術,以承載工業IoT)流量。供應商將增強 ASIC 遙測功能,使 IT 團隊能夠了解緩衝區使用情況,這對於控制 AI 推理中的抖動至關重要。
2025年,受金融和政府機構採購部門資料主權法規的推動,本地部署方案將貢獻51.05%的收入。然而,隨著企業優先考慮基於營運支出(OPEX)的訂閱模式和快速部署,雲端管理解決方案的採用率將繼續以13.32%的複合年成長率成長。隨著中小企業採用透過多租戶入口網站管理的即插即用型Wi-Fi和SD-WAN解決方案,雲端管理平台預計將在企業網路設備市場佔據越來越大的佔有率。
受監管行業正日益青睞混合控制方案,該方案將策略引擎保留在本地,同時將分析資料傳送到雲端。 API優先的設計使DevOps團隊能夠將網路工作流程整合到CI/CD管道中。付費使用制可以平滑現金流,並降低分店擴張的門檻。供應商正透過人工智慧引擎來脫穎而出,這些引擎可以預測故障並提出無需人工提交工單的修復措施提案。
區域分析
北美地區預計到2025年將維持37.85%的營收佔有率,這主要得益於人工智慧架構的早期應用以及大型超大規模資料中心面積的擴張。金融和醫療保健產業的監管正在推動零信任架構和園區Wi-Fi 7部署的快速現代化。該地區的企業網路設備市場規模受益於強勁的資本預算和完善的合作夥伴生態系統。
到2031年,亞太地區將以13.54%的複合年成長率保持在最高水準。中國5G私有化進程的推進以及日本「社會5.0」策略下的數位化,正在推動無線和邊緣設備的訂單。中國的在地採購政策有利於國內交換器供應商,從而導致廠商市場佔有率的重組。印度的雲端運算蓬勃發展,也帶動了中小企業對雲端管理SD-WAN和Wi-Fi的需求。
歐洲將基於GDPR合規性、數位主權和綠色技術指令保持穩定成長。德國的工業4.0計畫將推動確定性乙太網路的普及,而北歐的永續性法規則則有利於低功耗矽晶片的發展。在中東和非洲,智慧城市建設資金將用於建設光纖骨幹網路和都市區Wi-Fi,但宏觀經濟波動將限制支出。南美洲將投資5G回程傳輸和市政寬頻,但匯率波動將影響合約簽訂時間。
其他福利:
- Excel格式的市場預測(ME)表
- 分析師支持(3個月)
目錄
第1章 引言
- 研究假設和市場定義
- 調查範圍
第2章調查方法
第3章執行摘要
第4章 市場情勢
- 市場概覽
- 市場促進因素
- 物聯網和邊緣運算推動了頻寬需求的激增。
- 快速將企業範圍內的網路升級到 Wi-Fi 7 園區區域網
- 雲端管理網路和SD-WAN的採用
- 政府主導的智慧城市基礎建設
- 人工智慧主導企業資料中心對 400/800G 交換器的需求
- 永續性,推動了低功耗開關矽的發展。
- 市場限制
- 高昂的維護和合規安全成本
- 半導體供應鏈持續受阻
- 熟練的軟體定義網路 (SDN) 工程師短缺
- 疫情期間庫存過剩導致產品更新週期延遲
- 產業價值鏈分析
- 宏觀經濟因素的影響
- 監管環境
- 技術展望
- 波特五力分析
- 供應商的議價能力
- 消費者議價能力
- 新進入者的威脅
- 替代品的威脅
- 競爭對手之間的競爭
第5章 市場規模與成長預測
- 按類型
- 轉變
- 路由器
- WLAN
- 網路安全
- 網路基地台和控制器
- 按部署模式
- 本地部署
- 雲端管理
- 混合
- 按公司規模
- 小型企業
- 主要企業
- 按最終用戶行業分類
- 資訊科技和電信
- BFSI
- 衛生保健
- 製造業
- 政府
- 零售與電子商務
- 其他終端用戶產業
- 按地區
- 北美洲
- 美國
- 加拿大
- 墨西哥
- 南美洲
- 巴西
- 阿根廷
- 智利
- 南美洲其他地區
- 歐洲
- 德國
- 英國
- 法國
- 義大利
- 西班牙
- 其他歐洲地區
- 亞太地區
- 中國
- 日本
- 韓國
- 印度
- 新加坡
- 澳洲
- 亞太其他地區
- 中東和非洲
- 中東
- 沙烏地阿拉伯
- 阿拉伯聯合大公國
- 土耳其
- 其他中東地區
- 非洲
- 南非
- 奈及利亞
- 埃及
- 其他非洲地區
- 中東
- 北美洲
第6章 競爭情勢
- 市場集中度
- 策略趨勢
- 市佔率分析
- 公司簡介
- Cisco Systems Inc.
- Huawei Technologies Co. Ltd.
- Hewlett Packard Enterprise Company
- Aruba Networks LLC
- Juniper Networks Inc.
- Arista Networks Inc.
- Extreme Networks Inc.
- Dell Technologies Inc.
- Broadcom Inc.
- Fortinet Inc.
- Palo Alto Networks Inc.
- Check Point Software Technologies Ltd.
- F5 Inc.
- VMware LLC
- New H3C Technologies Co. Ltd.
- Nokia Corporation
- ZTE Corporation
- Ubiquiti Inc.
- Alcatel-Lucent Enterprise
- NETSCOUT Systems Inc.
- A10 Networks Inc.
- TP-Link Technologies Co. Ltd.
第7章 市場機會與未來展望
The enterprise network equipment market was valued at USD 83.51 billion in 2025 and estimated to grow from USD 93.39 billion in 2026 to reach USD 163.35 billion by 2031, at a CAGR of 11.83% during the forecast period (2026-2031).
This expansion stems from enterprise migration toward AI-optimized, cloud-managed infrastructure that favors software-defined control, bandwidth scalability, and automated operations over legacy hardware dependence. Strong demand for 400 G and 800 G switching inside data centers, urgent Wi-Fi 7 upgrades on campus networks, and rising SD-WAN roll-outs in branch sites all reinforce spending momentum. Supply-chain constraints for high-speed optical transceivers tighten inventory, giving vertically integrated vendors a pricing edge. In parallel, sustainability programs push low-power silicon that cuts the total cost of ownership by 15-20% during five-year cycles. Industry consolidation accelerates as platform vendors merge switching, security, and AI analytics into unified stacks.
Global Enterprise Network Equipment Market Trends and Insights
Surging Bandwidth Demand from IoT and Edge Computing
Edge architectures move processing close to data sources, multiplying traffic loads that older campus networks cannot support. Industrial IoT sites stream terabytes of sensor information that require 25 G or 100 G uplinks without latency penalties. Cisco's 2025 results showed 34% revenue growth in edge networking, fueled by manufacturing and logistics predictive-maintenance projects. Converged private 5G and Wi-Fi domains add hybrid device density, while computer-vision workloads consume 10-15 times traditional bandwidth, forcing east-west traffic design over north-south flows.
Rapid Enterprise-Wide Upgrades to Wi-Fi 7 Campus LANs
Wi-Fi 7 accelerates refresh cycles because wireless speed now drives productivity metrics. The IEEE 802.11be spec reaches 46 Gbps using 320 MHz channels, letting firms replace wired desktops with reliable wireless links. Arista recorded 27.6% campus switching growth in Q1 2025, with 60% tied to Wi-Fi 7 backhaul and PoE upgrades. High-density venues such as conference areas benefit from deterministic latency that supports AR in manufacturing and medical training.
High Maintenance and Compliance-Driven Security Costs
HIPAA, PCI DSS 4.0, and emerging AI laws force continuous monitoring, segmentation, and audit logging that raise operating expenses 20-30% of IT budgets. Financial firms deploy zero-trust overlays that need specialized appliances and expert services, lifting lifecycle costs above initial hardware spend.
Other drivers and restraints analyzed in the detailed report include:
- Cloud-Managed Networking and SD-WAN Adoption
- Government-Backed Smart-City Backbone Roll-Outs
- Ongoing Semiconductor Supply-Chain Constraints
For complete list of drivers and restraints, kindly check the Table Of Contents.
Segment Analysis
Switches captured 41.12% of the enterprise network equipment market in 2025, underscoring their centrality in campus and data-center topologies. The enterprise network equipment market size for switches is projected to rise with AI workloads that demand 400 G and 800 G fabrics offering line-rate, non-blocking performance. Wireless LAN remains the fastest mover at a 13.45% CAGR as Wi-Fi 7 enables high-density, low-latency mobility inside office, healthcare, and education environments. Routers maintain relevance in SD-WAN, while network-security appliances gain traction through micro-segmentation and behavior analytics.
Campus modernizations merge PoE upgrades with new multi-gigabit cabling to support power-hungry Wi-Fi 7 access points. Access controllers adopt cloud dashboards that automate channel assignment and threat mitigation. Edge switches integrate time-sensitive networking to carry industrial IoT traffic. Vendors enhance ASIC telemetry to give IT teams visibility down to buffer utilization, a capability vital for AI inference jitter control.
On-premises installations delivered 51.05% revenue in 2025, driven by data sovereignty rules among finance and government buyers. Still, cloud-managed adoption outpaces at 13.32% CAGR as organizations favor opex subscriptions and rapid rollout. The enterprise network equipment market share for cloud-managed platforms will widen as SMEs adopt plug-and-play Wi-Fi and SD-WAN solutions administered from multitenant portals.
Hybrid control gains fans in regulated industries that keep policy engines on-site while feeding analytics to the cloud. API-first design lets DevOps teams integrate network workflows into CI/CD pipelines. Consumption pricing smooths cash flows and lowers the barrier to branch expansion. Vendors differentiate through AI engines that predict faults and recommend remediation without manual ticketing.
The Enterprise Network Equipment Market Report is Segmented by Type (Switches, Routers, WLAN, and More), Deployment Model (On-Premises, Cloud-Managed, and Hybrid), Enterprise Size (Small and Medium Enterprises and Large Enterprises), End-User Vertical (IT and Telecom, BFSI, Healthcare, Manufacturing, and More), and Geography. The Market Forecasts are Provided in Terms of Value (USD).
Geography Analysis
North America retained 37.85% of 2025 revenue, fueled by early uptake of AI-centric fabrics and large hyperscale data-center footprints. Financial and healthcare regulations encourage rapid modernization with zero-trust overlays and campus Wi-Fi 7 adoption. The enterprise network equipment market size in the region benefits from strong capital budgets and a robust partner ecosystem.
Asia-Pacific shows the highest 13.54% CAGR through 2031. Chinese private 5G liberalization and Japanese digitization under Society 5.0 boost orders for wireless and edge equipment. Local procurement guidelines in China favor domestic switching suppliers, reshaping vendor share. India's cloud boom magnifies SME demand for cloud-managed SD-WAN and Wi-Fi.
Europe posts steady growth anchored in GDPR compliance, digital sovereignty, and green-tech directives. German Industry 4.0 programs drive deterministic Ethernet adoption, while Nordic sustainability rules reward low-power silicon. Middle East and Africa secure smart-city funding that installs fiber backbones and metro Wi-Fi, though macro volatility tempers spending. South America invests in 5G backhaul and municipal broadband, but currency fluctuations influence deal timing.
- Cisco Systems Inc.
- Huawei Technologies Co. Ltd.
- Hewlett Packard Enterprise Company
- Aruba Networks LLC
- Juniper Networks Inc.
- Arista Networks Inc.
- Extreme Networks Inc.
- Dell Technologies Inc.
- Broadcom Inc.
- Fortinet Inc.
- Palo Alto Networks Inc.
- Check Point Software Technologies Ltd.
- F5 Inc.
- VMware LLC
- New H3C Technologies Co. Ltd.
- Nokia Corporation
- ZTE Corporation
- Ubiquiti Inc.
- Alcatel-Lucent Enterprise
- NETSCOUT Systems Inc.
- A10 Networks Inc.
- TP-Link Technologies Co. Ltd.
Additional Benefits:
- The market estimate (ME) sheet in Excel format
- 3 months of analyst support
TABLE OF CONTENTS
1 INTRODUCTION
- 1.1 Study Assumptions and Market Definition
- 1.2 Scope of the Study
2 RESEARCH METHODOLOGY
3 EXECUTIVE SUMMARY
4 MARKET LANDSCAPE
- 4.1 Market Overview
- 4.2 Market Drivers
- 4.2.1 Surging bandwidth demand from IoT and edge computing
- 4.2.2 Rapid enterprise-wide upgrades to Wi-Fi 7 campus LANs
- 4.2.3 Cloud-managed networking and SD-WAN adoption
- 4.2.4 Government-backed smart-city backbone roll-outs
- 4.2.5 AI-driven need for 400/800 G switches in enterprise data centers
- 4.2.6 Sustainability mandates pushing low-power switching silicon
- 4.3 Market Restraints
- 4.3.1 High maintenance and compliance-driven security costs
- 4.3.2 Ongoing semiconductor supply-chain constraints
- 4.3.3 Shortage of skilled engineers for software-defined networks
- 4.3.4 Pandemic-era inventory overhang delaying refresh cycles
- 4.4 Industry Value Chain Analysis
- 4.5 Impact of Macroeconomic Factors
- 4.6 Regulatory Landscape
- 4.7 Technological Outlook
- 4.8 Porter's Five Forces Analysis
- 4.8.1 Bargaining Power of Suppliers
- 4.8.2 Bargaining Power of Consumers
- 4.8.3 Threat of New Entrants
- 4.8.4 Threat of Substitutes
- 4.8.5 Intensity of Competitive Rivalry
5 MARKET SIZE AND GROWTH FORECASTS (VALUES)
- 5.1 By Type
- 5.1.1 Switches
- 5.1.2 Routers
- 5.1.3 WLAN
- 5.1.4 Network Security
- 5.1.5 Access Points and Controllers
- 5.2 By Deployment Model
- 5.2.1 On-Premises
- 5.2.2 Cloud-Managed
- 5.2.3 Hybrid
- 5.3 By Enterprise Size
- 5.3.1 Small and Medium Enterprises
- 5.3.2 Large Enterprises
- 5.4 By End-User Vertical
- 5.4.1 IT and Telecom
- 5.4.2 BFSI
- 5.4.3 Healthcare
- 5.4.4 Manufacturing
- 5.4.5 Government
- 5.4.6 Retail and E-commerce
- 5.4.7 Other End-User Verticals
- 5.5 By Geography
- 5.5.1 North America
- 5.5.1.1 United States
- 5.5.1.2 Canada
- 5.5.1.3 Mexico
- 5.5.2 South America
- 5.5.2.1 Brazil
- 5.5.2.2 Argentina
- 5.5.2.3 Chile
- 5.5.2.4 Rest of South America
- 5.5.3 Europe
- 5.5.3.1 Germany
- 5.5.3.2 United Kingdom
- 5.5.3.3 France
- 5.5.3.4 Italy
- 5.5.3.5 Spain
- 5.5.3.6 Rest of Europe
- 5.5.4 Asia-Pacific
- 5.5.4.1 China
- 5.5.4.2 Japan
- 5.5.4.3 South Korea
- 5.5.4.4 India
- 5.5.4.5 Singapore
- 5.5.4.6 Australia
- 5.5.4.7 Rest of Asia-Pacific
- 5.5.5 Middle East and Africa
- 5.5.5.1 Middle East
- 5.5.5.1.1 Saudi Arabia
- 5.5.5.1.2 United Arab Emirates
- 5.5.5.1.3 Turkey
- 5.5.5.1.4 Rest of Middle East
- 5.5.5.2 Africa
- 5.5.5.2.1 South Africa
- 5.5.5.2.2 Nigeria
- 5.5.5.2.3 Egypt
- 5.5.5.2.4 Rest of Africa
- 5.5.5.1 Middle East
- 5.5.1 North America
6 COMPETITIVE LANDSCAPE
- 6.1 Market Concentration
- 6.2 Strategic Moves
- 6.3 Market Share Analysis
- 6.4 Company Profiles (includes Global level Overview, Market level overview, Core Segments, Financials as available, Strategic Information, Market Rank/Share for key companies, Products and Services, and Recent Developments)
- 6.4.1 Cisco Systems Inc.
- 6.4.2 Huawei Technologies Co. Ltd.
- 6.4.3 Hewlett Packard Enterprise Company
- 6.4.4 Aruba Networks LLC
- 6.4.5 Juniper Networks Inc.
- 6.4.6 Arista Networks Inc.
- 6.4.7 Extreme Networks Inc.
- 6.4.8 Dell Technologies Inc.
- 6.4.9 Broadcom Inc.
- 6.4.10 Fortinet Inc.
- 6.4.11 Palo Alto Networks Inc.
- 6.4.12 Check Point Software Technologies Ltd.
- 6.4.13 F5 Inc.
- 6.4.14 VMware LLC
- 6.4.15 New H3C Technologies Co. Ltd.
- 6.4.16 Nokia Corporation
- 6.4.17 ZTE Corporation
- 6.4.18 Ubiquiti Inc.
- 6.4.19 Alcatel-Lucent Enterprise
- 6.4.20 NETSCOUT Systems Inc.
- 6.4.21 A10 Networks Inc.
- 6.4.22 TP-Link Technologies Co. Ltd.
7 MARKET OPPORTUNITIES AND FUTURE OUTLOOK
- 7.1 White-space and Unmet-need Assessment
 企業網路設備市場:2026-2032年全球市場預測(依產品類型、網路架構、部署模式、組織規模及最終用戶產業分類)
 全球企業網路設備市場:2032 年預測 - 按設備類型、基礎設施類型、公司規模、最終用戶和地區進行分析