


 |
市場調查報告書
商品編碼
1910446
預拌混凝土:市場佔有率分析、產業趨勢與統計、成長預測(2026-2031)Ready Mix Concrete - Market Share Analysis, Industry Trends & Statistics, Growth Forecasts (2026 - 2031) |
||||||
※ 本網頁內容可能與最新版本有所差異。詳細情況請與我們聯繫。
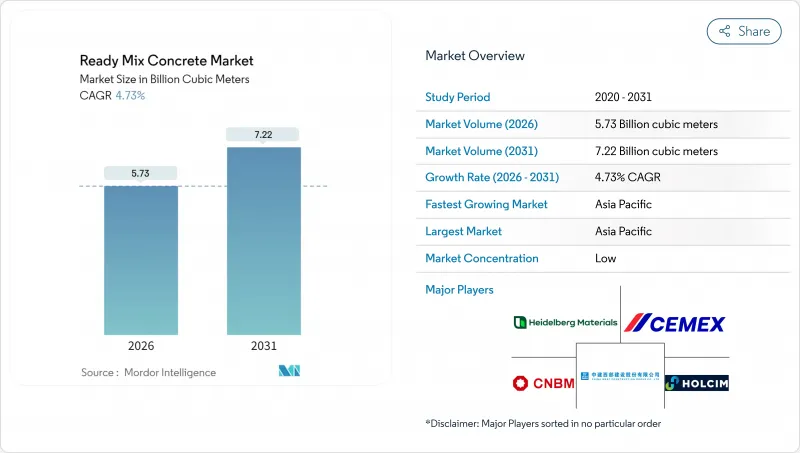
2025年預拌混凝土市場價值為54.7億立方米,預計到2031年將達到72.2億立方米,高於2026年的57.3億立方米。
預計在預測期(2026-2031 年)內,複合年成長率將達到 4.73%。
亞太和北美地區強大的公共部門管線系統支撐著這項銷售成長。同時,數位化調度平台和遠端資訊處理技術有助於提高車輛效率,減少交付波動,並提升供應商的利潤率。政府對基礎設施支出的合規要求促使人們更加關注低碳混合料設計,以水泥熟料取代水泥添加劑。儘管自2019年以來原物料價格上漲擠壓了生產商的利潤空間,但那些對骨材和高峰會進行後向一體化並實施即時品質監控的供應商仍保持了較為健康的利潤。同時,Quikrete-Summit 和 CRH 收購區域資產等併購案例表明,規模經濟和地理密度仍然是預拌混凝土市場的重要因素。
全球預拌混凝土市場趨勢與洞察
快速的都市化和住宅需求
印度、印尼和越南的城市人口快速成長,持續造成大規模的住宅供不應求。開發商青睞異地混凝土,因為它強度均勻、符合不斷變化的建築規範,計劃更短。儘管中國房地產行業存在混凝土供應過剩的情況,但工廠建設和物流中心仍消耗大量混凝土,從而緩解了區域性波動。預計這些因素將在未來十年內持續推動預拌混凝土市場的需求成長。
大型政府基礎建設項目
多年預算承諾使生產商能夠更清晰地了解情況,從而核准新增產能。美國已撥款2,140億美元用於2024年的交通基礎建設,印度的國家基礎設施計畫涵蓋7,400個計劃,從高速公路到可再生能源發電。印尼和澳洲的類似計畫旨在保障長期需求,並確保即使在住宅市場低迷時期,工廠運轉率也能保持在盈虧平衡點以上。
原物料價格波動
自2019年以來,水泥價格上漲了38%,骨材上漲了31%,但由於合約結構壓縮了利潤空間,成本轉嫁延遲。地緣政治和能源衝擊以及卡車短缺加劇了成本的不確定性,迫使生產商實現採購多元化並採用指數掛鉤定價。然而,客戶越來越傾向於固定價格契約,將風險轉移給供應商,從而限制了預拌混凝土市場的成長。
細分市場分析
到2025年,運輸攪拌混凝土將佔預拌混凝土市場72.65%的佔有率,主要得益於大規模的運輸車隊、成熟的訂購系統和具競爭力的交付成本。另一方面,現場攪拌混凝土雖然在銷售上佔比較小,但由於建築商面臨長途運輸和現場澆築時間的限制,預計其年複合成長率將達到5.66%。在交通堵塞導致工期緊張的拉丁美洲都市區,現場攪拌混凝土的應用正在增加。集中攪拌混凝土仍然是那些需要在尖峰時段保持混凝土均勻性的項目(例如水壩和核能計劃)的首選,但一旦區域性大型企劃進入競標階段,其市場佔有率的成長幅度將非常有限。
由於高性能外加劑的廣泛應用,可使混凝土坍落度保持長達三小時,預計到2030年,收縮混凝土市場將持續成長。生產商正投資建造雙滾筒收縮混凝土攪拌站和運輸攪拌站,以滿足不斷變化的市場需求,同時最大限度地減少停機時間。
預拌混凝土市場報告按產品類型(集中攪拌、收縮攪拌、運輸攪拌)、最終用途領域(商業、工業及公共、基礎設施、住宅)和地區(亞太、北美、歐洲、南美、中東和非洲)進行細分。市場預測以體積(立方米)為單位。
區域分析
預計亞太地區將在2025年佔據預拌混凝土市場76.55%的佔有率,並在2031年之前以5.06%的複合年成長率成長。印度耗資1.4兆美元的國家基礎設施計劃,包括高速公路、專用貨運走廊和5000萬套住宅,確保了未來多年的市場需求。印尼4,120億美元的交通網路發展計畫、越南製造業的蓬勃發展以及中國持續的公共工程支出,正在抵消當地住宅市場的疲軟。大型生產商正在德里-孟買高速公路等經濟走廊沿線增設工廠,以縮短運輸距離並實現碳排放目標。
隨著聯邦政府資助的橋樑建設、港口疏浚和電動車充電走廊建設計畫的推進,北美預計將迎來穩步成長。美國預計2023年投資約4億立方碼(約640億美元),預計2025-2026年將維持中等個位數的成長。加拿大正在大力發展城市交通,而墨西哥的近岸外包趨勢正在推動邊境沿線工業園區的發展。
在歐洲,能源衝擊導致2024年產量下降,但政策獎勵策略,特別是來自維修工程和陸域風電平台的刺激,支撐了基準需求。歐洲排放交易機制(CBAM)下更高的碳價正在加速向低水泥熟料混凝土的轉型,使具有環保優勢的供應商能夠在建設產業整體萎縮的情況下獲得市場佔有率。東歐市場正利用歐盟凝聚基金升級鐵路和污水處理設施,提高長期噸位潛力,並為全部區域的預拌混凝土市場注入新的動力。
其他福利:
- Excel格式的市場預測(ME)表
- 3個月的分析師支持
目錄
第1章 引言
- 研究假設和市場定義
- 調查範圍
第2章調查方法
第3章執行摘要
第4章 市場情勢
- 市場概覽
- 市場促進因素
- 快速的都市化和住宅需求
- 大型政府基礎建設項目
- 偏好品管的異地配料
- 從環境角度促進材料效率
- 利用數位化調度和遠端資訊處理最佳化配送
- 市場限制
- 原物料價格波動
- 工期短/物流風險
- 現場容積式攪拌機的普及
- 價值鏈分析
- 波特五力模型
- 供應商的議價能力
- 買方的議價能力
- 替代品的威脅
- 新進入者的威脅
- 競爭對手之間的競爭
第5章 市場規模與成長預測
- 依產品類型
- 中央混合
- 收縮混合
- 混合交通
- 按最終用途
- 商業的
- 工業和公共設施
- 基礎設施
- 住宅
- 按地區
- 亞太地區
- 中國
- 印度
- 日本
- 韓國
- 澳洲
- 印尼
- 越南
- 亞太其他地區
- 北美洲
- 美國
- 加拿大
- 墨西哥
- 歐洲
- 德國
- 法國
- 英國
- 義大利
- 西班牙
- 俄羅斯
- 其他歐洲地區
- 南美洲
- 巴西
- 阿根廷
- 其他南美洲
- 中東和非洲
- 沙烏地阿拉伯
- 阿拉伯聯合大公國
- 其他中東和非洲地區
- 亞太地區
第6章 競爭情勢
- 市場集中度
- 策略趨勢
- 市佔率(%)/排名分析
- 公司簡介
- Adani Group
- BBMG Corporation
- Boral Limited
- Buzzi SpA
- CEMEX SAB de CV
- China National Building Material Group Corporation
- China West Construction Group
- CRH
- Foshan Huijiang Concrete Co., Ltd.
- Heidelberg Materials
- Holcim
- Martin Marietta Materials
- OYAK Cimento
- SAMPYO Group
- Titan Cement
- UltraTech Cement Ltd.
- Vicat SA
- Votorantim Cimentos
第7章 市場機會與未來展望
第8章:執行長面臨的關鍵策略挑戰
The Ready Mix Concrete Market was valued at 5.47 billion cubic meters in 2025 and estimated to grow from 5.73 billion cubic meters in 2026 to reach 7.22 billion cubic meters by 2031, at a CAGR of 4.73% during the forecast period (2026-2031).
Robust public-sector pipelines in Asia-Pacific and North America underpin this volume growth, while digital dispatch platforms and telematics improve fleet productivity, lower delivery variability, and strengthen supplier margins. Low-carbon mix designs that replace clinker with supplementary cementitious materials gain traction because governments attach compliance requirements to infrastructure spending. Raw-material price spikes since 2019 have narrowed producer spreads, yet suppliers that backward-integrate into aggregates and cement-and adopt real-time quality monitoring-sustain healthier earnings. At the same time, mergers such as Quikrete-Summit and CRH's regional asset buys indicate that scale economies and geographic density remain critical levers in the ready mix concrete market.
Global Ready Mix Concrete Market Trends and Insights
Rapid Urbanization and Housing Demand
Fast-growing urban populations in India, Indonesia, and Vietnam continue to translate into large housing backlogs. Developers favor off-site batched concrete for its strength uniformity, compliance with evolving building codes, and shorter project cycles. Despite an overhang in China's property segment, factory construction and logistics hubs still consume sizeable volumes, cushioning regional volatility. Combined, these forces extend the demand runway for the ready mix concrete market well into the next decade.
Government Mega-Infrastructure Pipelines
Multi-year budget commitments provide visibility that allows producers to green-light capacity additions. The United States allocated USD 214 billion for transportation construction in 2024, while India's National Infrastructure Pipeline covers 7,400 projects ranging from highways to renewable power. Similar agendas in Indonesia and Australia lock in long-cycle demand, ensuring that plant utilizations remain above breakeven even during residential downturns.
Raw-Material Price Volatility
Cement prices have risen 38% and aggregates 31% since 2019, squeezing spreads when contract structures delay pass-through. Geopolitical energy shocks and trucking shortages amplify cost unpredictability, compelling producers to diversify sourcing and adopt index-linked pricing. Customers, however, increasingly demand fixed-price contracts, transferring risk back to suppliers and tempering growth in the ready mix concrete market.
Other drivers and restraints analyzed in the detailed report include:
- Preference for Quality-Controlled Off-Site Batching
- Environmental Push for Material Efficiency
- Short Workable Life and Logistics Risk
For complete list of drivers and restraints, kindly check the Table Of Contents.
Segment Analysis
Transit mixed concrete accounted for 72.65% of the ready mix concrete market in 2025, supported by vast truck fleets, established orders, and competitive delivered costs. Shrink mixed concrete, while only a fraction of volume, is projected to post a 5.66% CAGR as builders tackle longer transport distances and tighter on-site pouring windows. Adoption is rising in Latin American metros where traffic congestion narrows scheduling buffers. Central mixed concrete remains preferred for dams and nuclear projects that specify peak uniformity, though its share inches forward only when regional megaprojects come to tender.
The ready mix concrete market size attributed to shrink mixed solutions is expected to grow by 2030, supported by performance admixtures that maintain slump for up to three hours. Producers invest in dual-purpose drum plants capable of both shrink and transit mixes to serve evolving demand with minimal downtime.
The Ready Mix Concrete Market Report is Segmented by Product Type (Central Mixed, Shrink Mixed, and Transit Mixed), End-Use Sector (Commercial, Industrial and Institutional, Infrastructure, and Residential), and Geography (Asia-Pacific, North America, Europe, South America, and Middle-East and Africa). The Market Forecasts are Provided in Terms of Volume (Cubic Meters).
Geography Analysis
Asia-Pacific dominates the ready mix concrete market with 76.55% share in 2025 and a forecast 5.06% CAGR to 2031. India's USD 1.4 trillion National Infrastructure Pipeline encompasses highways, dedicated freight corridors, and 50 million affordable homes, ensuring multi-year demand visibility. Indonesia's USD 412 billion connectivity blueprint, Vietnam's manufacturing boom, and continued Chinese public-works spending offset softness in the mainland residential sector. High-volume producers install additional plants along economic corridors such as the Delhi-Mumbai Expressway to cut haulage distances and meet carbon targets.
North America contributes stable growth as federal funding lines disburse for bridges, port dredging, and electric vehicle charging corridors. The United States poured roughly 400 million yd3 (USD 64 billion) in 2023 and expects mid-single-digit volume increases in 2025-2026. Canada advances urban transit, while Mexico's near-shoring wave fuels industrial parks along the border.
Europe's energy shock trimmed 2024 output, yet policy stimuli centered on renovation and on-shore wind platforms sustain baseline demand. Carbon price escalation under CBAM accelerates the migration to low-clinker mixes, allowing environmentally differentiated suppliers to expand shares despite broader construction contraction. Eastern European markets tap EU cohesion funds for rail and wastewater upgrades, lifting long-term tonnage potential and giving the ready mix concrete market renewed momentum region-wide.
- Adani Group
- BBMG Corporation
- Boral Limited
- Buzzi S.p.A
- CEMEX SAB de CV
- China National Building Material Group Corporation
- China West Construction Group
- CRH
- Foshan Huijiang Concrete Co., Ltd.
- Heidelberg Materials
- Holcim
- Martin Marietta Materials
- OYAK Cimento
- SAMPYO Group
- Titan Cement
- UltraTech Cement Ltd.
- Vicat SA
- Votorantim Cimentos
Additional Benefits:
- The market estimate (ME) sheet in Excel format
- 3 months of analyst support
TABLE OF CONTENTS
1 Introduction
- 1.1 Study Assumptions and Market Definition
- 1.2 Scope of the Study
2 Research Methodology
3 Executive Summary
4 Market Landscape
- 4.1 Market Overview
- 4.2 Market Drivers
- 4.2.1 Rapid urbanization and housing demand
- 4.2.2 Government mega-infrastructure pipelines
- 4.2.3 Preference for quality-controlled off-site batching
- 4.2.4 Environmental push for material efficiency
- 4.2.5 Digital dispatch and telematics optimise delivery
- 4.3 Market Restraints
- 4.3.1 Raw-material price volatility
- 4.3.2 Short workable life/logistics risk
- 4.3.3 Proliferation of on-site volumetric mixers
- 4.4 Value Chain Analysis
- 4.5 Porter's Five Forces
- 4.5.1 Bargaining Power of Suppliers
- 4.5.2 Bargaining Power of Buyers
- 4.5.3 Threat of Substitutes
- 4.5.4 Threat of New Entrants
- 4.5.5 Competitive Rivalry
5 Market Size and Growth Forecasts (Volume)
- 5.1 By Product Type
- 5.1.1 Central Mixed
- 5.1.2 Shrink Mixed
- 5.1.3 Transit Mixed
- 5.2 By End-use Sector
- 5.2.1 Commercial
- 5.2.2 Industrial and Institutional
- 5.2.3 Infrastructure
- 5.2.4 Residential
- 5.3 By Geography
- 5.3.1 Asia-Pacific
- 5.3.1.1 China
- 5.3.1.2 India
- 5.3.1.3 Japan
- 5.3.1.4 South Korea
- 5.3.1.5 Australia
- 5.3.1.6 Indonesia
- 5.3.1.7 Vietnam
- 5.3.1.8 Rest of Asia-Pacific
- 5.3.2 North America
- 5.3.2.1 United States
- 5.3.2.2 Canada
- 5.3.2.3 Mexico
- 5.3.3 Europe
- 5.3.3.1 Germany
- 5.3.3.2 France
- 5.3.3.3 United Kingdom
- 5.3.3.4 Italy
- 5.3.3.5 Spain
- 5.3.3.6 Russia
- 5.3.3.7 Rest of Europe
- 5.3.4 South America
- 5.3.4.1 Brazil
- 5.3.4.2 Argentina
- 5.3.4.3 Rest of South America
- 5.3.5 Middle-East and Africa
- 5.3.5.1 Saudi Arabia
- 5.3.5.2 United Arab Emirates
- 5.3.5.3 Rest of Middle-East and Africa
- 5.3.1 Asia-Pacific
6 Competitive Landscape
- 6.1 Market Concentration
- 6.2 Strategic Moves
- 6.3 Market Share (%)/Ranking Analysis
- 6.4 Company Profiles (includes Global level Overview, Market level overview, Core Segments, Financials as available, Strategic Information, Market Rank/Share, Products and Services, Recent Developments)
- 6.4.1 Adani Group
- 6.4.2 BBMG Corporation
- 6.4.3 Boral Limited
- 6.4.4 Buzzi S.p.A
- 6.4.5 CEMEX SAB de CV
- 6.4.6 China National Building Material Group Corporation
- 6.4.7 China West Construction Group
- 6.4.8 CRH
- 6.4.9 Foshan Huijiang Concrete Co., Ltd.
- 6.4.10 Heidelberg Materials
- 6.4.11 Holcim
- 6.4.12 Martin Marietta Materials
- 6.4.13 OYAK Cimento
- 6.4.14 SAMPYO Group
- 6.4.15 Titan Cement
- 6.4.16 UltraTech Cement Ltd.
- 6.4.17 Vicat SA
- 6.4.18 Votorantim Cimentos
7 Market Opportunities and Future Outlook
- 7.1 White-space and Unmet-Need Assessment
8 Key Strategic Questions for CEOs
 2026年全球混凝土攪拌站市場報告2026年全球混凝土攪拌站攪拌機市場報告2026年全球預拌混凝土市場報告
 預拌混凝土市場:依混凝土類型、製造方法、強度等級、應用、最終用途及通路分類-2026-2032年全球預測
 混凝土攪拌站市場分析及預測(至2035年):依類型、產品類型、服務、技術、組件、應用、材料類型、製程、最終用戶、功能分類預拌混凝土市場分析及預測(至2035年):類型、產品類型、應用、技術、組成成分、最終用戶、製程、安裝類型、設備、解決方案
 全球預拌混凝土市場規模、佔有率、趨勢和成長分析報告(2026-2034)
 日本預拌混凝土市場規模、佔有率、趨勢和預測:按產品、最終用途和地區分類,2026-2034年
 預拌混凝土市場規模、佔有率和成長分析(按產量、類型、攪拌機類型和地區分類)-2026-2033年產業預測
 2025-2029年全球預拌混凝土市場