


 |
市場調查報告書
商品編碼
1910441
動態隨機存取記憶體(DRAM):市場佔有率分析、產業趨勢與統計資料、成長預測(2026-2031)Dynamic Random Access Memory (DRAM) - Market Share Analysis, Industry Trends & Statistics, Growth Forecasts (2026 - 2031) |
||||||
※ 本網頁內容可能與最新版本有所差異。詳細情況請與我們聯繫。
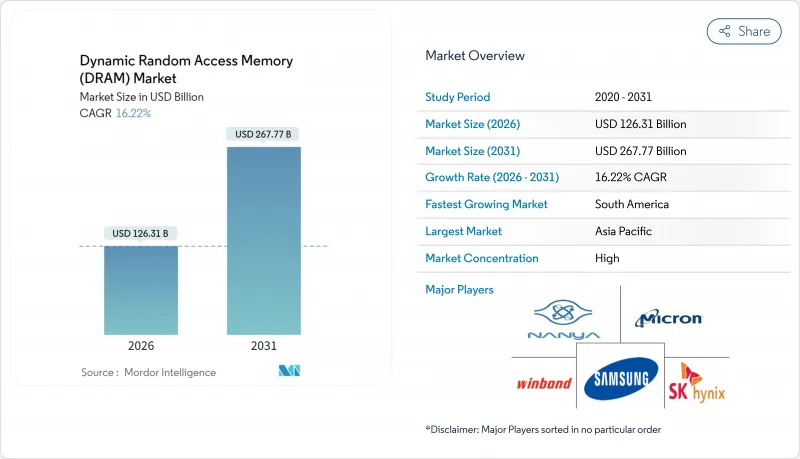
2025 年動態隨機存取記憶體 (DRAM) 市值為 1,086.8 億美元,預計到 2031 年將達到 2,677.7 億美元,高於 2026 年的 1,263.1 億美元。
預測期(2026-2031 年)的複合年成長率預計為 16.22%。
人工智慧伺服器的加速普及、高頻寬記憶體的快速成長以及日益嚴格的汽車認證要求,正促使採購標準從單純追求容量轉向兼顧頻寬、電力消耗和散熱性能。超大規模雲端營運商已於2024年開始用DDR5和HBM3E模組升級機架,亞洲行動電話OEM廠商也已將其大部分旗艦和中階機型遷移至LPDDR5X,並在2025年中期之前保持了95%以上的晶圓廠整體運轉率。分區架構正在取代傳統的ECU網路,迅速提升每輛電動車(EV)的記憶體容量,推動汽車DRAM需求達到數GB等級。同時,盈利的HBM3E和傳統DDR4產品線之間的供應競爭,正推高價格,並重塑PC、智慧型手機和工業IoT闆卡的成本績效格局。
全球DRAM市場趨勢與洞察
超大規模資料中心中人工智慧和生成式人工智慧工作負載的成長趨勢
NVIDIA 的 2025 年 Blackwell GP-AI 平台樹立了超越傳統 DDR 架構的頻寬新標桿,推動伺服器平均記憶體容量從 2024 年的 256GB 成長到 2025 年年中的數Terabyte等級。由於每個 HBM3E 堆疊都能提供超過 1TB/s 的效能,雲端服務供應商重新設計了機架,採用了以記憶體為中心的拓撲結構。三星量產就緒的 CXL 2.0 DRAM 使 Azure 等服務供應商能夠跨主機共享內存,從而提高利用率並推遲對額外計算節點的資本支出。供應商隨即調整晶圓生產,從 DDR4 轉向 HBM,導致傳統等級的供應短缺,同時加速了高階市場的利潤成長。
亞太地區5G旗艦和中階智慧型手機中LPDDR晶片的應用迅速擴展
美光的1年期LPDDR5X樣品(運行速度為9200 MT/s)於2025年第一季開始向行動電話製造商交付,功耗降低20%,並將中國和印度機型的標準配置記憶體從8GB提升至12GB。小米、OPPO和傳音等新興品牌正在簽署遠期合約,佔用亞太地區越來越多的晶圓廠產能,迫使供應商調整行動和資料中心生產線之間的產能分配。這種轉變使得LPDDR的成長速度超過了自2015年LPDDR4量產以來任何其他行動記憶體。
週期性的供需關係導致平均售價(ASP)出現劇烈波動。
由於市場對高利潤率的HBM內存的需求不斷成長,晶圓廠將DDR4內存的投產時間推遲至2025年初,導致主流內存模組現貨價格在5月份飆升了50%。 DDR5記憶體合約價格也上漲了15%至20%,促使OEM廠商透過重新設計產品物料清單或超額訂購來對沖價格進一步上漲的風險。這種反饋循環加劇了市場波動,惡化了生產計畫的前景,並使DRAM市場的預期複合年成長率下降了2個百分點以上。
細分市場分析
到2025年,DDR5在DRAM市場中所佔佔有率雖小,但成長速度最快,預計複合年成長率將達到29.1%,這主要得益於JEDEC的JESD79-5C標準更新,該標準將性能上限提升至8,800 Mbps。這項技術飛躍使得一級雲端供應商能夠採用DDR5和HBM3E混合配置,從而使每個插槽的有效頻寬翻倍。美光的1Y DDR5在2025年2月實現了9,200 MT/s的效能,這一突破促使伺服器OEM廠商加快了平台更新換代。同時,DDR4在2025年之前保持了44.78%的DRAM市場佔有率,因為企業IT預算繼續優先考慮成本最佳化配置。隨著工業和汽車設計向新標準過渡,傳統的DDR3和DDR2市場佔有率持續下滑。
供應商面臨艱難的權衡。每將一片晶圓重新分配給DDR5,就意味著用於PC的DDR4晶片供應減少,導致中國筆記型電腦組裝的成本飆升。長期持有DDR4庫存的擁有者利用套利機會,自2017年起以溢價出售庫存。 JEDEC推出的新型CAMM2外形規格消除了SO-DIMM的高度限制,使筆記型電腦和邊緣伺服器能夠採用更高密度的單層封裝。這些封裝技術的進步推動了動態隨機存取記憶體(DRAM)市場向更高頻寬標準的轉變,無論是消費性裝置還是企業級裝置。
預計到2025年,19nm至10nm製程範圍將佔DRAM市場規模的41.85%,到2031年將成長24.4%,因為供應商在不增加10nm以下製程產量比率風險的前提下,提高了每片晶圓的晶粒數量。採用EUV技術的1Y製程已於2025年第一季開始量產並實現獲利,但其產量比率比成熟的1z製程至少低8個百分點。因此,許多裝置製造商續簽了1z和1y等級的合約以降低成本風險,從而提高了中節點製程的產量。
SK海力士公佈了垂直閘極DRAM藍圖,計劃從2027年起實現晶圓級堆疊,這標誌著晶片製造製程將從橫向微縮長期轉向3D結構。平面微縮技術的反覆嘗試,在計入光罩模組、材料成本和折舊免稅額後,成本降低幅度不足12%,迫使晶圓廠不僅要探索幾何尺寸的縮小,還要進行結構重新設計。行動和消費性電子產品對成本的高度敏感性,導致了分級生產模式的出現,價格敏感型產品仍保留20nm以上的製程節點。這種模式實現了晶圓廠生產的多元化,並增強了整體營收的穩定性。
動態隨機存取記憶體 (DRAM) 市場按架構(DDR2 及更早版本、DDR3、DDR4、DDR5、LPDDR、GDDR)、技術節點(20nm 及以上、19nm-10nm、10nm 以下)、容量(最高 4GB、4-8GB、8-16GB、16GB 以上)、容量(GB 及以上)和筆記型電腦、伺服器和超大規模資料中心、其他)以及地區(北美、歐洲、亞太地區、南美、中東和非洲)進行細分。
區域分析
預計到2025年,亞太地區將維持30.88%的營收佔有率,主要得益於韓國、台灣和中國當地晶圓廠的集中佈局。韓國供應商承諾在2028年將產能擴大120兆韓元(約840億美元),旨在維持主導。同時,台灣代工組裝透過利用邏輯節點前端技術並引入矽穿孔(TSV)技術來降低熱阻,從而擴展了其先進封裝生產線,以滿足不斷成長的HBM4需求。
北美是最大的消費市場,這主要得益於超大規模營運商加速機架更新以及美國汽車製造商整合區域控制器。美光科技獲得了《晶片法案》(CHIPS Act)提供的61億美元資金籌措,用於建造一座新的巨型晶圓廠,此舉旨在降低地緣政治風險並縮短國內客戶的前置作業時間。歐洲繼續專注於汽車和工業應用領域的技術,德國原始設備製造商(OEM)要求產品具備更寬的溫度範圍和更長的使用壽命,這使得產品能夠獲得更高的價格。
預計南美洲將以21.6%的複合年成長率成長,這主要得益於巴西、阿根廷和墨西哥大力發展電子組裝生態系統,以實現供應鏈在地化。政策獎勵降低了國產組裝記憶體組件的進口關稅,促使籌資策略發生雖小但意義重大的轉變。中東和非洲地區在波灣合作理事會資料中心建設以及奈及利亞和肯亞智慧型手機普及率上升的推動下,實現了中等個位數的成長,但政治不穩定仍然阻礙著智慧型手機的廣泛應用。這些區域發展表明,儘管製造活動仍集中在東亞,但充滿活力的隨機存取記憶體(DRAM)市場正在實現收入來源多元化。
其他福利:
- Excel格式的市場預測(ME)表
- 3個月的分析師支持
目錄
第1章 引言
- 研究假設和市場定義
- 調查範圍
第2章調查方法
第3章執行摘要
第4章 市場情勢
- 市場概覽
- 市場促進因素
- 超大規模資料中心中人工智慧和生成式人工智慧工作負載的成長趨勢
- 亞太地區5G旗艦和中階智慧型手機LPDDR採用率激增
- 汽車區域/域控制器中從NOR到高溫DRAM的過渡
- 邊緣人工智慧和工業IoT闆卡需要擴展溫度範圍的DRAM模組
- 雲端服務供應商的 CXL 連線記憶體池遷移
- 市場限制
- 週期性的供需關係導致平均售價(ASP)出現劇烈波動。
- 10nm以下EUV製程產量比率下降問題
- 對中國的地緣政治出口限制限制了高密度伺服器DRAM的出貨量。
- 價值鏈分析
- 技術展望
- 監理展望
- 波特五力分析
- 供應商的議價能力
- 買方的議價能力
- 新進入者的威脅
- 替代品的威脅
- 競爭對手之間的競爭
- 定價分析
- DRAM現貨價格(每GB)
- 價格趨勢分析
- 宏觀經濟影響分析
第5章 市場規模與成長預測
- 建築設計
- DDR2 及更早世代
- DDR3
- DDR4
- DDR5
- LPDDR
- GDDR
- 依技術節點
- 20奈米或以上
- 19nm-10nm
- 小於 10 奈米(極紫外光)
- 按產能
- 4 GB 或更少
- 4-8 GB
- 8-16 GB
- 16GB 或更多
- 最終用途
- 智慧型手機和平板電腦
- 個人電腦和筆記型電腦
- 伺服器和超大規模資料中心
- 圖形和遊戲主機
- 汽車電子
- 家用電子電器(機上盒、智慧電視、VR/AR)
- 工業和物聯網設備
- 其他
- 按地區
- 北美洲
- 美國
- 加拿大
- 墨西哥
- 歐洲
- 德國
- 法國
- 英國
- 北歐國家
- 其他歐洲地區
- 亞太地區
- 中國
- 台灣
- 韓國
- 日本
- 印度
- 亞太其他地區
- 南美洲
- 巴西
- 智利
- 阿根廷
- 其他南美洲
- 中東和非洲
- 中東
- 沙烏地阿拉伯
- 阿拉伯聯合大公國
- 土耳其
- 其他中東地區
- 非洲
- 南非
- 其他非洲地區
- 中東
- 北美洲
第6章 競爭情勢
- 市場集中度
- 策略趨勢
- 市佔率分析
- 公司簡介
- Samsung Electronics Co., Ltd.
- SK Hynix Inc.
- Micron Technology Inc.
- ChangXin Memory Technologies Inc.(CXMT)
- Nanya Technology Corporation
- Winbond Electronics Corporation
- Powerchip Semiconductor Manufacturing Corp.(PSMC)
- Fujian Jinhua Integrated Circuit Co., Ltd.(JHICC)
- GigaDevice Semiconductor(Beijing)Inc.
- Etron Technology Inc.
- Integrated Silicon Solution Inc.(ISSI)
- Elite Semiconductor Memory Technology Inc.(ESMT)
- Zentel Electronics Corporation
- Alliance Memory, Inc.
- AP Memory Technology Corp.
- Phison Electronics Corporation
- JSC Mikron(Mikron Group)
- AMIC Technology Corporation
- Utron Technology Inc.
- Hua Hong Semiconductor Limited
第7章 市場機會與未來展望
The Dynamic Random Access Memory market was valued at USD 108.68 billion in 2025 and estimated to grow from USD 126.31 billion in 2026 to reach USD 267.77 billion by 2031, at a CAGR of 16.22% during the forecast period (2026-2031).
Accelerated adoption of AI-centric servers, the steep ramp-up of high-bandwidth memory, and tighter automotive qualification requirements have shifted purchasing criteria from capacity alone to a balanced focus on bandwidth, power, and thermal performance. Hyperscale cloud operators began refreshing racks with DDR5 and HBM3E modules during 2024, while handset OEMs in Asia moved much of their flagship and mid-tier portfolios to LPDDR5X, collectively keeping fab utilization above 95% through mid-2025. Memory content per electric vehicle rose quickly as zonal architectures replaced traditional ECU networks, pushing automotive DRAM demand into multi-gigabyte territory. At the same time, supply allocation conflicts between lucrative HBM3E and legacy DDR4 lines triggered price surges that reshaped cost-performance trade-offs for PCs, smartphones, and industrial IoT boards.
Global Dynamic Random Access Memory (DRAM) Market Trends and Insights
Ascending content footprint of AI and generative-AI workloads in hyperscale data centers
NVIDIA's 2025 Blackwell GP-AI platforms established bandwidth baselines that eclipsed conventional DDR architectures, lifting average server memory from 256 GB in 2024 to multi-terabyte deployments by mid-2025. With each HBM3E stack delivering more than 1 TB/s, cloud operators re-architected racks around memory-centric topologies. Samsung delivered production-ready CXL 2.0 DRAM that allowed Azure and other providers to pool memory across hosts, improving utilization while deferring capex on additional compute nodes. Suppliers consequently shifted wafer starts from DDR4 to HBM, triggering tightness in legacy grades but accelerating profit growth in the premium segment.
Soaring LPDDR adoption in 5G flagship and mid-tier smartphones across APAC
Micron's 1Y LPDDR5X samples running at 9,200 MT/s reached handset makers in Q1 2025, cutting power by 20% and raising baseline configurations in Chinese and Indian models from 8 GB to 12 GB RAM. Xiaomi, OPPO, and emerging brands such as Transsion are locked in forward contracts that consume a growing slice of APAC fab capacity, forcing suppliers to juggle commitments between mobile and datacenter lines. The shift gave LPDDR a steeper growth curve than any other mobile memory since LPDDR4 entered mass production in 2015.
Supply-demand cyclicality driving extreme ASP volatility
High-margin HBM pull-ins persuaded fabs to postpone DDR4 runs early in 2025, igniting a 50% spot-price jump for mainstream modules in May. DDR5 contracts also climbed 15-20%, prompting OEMs to re-engineer product bills of materials or over-order to hedge against further spikes. The feedback loop amplified volatility and cut visibility for production planning, knocking two-plus points from the Dynamic Random Access Memory market's forecast CAGR.
Other drivers and restraints analyzed in the detailed report include:
- Automotive zonal and domain controllers migrating from NOR to high-temperature DRAM
- Edge-AI and industrial IoT boards requiring extended-temperature DRAM modules
- Yield-erosion challenges below 10 nm EUV nodes
For complete list of drivers and restraints, kindly check the Table Of Contents.
Segment Analysis
DDR5 accounted for a minimal share of the Dynamic Random Access Memory market in 2025, yet carried the fastest 29.1% forecast CAGR, underpinned by JEDEC's JESD79-5C update that lifted performance ceilings to 8,800 Mbps. That technical leap allowed tier-1 cloud builders to run mixed DDR5-HBM3E configurations that doubled per-socket effective bandwidth. Micron's 1Y DDR5 reached 9,200 MT/s in February 2025, a milestone that pushed server OEMs to pull forward platform refreshes. Meanwhile, DDR4 retained a 44.78% Dynamic Random Access Memory market share through 2025 because corporate IT budgets still favoured cost-optimized configurations. Legacy DDR3 and DDR2 footprints continued to shrink as industrial and automotive design-ins migrated to newer standards.
Suppliers confronted a balancing act: every wafer reassigned to DDR5 meant fewer DDR4 chips for PCs, driving cost spikes that flowed downstream to notebook assemblers in China. Holders of long-tail inventory exploited arbitrage trading, unloading stockpiled DDR4 at premiums unseen since 2017. JEDEC's new CAMM2 form factor removed the height constraints of SO-DIMMs, letting laptops and edge servers adopt denser single-sided stacks. Those packaging gains fed into the Dynamic Random Access Memory market's momentum toward higher-bandwidth norms across consumer and enterprise devices.
The 19 nm-10 nm bracket held 41.85% of the Dynamic Random Access Memory market size in 2025 and is projected to grow 24.4% through 2031 as suppliers squeeze additional dies per wafer without plunging into the yield-risk chasm of sub-10 nm. EUV-enabled 1Y production began shipping revenue units in Q1 2025, but line yields remained at least eight points below mature 1z lines. Consequently, many device makers renewed agreements for 1z and 1y grades to buffer cost risk, giving mid-node processes a volume boost.
SK Hynix laid out a vertical-gate DRAM roadmap that promises wafer-level stacking beyond 2027, signalling the long-term pivot from lateral scaling to 3D architectures. Each successive planar shrink delivers less than 12% cost reduction after mask set, materials, and depreciation are factored in, nudging fabs to look for structural redesigns rather than geometrical shrink alone. Cost sensitivity in mobile and consumer electronics kept >=20 nm nodes alive for price-focused SKUs, ensuring a stratified production mix that diversified fab output and underpinned overall revenue resiliency.
Dynamic Random Access Memory Market is Segmented by Architecture (DDR2 and Earlier, DDR3, DDR4, DDR5, LPDDR, and GDDR), Technology Node (>=20 Nm, 19 Nm-10 Nm, and <10 Nm), Capacity (<=4 GB, 4-8 GB, 8-16 GB, and >=16 GB), End-Use Application (Smartphones and Tablets, Pcs and Laptops, Servers and Hyperscale Data Centers, and More), and Geography (North America, Europe, Asia-Pacific, South America, and Middle East and Africa).
Geography Analysis
Asia-Pacific retained a 30.88% revenue position in 2025 on the strength of fabs clustered across South Korea, Taiwan, and mainland China. South Korean suppliers pledged KRW 120 trillion (USD 84 billion) for capacity build-outs through 2028, a figure intended to safeguard leadership in both HBM and traditional DRAM production. Taiwan's contract assembly houses, meanwhile, expanded advanced packaging lines to service rising HBM4 demand, leveraging front-end know-how from logic nodes to introduce Through-Silicon-Via innovations that reduce thermal resistance.
North America formed the largest consumption market as hyperscale builders accelerated rack refreshes and automakers in the United States integrated zonal controllers. Micron secured USD 6.1 billion CHIPS Act funding to construct a new megafab, a move aimed at de-risking geopolitical exposure and shortening lead times for domestic clients. Europe maintained a technology focus on automotive and industrial applications, with German OEMs insisting on extended temperature and longevity guarantees that fetched premium pricing.
South America is forecast to grow at a 21.6% CAGR as Brazil, Argentina, and Mexico nurture electronics assembly ecosystems to localize supply. Policy incentives cut import tariffs on memory components assembled domestically, creating modest but meaningful shifts in sourcing strategies. The Middle East and Africa displayed mid-single-digit growth anchored by data-center build-outs in Gulf Cooperation Council states and rising smartphone penetration in Nigeria and Kenya, yet political instability continued to temper wider adoption. Combined, these regional narratives underscore how the Dynamic Random Access Memory market diversifies revenue streams even as manufacturing remains concentrated in East Asia.
- Samsung Electronics Co., Ltd.
- SK Hynix Inc.
- Micron Technology Inc.
- ChangXin Memory Technologies Inc. (CXMT)
- Nanya Technology Corporation
- Winbond Electronics Corporation
- Powerchip Semiconductor Manufacturing Corp. (PSMC)
- Fujian Jinhua Integrated Circuit Co., Ltd. (JHICC)
- GigaDevice Semiconductor (Beijing) Inc.
- Etron Technology Inc.
- Integrated Silicon Solution Inc. (ISSI)
- Elite Semiconductor Memory Technology Inc. (ESMT)
- Zentel Electronics Corporation
- Alliance Memory, Inc.
- AP Memory Technology Corp.
- Phison Electronics Corporation
- JSC Mikron (Mikron Group)
- AMIC Technology Corporation
- Utron Technology Inc.
- Hua Hong Semiconductor Limited
Additional Benefits:
- The market estimate (ME) sheet in Excel format
- 3 months of analyst support
TABLE OF CONTENTS
1 INTRODUCTION
- 1.1 Study Assumptions and Market Definition
- 1.2 Scope of the Study
2 RESEARCH METHODOLOGY
3 EXECUTIVE SUMMARY
4 MARKET LANDSCAPE
- 4.1 Market Overview
- 4.2 Market Drivers
- 4.2.1 Ascending Content Footprint of AI and Generative-AI Workloads in Hyperscale Data Centers
- 4.2.2 Soaring LPDDR Adoption in 5G Flagship and Mid-Tier Smartphones Across APAC
- 4.2.3 Automotive Zonal/Domain Controllers Migrating from NOR to High-Temperature DRAM
- 4.2.4 Edge-AI and Industrial IoT Boards Requiring Extended-Temperature DRAM Modules
- 4.2.5 Cloud Service Providers' Transition to CXL-attached Memory Pools
- 4.3 Market Restraints
- 4.3.1 Supply-Demand Cyclicality Driving Extreme ASP Volatility
- 4.3.2 Yield-Erosion Challenges Below 10 nm EUV Nodes
- 4.3.3 Geopolitical Export Controls on China Limiting High-density Server DRAM Shipments
- 4.4 Value Chain Analysis
- 4.5 Technological Outlook
- 4.6 Regulatory Outlook
- 4.7 Porter's Five Forces Analysis
- 4.7.1 Bargaining Power of Suppliers
- 4.7.2 Bargaining Power of Buyers
- 4.7.3 Threat of New Entrants
- 4.7.4 Threat of Substitute Products
- 4.7.5 Intensity of Competitive Rivalry
- 4.8 Pricing Analysis
- 4.8.1 DRAM Spot Price (Per GB)
- 4.8.2 Pricing Trends Analysis
- 4.9 Macroeconomic Impact Analysis
5 MARKET SIZE AND GROWTH FORECASTS (VALUE)
- 5.1 By Architecture
- 5.1.1 DDR2 and Earlier
- 5.1.2 DDR3
- 5.1.3 DDR4
- 5.1.4 DDR5
- 5.1.5 LPDDR
- 5.1.6 GDDR
- 5.2 By Technology Node
- 5.2.1 >=20 nm
- 5.2.2 19 nm - 10 nm
- 5.2.3 <10 nm (EUV)
- 5.3 By Capacity
- 5.3.1 <=4 GB
- 5.3.2 4 - 8 GB
- 5.3.3 8 - 16 GB
- 5.3.4 >=16 GB
- 5.4 By End-use Application
- 5.4.1 Smartphones and Tablets
- 5.4.2 PCs and Laptops
- 5.4.3 Servers and Hyperscale Data Centers
- 5.4.4 Graphics and Gaming Consoles
- 5.4.5 Automotive Electronics
- 5.4.6 Consumer Electronics (Set-top Boxes, Smart TV, VR/AR)
- 5.4.7 Industrial and IoT Devices
- 5.4.8 Others
- 5.5 By Geography
- 5.5.1 North America
- 5.5.1.1 United States
- 5.5.1.2 Canada
- 5.5.1.3 Mexico
- 5.5.2 Europe
- 5.5.2.1 Germany
- 5.5.2.2 France
- 5.5.2.3 United Kingdom
- 5.5.2.4 Nordics
- 5.5.2.5 Rest of Europe
- 5.5.3 Asia-Pacific
- 5.5.3.1 China
- 5.5.3.2 Taiwan
- 5.5.3.3 South Korea
- 5.5.3.4 Japan
- 5.5.3.5 India
- 5.5.3.6 Rest of Asia-Pacific
- 5.5.4 South America
- 5.5.4.1 Brazil
- 5.5.4.2 Chile
- 5.5.4.3 Argentina
- 5.5.4.4 Rest of South America
- 5.5.5 Middle East and Africa
- 5.5.5.1 Middle East
- 5.5.5.1.1 Saudi Arabia
- 5.5.5.1.2 United Arab Emirates
- 5.5.5.1.3 Turkey
- 5.5.5.1.4 Rest of Middle East
- 5.5.5.2 Africa
- 5.5.5.2.1 South Africa
- 5.5.5.2.2 Rest of Africa
- 5.5.5.1 Middle East
- 5.5.1 North America
6 COMPETITIVE LANDSCAPE
- 6.1 Market Concentration
- 6.2 Strategic Moves
- 6.3 Market Share Analysis
- 6.4 Company Profiles (includes Global-level Overview, Market-level Overview, Core Segments, Financials as available, Strategic Information, Market Rank/Share for key companies, Products and Services, and Recent Developments)
- 6.4.1 Samsung Electronics Co., Ltd.
- 6.4.2 SK Hynix Inc.
- 6.4.3 Micron Technology Inc.
- 6.4.4 ChangXin Memory Technologies Inc. (CXMT)
- 6.4.5 Nanya Technology Corporation
- 6.4.6 Winbond Electronics Corporation
- 6.4.7 Powerchip Semiconductor Manufacturing Corp. (PSMC)
- 6.4.8 Fujian Jinhua Integrated Circuit Co., Ltd. (JHICC)
- 6.4.9 GigaDevice Semiconductor (Beijing) Inc.
- 6.4.10 Etron Technology Inc.
- 6.4.11 Integrated Silicon Solution Inc. (ISSI)
- 6.4.12 Elite Semiconductor Memory Technology Inc. (ESMT)
- 6.4.13 Zentel Electronics Corporation
- 6.4.14 Alliance Memory, Inc.
- 6.4.15 AP Memory Technology Corp.
- 6.4.16 Phison Electronics Corporation
- 6.4.17 JSC Mikron (Mikron Group)
- 6.4.18 AMIC Technology Corporation
- 6.4.19 Utron Technology Inc.
- 6.4.20 Hua Hong Semiconductor Limited
7 MARKET OPPORTUNITIES AND FUTURE OUTLOOK
- 7.1 White-space and Unmet-need Assessment
 動態隨機存取記憶體 (DRAM) 市場規模、佔有率、趨勢和預測:按類型、技術、最終用戶和地區分類,2026-2034 年
 DRAM 模組及組件市場:按產品類型、應用和銷售管道分類 - 全球市場預測 2026–2032動態隨機存取記憶體(DRAM)市場:按類型、技術、架構、容量、終端用戶產業、分銷管道和應用分類-2026-2032年全球市場預測
 2026年全球動態隨機存取記憶體市場報告
 動態隨機存取記憶體 (DRAM) 市場:按架構、最終用途、容量、技術節點、國家和地區分類 - 全球產業分析、市場規模、市場佔有率和預測 (2025–2032)全球動態隨機存取記憶體(DRAM)市場:按產品類型、密度、最終用途產業、應用、國家和地區分類-產業分析、市場規模、佔有率和預測(2025-2032)按路徑、記憶體容量、電壓和應用分類的加固型DRAM市場,全球預測(2026-2032年)
 動態隨機存取記憶體 (DRAM) 市場分析及至 2035 年預測:按類型、產品類型、技術、應用、最終用戶、外形、裝置、功能和安裝類型分類2026年全球DRAM模組及組件市場報告2026年全球電阻式隨機存取記憶體(ReRAM)市場報告