


 |
市場調查報告書
商品編碼
1906948
生物促效劑:市場佔有率分析、產業趨勢與統計、成長預測(2026-2031)Biostimulants - Market Share Analysis, Industry Trends & Statistics, Growth Forecasts (2026 - 2031) |
||||||
※ 本網頁內容可能與最新版本有所差異。詳細情況請與我們聯繫。
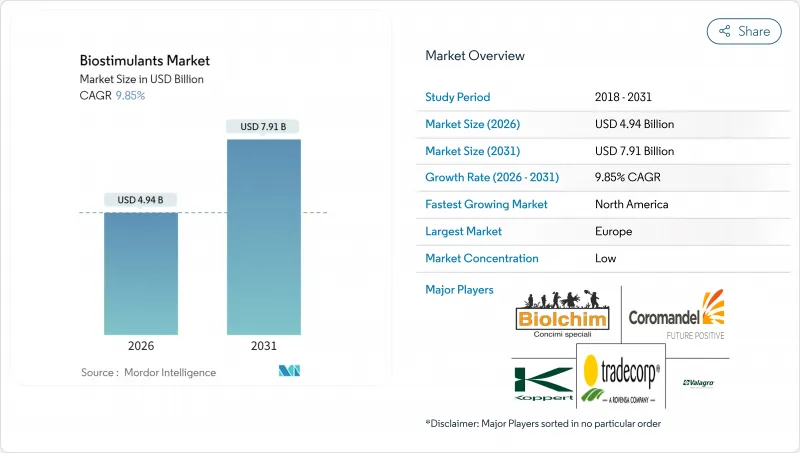
2025年生物促效劑市值為45億美元,預計2031年將達到79.1億美元,高於2026年的49.4億美元。
預計在預測期(2026-2031 年)內,複合年成長率將達到 9.85%。
這一成長勢頭源於對永續作物投入品的強勁需求、日益統一的監管定義以及生物材料與產量穩定性之間聯繫的不斷積累的證據。農民正將生物促效劑納入傳統的土壤肥力管理方案,以提高作物的抗逆性並合格新的碳權額度。同時,生產商正加速推出將微生物群落與胺基酸和腐植酸結合的產品,力求廣泛的兼容性。儘管歐洲憑藉早期明確的監管政策繼續保持創新中心的地位,但北美目前正經歷著最快速的推廣應用,這主要得益於美國「氣候智慧型商品夥伴關係計畫」(Climate Smart Commodity Partnership program),該計畫為田間應用成本提供高達75%的補貼。此外,美國植物營養官員協會(AAPFCO)的努力已使美國所有司法管轄區的註冊流程標準化,核准時間縮短了約三分之一,進一步支持了全球擴張。
全球生物促效劑市場趨勢與洞察
對有機食品的需求不斷成長
美國的有機農地面積持續擴大,印證了消費者願意為使用生物投入物種植的農產品支付溢價。歐洲的「從農場到餐桌」框架旨在2030年實現25%的農地有機化,該框架正在加速生產者採用生物促效劑,以確保在過渡期內的產量。美國國家有機計劃發布的指南明確了核准的生物促效劑類別,消除了先前在認證方面的模糊之處。價格的上漲,加上專業零售通路需求的激增,正在推動農場層面高純度胺基酸和海藻萃取物的投資回報。
政府補助和支持條例
氣候智慧型商品夥伴關係已撥出大量資金用於永續種植實踐的補貼,符合條件的種植者可收回高達75%的生物促效劑成本。加州健康土壤計畫也提供額外的成本分攤津貼。在產業方面,美國植物營養官員協會統一了各州的定義,減少了製造商重複的資料提交流程,並加快了產品推廣速度。歐洲通用農業政策生態計劃也進行了類似的協調,讓農民將生物促效劑納入其養分管理計劃,並申請補助。
監理定義不統一
在歐盟以外,許多司法管轄區仍將生物促效劑歸類為農藥,這增加了合規成本,因為需要提供額外的毒性數據。東南亞和非洲國家通常沒有專門的審查委員會,這可能導致產品上市延遲長達兩個種植季。國際標準化組織 (ISO) 的一個工作小組正在製定全球指南,但預計實施時間將推遲到 2027 年以後。
細分市場分析
預計到2025年,胺基酸將佔總收入的30.62%,這證實了其在施肥灌溉和葉面噴布計畫中作為高價值園藝作物非生物脅迫管理手段的廣泛應用。每英畝40-80美元的相對收益可抵消15-25美元的投入成本,這促使人們繼續在番茄、辣椒和黃瓜種植系統中使用氨基酸。氨基酸與滴灌化學品的兼容性以及已證實的儲存穩定性,也使其持續受到保護性種植者的青睞。園藝一體化企業在尋求符合美國國家有機計劃(NOP)法規時也傾向於選擇胺基酸,因為大多數酶解途徑都符合有機加工標準。水溶性腐植酸仍是成長最快的子類別,預計到2031年將以12.45%的複合年成長率成長。腐植酸的土壤改良機制,例如螯合微量元素和提高陽離子交換能力,受到注重根際健康的玉米和大豆種植者的青睞。
製造商正著重強調其產品與傳統尿素-硝酸銨溶液的交叉相容性,以擴大其在主流農作物中的應用。改良的顆粒包覆技術可實現均勻的粒徑,避免以往阻礙其使用的設備堵塞問題。蛋白質水解物在經認證的有機產業鏈中持續佔據市場佔有率,其中動物源氨基酸混合物可在一次施用中同時提供氮和碳。海藻萃取物仍然至關重要,但面臨供應不穩定的問題,促使人們利用精準發酵技術開發合成類似物。富裡酸在採用變數噴霧器的精密農業農業種植者中越來越受歡迎,其低分子量使其能夠快速滲透組織,並可透過頻譜無人機影像進行持續的反應監測。
生物促效劑市場報告按形態(胺基酸、富裡酸、腐植酸等)、作物類型(經濟作物、園藝作物、田間作物等)和地區(北美、南美、歐洲等)進行細分。市場預測以價值(美元)和數量(公噸)為單位。
區域分析
2025年,歐洲在全球農業價值佔有率中維持38.62%的領先地位,這得益於成熟的監管體系和通用農業政策生態方案中完善的補貼機制。荷蘭生產商正在使用適用於化學肥料灌溉的腐植酸,既保證了產量上限,又減少了硝酸鹽徑流造成的損失。丹麥耕地農民利用其25%的有機耕地目標,以優惠利率獲得銀行貸款,條件是他們在營養計劃中加入生物促效劑,從而將經濟獎勵與生物技術的採用相結合。波蘭和羅馬尼亞的東歐生產商正受益於農村發展支柱計畫提供的知識轉移和資金支持,這為該地區繼續保持主導地位奠定了基礎。
預計北美將呈現最高的成長軌跡,到2031年複合年成長率將達到12.35%。美國夥伴關係津貼吸引了像Archer Daniels Midland這樣的企業聚合商贊助跨州先導計畫並促進面積調整。愛荷華州立大學和堪薩斯州立大學等高校正在透過提供開放取用的田間試驗資料集來降低農場層面的試驗風險,從而加速玉米帶地區的推廣應用。加拿大的永續農業策略也體現了類似的獎勵,讓小麥和菜籽生產商在從合成生長調節劑轉向生物增效劑時,符合溫室排放減排通訊協定。
亞太地區展現出多層次的潛力。中國的國家生物農業指令將生物促效劑列為戰略投入品,但分散的地方監管體系阻礙了其統一推廣應用。印度的有機認證轉移計畫正在推動對高價值巴斯馬蒂米和芒果出口的需求,但高純度原料的供應仍然不穩定。南美洲,尤其是巴西,大豆種植者正透過採用腐植酸來控制酸性土壤中的鋁毒害,取得了進展。阿根廷的犁地種植系統正在將微生物種子披衣納入更廣泛的再生農業方案。儘管中東和非洲地區仍處於發展階段,但以色列和摩洛哥已開始探索在灌溉受限的園藝種植中,利用富裡酸根部灌溉來緩解鹽鹼化通訊協定。
其他福利:
- Excel格式的市場預測(ME)表
- 3個月的分析師支持
目錄
第1章 引言
- 研究假設和市場定義
- 調查範圍
- 調查方法
第2章 報告
第3章執行摘要和主要發現
第4章:主要產業趨勢
- 有機耕作面積
- 人均有機產品支出
- 法律規範
- 阿根廷
- 澳洲
- 巴西
- 加拿大
- 中國
- 埃及
- 法國
- 德國
- 印度
- 印尼
- 義大利
- 日本
- 墨西哥
- 荷蘭
- 奈及利亞
- 菲律賓
- 俄羅斯
- 南非
- 西班牙
- 泰國
- 土耳其
- 英國
- 美國
- 越南
- 價值鍊和通路分析
- 市場促進因素
- 對有機食品的需求不斷成長
- 政府補貼和扶持性法規
- 永續性生產者的採用
- 產量和非生物脅迫改善的證據
- 將種子披衣和微量營養素混合物整合在一起
- 排碳權貨幣化的可能性
- 市場限制
- 監理定義不一致
- 農民缺乏意識,對效果持懷疑態度
- 與微生物接種劑和生物肥料的競爭
- 海藻原料供應風險
第5章 市場規模和成長預測(價值和數量)
- 按形式
- 胺基酸
- 富裡酸
- 腐植酸
- 蛋白質水解物
- 海藻萃取物
- 其他生物促效劑市場
- 按作物類型
- 經濟作物
- 園藝作物
- 田間作物
- 按地區
- 非洲
- 按國家/地區
- 埃及
- 奈及利亞
- 南非
- 其他非洲地區
- 按國家/地區
- 亞太地區
- 按國家/地區
- 澳洲
- 中國
- 印度
- 印尼
- 日本
- 菲律賓
- 泰國
- 越南
- 亞太其他地區
- 按國家/地區
- 歐洲
- 按國家/地區
- 法國
- 德國
- 義大利
- 荷蘭
- 俄羅斯
- 西班牙
- 土耳其
- 英國
- 其他歐洲地區
- 按國家/地區
- 中東
- 按國家/地區
- 伊朗
- 沙烏地阿拉伯
- 其他中東地區
- 按國家/地區
- 北美洲
- 按國家/地區
- 加拿大
- 墨西哥
- 美國
- 北美其他地區
- 按國家/地區
- 南美洲
- 按國家/地區
- 阿根廷
- 巴西
- 南美洲其他地區
- 按國家/地區
- 非洲
第6章 競爭情勢
- 重大策略舉措
- 市佔率分析
- 公司概況
- 公司簡介
- Valagro(Syngenta Group)
- Trade Corporation International(Rovensa Group)
- Atlantica Agricola SA
- Agriculture Solutions Inc.
- Biolchim SpA(JM Huber Corporation)
- Coramandel International Limited
- UPL Ltd.
- BASF SE
- Bayer AG
- FMC Corporation
- Koppert Group
- Gowan Company
- Haifa Group(Trance Resource Minerals Pte.)
- BioAtlantis Ltd.
第7章:CEO們需要思考的關鍵策略問題
The biostimulants market was valued at USD 4.5 billion in 2025 and estimated to grow from USD 4.94 billion in 2026 to reach USD 7.91 billion by 2031, at a CAGR of 9.85% during the forecast period (2026-2031).
Surging demand for sustainable crop inputs, growing alignment of regulatory definitions, and mounting evidence linking biologicals with yield stability are anchoring this momentum. Farmers are integrating biostimulants with conventional fertility programs to widen stress-tolerance ranges and qualify for emerging carbon-credit schemes, while manufacturers accelerate product launches that pair microbial consortia with amino and humic acids for broader compatibility. Europe continues to serve as the innovation hub because of early regulatory clarity, although North America now records the sharpest deployment curve under the United States Department of Agriculture Climate-Smart Commodities Partnership, which reimburses up to 75% of field-level application costs. Global expansion is further supported by the Association of American Plant Food Control Officials' initiative that standardizes registration pathways across the United States jurisdictions, cutting approval times by nearly one-third.
Global Biostimulants Market Trends and Insights
Growing demand for organic food products
Organic acreage in the United States is continuously expanding, confirming consumer willingness to pay premiums for produce cultivated with biological inputs. Europe's Farm to Fork framework, which targets 25 % organic farmland by 2030, quickens biostimulant uptake among producers seeking to safeguard yields during transition periods. National Organic Program guidance now lists approved biostimulant categories, clearing prior ambiguity around certification. Parallel surges in specialty retail channels strengthen price realization, driving farm-level return on investment for high-purity amino and seaweed extracts.
Government subsidies and supportive regulations
The Climate-Smart Commodities Partnership sets aside significant fund for sustainable practice reimbursements, with eligible growers recouping as much as 75 % of biostimulant costs. California's Healthy Soils Program layers additional cost-share grants. On the industry side, the Association of American Plant Food Control Officials harmonized state-by-state definitions, trimming redundant data filing steps for manufacturers and expediting product rollouts. Similar alignment across Europe's Common Agricultural Policy eco-schemes allows farmers to claim payments after integrating biostimulants into nutrient-management plans.
Heterogeneous regulatory definitions
Outside the European Union, many jurisdictions still file biostimulants under pesticide statutes, adding toxicological data requirements that inflate compliance costs. Countries in Southeast Asia and Africa often lack dedicated review committees, delaying market entry by up to two seasons. Pending International Organization for Standardization workstreams aim to deliver global guidelines, yet implementation timelines stretch beyond 2027.
Other drivers and restraints analyzed in the detailed report include:
- Sustainability-driven grower adoption
- Yield and abiotic-stress improvement evidence
- Low farmer awareness and efficacy skepticism
For complete list of drivers and restraints, kindly check the Table Of Contents.
Segment Analysis
Amino acids captured 30.62 % of 2025 revenue, confirming their widespread acceptance in fertigation and foliar programs addressing abiotic stress in high-value horticulture. Comparative returns of USD 40 - 80 per acre offset input costs of USD 15 - 25, encouraging continuous application in tomato, pepper, and cucumber systems. Compatibility with drip irrigation chemistries and proven shelf stability underpin loyalty among protected-crop producers. Horticultural integrators also favor amino acids when seeking to meet National Organic Program rules because most enzymatic hydrolysis routes qualify under organic processing standards. Water-soluble humic acids remain the breakout subcategory, projected to register a 12.45 % CAGR through 2031. Soil-conditioning mechanisms that chelate micronutrients and improve cation-exchange capacity resonate with corn and soybean growers focused on root-zone health.
Manufacturers highlight cross-compatibility with conventional urea ammonium nitrate solutions to expand usage in mainstream row crops. Improved prill coating technologies deliver uniform particle size, avoiding equipment blockages that once hindered use. Protein hydrolysates continue to build share in certified organic chains, where animal-derived amino blends contribute nitrogen and carbon in a single pass. Seaweed extracts, although still integral, face supply volatility that encourages synthetic analog development using precision fermentation. Fulvic acids are gaining loyalty among precision farmers deploying variable-rate sprayers because their lower molecular weight supports rapid tissue infiltration, allowing consistent response monitoring through multispectral drone imagery.
The Biostimulants Market Report is Segmented by Form (Amino Acids, Fulvic Acid, Humic Acid, and More), Crop Type (Cash Crops, Horticultural Crops, and Row Crops), and Geography (North America, South America, Europe, and More). The Market Forecasts are Provided in Terms of Value (USD) and Volume (Metric Tons).
Geography Analysis
Europe retained 38.62 % value share in 2025 on the back of a mature regulatory infrastructure and comprehensive subsidies within the Common Agricultural Policy eco-scheme. Producers in the Netherlands use fertigation-compatible humic acids to cut nitrate leaching fines while safeguarding yield ceilings. Danish arable farms leverage the 25 % organic land goal to secure bank loans at preferential rates, provided that biostimulants feature in nutrient plans, thereby tying financial incentives to biological adoption. Eastern European producers in Poland and Romania benefit from knowledge transfer and funding via Rural Development Program pillars, positioning the bloc for continued leadership.
North America registers the highest growth curve at 12.35 % CAGR by 2031. The United States Department of Agriculture partnership grants draw corporate aggregators such as Archer Daniels Midland to sponsor multistate pilot projects, encouraging acreage alignment. Universities, including Iowa State and Kansas State, deliver open-access field trial datasets that de-risk farm-level experiments, accelerating diffusion in the Corn Belt. Canada's Sustainable Agriculture Strategy mirrors these incentives, enabling wheat and canola growers to qualify for greenhouse-gas offset protocols when switching from synthetic growth regulators to biological enhancers.
Asia-Pacific demonstrates layered potential. China's domestic biological-agriculture directive lists biostimulants as strategic inputs, but fragmented provincial oversight slows homogeneous deployment. India's organic transfer schemes boost demand in high-value basmati rice and mango exports, yet supply of high-purity raw materials remains uneven. South America gains traction largely in Brazil, where soybean producers adopt humic acids to manage aluminum toxicity in acid soils. Argentina's no-till systems integrate microbial seed coatings as part of wider regenerative packages. Middle East and Africa stay nascent, though irrigation-constrained horticulture in Israel and Morocco begins to explore fulvic acid root-drench protocols to mitigate salinity.
- Valagro (Syngenta Group)
- Trade Corporation International ( Rovensa Group )
- Atlantica Agricola S.A.
- Agriculture Solutions Inc.
- Biolchim SpA ( J. M. Huber Corporation )
- Coramandel International Limited
- UPL Ltd.
- BASF SE
- Bayer AG
- FMC Corporation
- Koppert Group
- Gowan Company
- Haifa Group ( Trance Resource Minerals Pte. )
- BioAtlantis Ltd.
Additional Benefits:
- The market estimate (ME) sheet in Excel format
- 3 months of analyst support
TABLE OF CONTENTS
1 INTRODUCTION
- 1.1 Study Assumptions and Market Definition
- 1.2 Scope of the Study
- 1.3 Research Methodology
2 REPORT OFFERS
3 EXECUTIVE SUMMARY AND KEY FINDINGS
4 KEY INDUSTRY TRENDS
- 4.1 Area Under Organic Cultivation
- 4.2 Per Capita Spending on Organic Products
- 4.3 Regulatory Framework
- 4.3.1 Argentina
- 4.3.2 Australia
- 4.3.3 Brazil
- 4.3.4 Canada
- 4.3.5 China
- 4.3.6 Egypt
- 4.3.7 France
- 4.3.8 Germany
- 4.3.9 India
- 4.3.10 Indonesia
- 4.3.11 Italy
- 4.3.12 Japan
- 4.3.13 Mexico
- 4.3.14 Netherlands
- 4.3.15 Nigeria
- 4.3.16 Philippines
- 4.3.17 Russia
- 4.3.18 South Africa
- 4.3.19 Spain
- 4.3.20 Thailand
- 4.3.21 Turkey
- 4.3.22 United Kingdom
- 4.3.23 United States
- 4.3.24 Vietnam
- 4.4 Value Chain and Distribution Channel Analysis
- 4.5 Market Drivers
- 4.5.1 Growing demand for organic food products
- 4.5.2 Government subsidies and supportive regulations
- 4.5.3 Sustainability-driven grower adoption
- 4.5.4 Yield and abiotic-stress improvement evidence
- 4.5.5 Seed-coating and micronutrient blend integration
- 4.5.6 Carbon-credit monetization potential
- 4.6 Market Restraints
- 4.6.1 Heterogeneous regulatory definitions
- 4.6.2 Low farmer awareness and efficacy skepticism
- 4.6.3 Competition from microbial inoculants and biofertilizers
- 4.6.4 Seaweed raw-material supply risk
5 MARKET SIZE AND GROWTH FORECASTS (VALUE AND VOLUME)
- 5.1 Form
- 5.1.1 Amino Acids
- 5.1.2 Fulvic Acid
- 5.1.3 Humic Acid
- 5.1.4 Protein Hydrolysates
- 5.1.5 Seaweed Extracts
- 5.1.6 Other Biostimulants
- 5.2 Crop Type
- 5.2.1 Cash Crops
- 5.2.2 Horticultural Crops
- 5.2.3 Row Crops
- 5.3 Geography
- 5.3.1 Africa
- 5.3.1.1 By Country
- 5.3.1.1.1 Egypt
- 5.3.1.1.2 Nigeria
- 5.3.1.1.3 South Africa
- 5.3.1.1.4 Rest of Africa
- 5.3.1.1 By Country
- 5.3.2 Asia-Pacific
- 5.3.2.1 By Country
- 5.3.2.1.1 Australia
- 5.3.2.1.2 China
- 5.3.2.1.3 India
- 5.3.2.1.4 Indonesia
- 5.3.2.1.5 Japan
- 5.3.2.1.6 Philippines
- 5.3.2.1.7 Thailand
- 5.3.2.1.8 Vietnam
- 5.3.2.1.9 Rest of Asia-Pacific
- 5.3.2.1 By Country
- 5.3.3 Europe
- 5.3.3.1 By Country
- 5.3.3.1.1 France
- 5.3.3.1.2 Germany
- 5.3.3.1.3 Italy
- 5.3.3.1.4 Netherlands
- 5.3.3.1.5 Russia
- 5.3.3.1.6 Spain
- 5.3.3.1.7 Turkey
- 5.3.3.1.8 United Kingdom
- 5.3.3.1.9 Rest of Europe
- 5.3.3.1 By Country
- 5.3.4 Middle East
- 5.3.4.1 By Country
- 5.3.4.1.1 Iran
- 5.3.4.1.2 Saudi Arabia
- 5.3.4.1.3 Rest of Middle East
- 5.3.4.1 By Country
- 5.3.5 North America
- 5.3.5.1 By Country
- 5.3.5.1.1 Canada
- 5.3.5.1.2 Mexico
- 5.3.5.1.3 United States
- 5.3.5.1.4 Rest of North America
- 5.3.5.1 By Country
- 5.3.6 South America
- 5.3.6.1 By Country
- 5.3.6.1.1 Argentina
- 5.3.6.1.2 Brazil
- 5.3.6.1.3 Rest of South America
- 5.3.6.1 By Country
- 5.3.1 Africa
6 COMPETITIVE LANDSCAPE
- 6.1 Key Strategic Moves
- 6.2 Market Share Analysis
- 6.3 Company Landscape
- 6.4 Company Profiles (Includes Global Level Overview, Market Level Overview, Core Segments, Financials as available, Strategic Information, Market Rank/Share, Products and Services, and Recent Developments)
- 6.4.1 Valagro (Syngenta Group)
- 6.4.2 Trade Corporation International ( Rovensa Group )
- 6.4.3 Atlantica Agricola S.A.
- 6.4.4 Agriculture Solutions Inc.
- 6.4.5 Biolchim SpA ( J. M. Huber Corporation )
- 6.4.6 Coramandel International Limited
- 6.4.7 UPL Ltd.
- 6.4.8 BASF SE
- 6.4.9 Bayer AG
- 6.4.10 FMC Corporation
- 6.4.11 Koppert Group
- 6.4.12 Gowan Company
- 6.4.13 Haifa Group ( Trance Resource Minerals Pte. )
- 6.4.14 BioAtlantis Ltd.
7 KEY STRATEGIC QUESTIONS FOR AGRICULTURAL BIOLOGICALS CEOS
 生物促效劑市場:依形態、原料、應用方法和作物類型分類-2026-2032年全球市場預測
 中國生物促效劑市場:市場佔有率分析、產業趨勢與統計、成長預測(2026-2031)歐洲生物促效劑:市場佔有率分析、產業趨勢與統計、成長預測(2026-2031)
 全球生物促效劑市場規模、佔有率、趨勢和成長分析報告(2026-2034年)
 2026年全球生物促效劑市場報告
 生物促效劑市場規模、佔有率和趨勢分析報告:按活性成分、作物類型、應用、地區和細分市場預測(2026-2033 年)24- 表油菜素內酯市場按形態、作物類型、應用、最終用途和分銷管道分類 - 全球預測(2026-2032 年)PGPR生物促效劑市場按類型、作物類型、配方、應用和最終用戶分類-2026-2032年全球預測微生物植物生長促進劑市場(依微生物類型、作物類型、配方、功能、應用方法和通路)——2026-2032年全球預測海藻衍生生物促效劑市場按作物類型、產品類型、海藻類型、應用方法、通路和最終用途分類,全球預測(2026-2032年)