


 |
市場調查報告書
商品編碼
1906884
生物農藥:市場佔有率分析、產業趨勢與統計、成長預測(2026-2031)Biopesticides - Market Share Analysis, Industry Trends & Statistics, Growth Forecasts (2026 - 2031) |
||||||
※ 本網頁內容可能與最新版本有所差異。詳細情況請與我們聯繫。
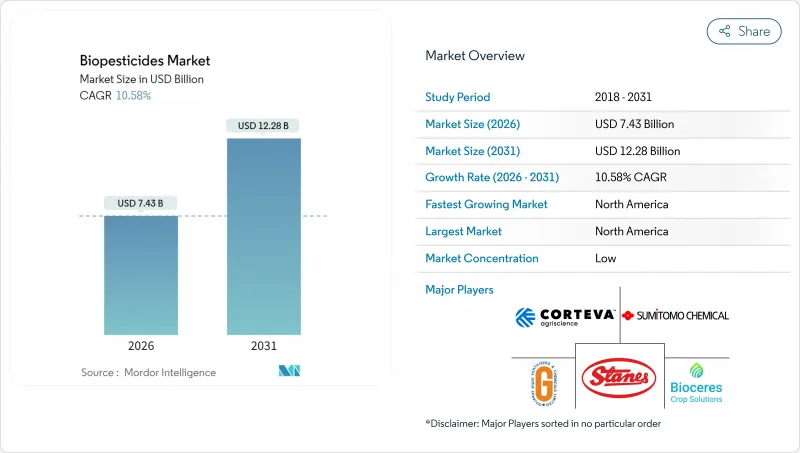
預計到 2026 年,生物農藥市值將達到 74.3 億美元,高於 2025 年的 67.2 億美元,預計到 2031 年將達到 122.8 億美元。
預計2026年至2031年年複合成長率(CAGR)為10.58%。
合成化學品監管力度的加大、有機農地的快速擴張以及發酵服務平台的興起,正在加速微生物解決方案的商業化進程。巴西的《生物投入品協調法》將於2024年12月生效,該法將縮短生物產品的核准時間,其他新興市場也開始效法。同時,北美種植者憑藉其成熟的受控環境農業基礎設施以及在改革後的美國協調框架(USCF)下簡化的核准流程,引領全球微生物解決方案的普及。殺蟲劑抗藥性的日益增強,尤其是在鱗翅目害蟲中,正促使田間作物種植者和園藝種植者轉向生物防治方法,以補充現有的化學農藥。
全球生物農藥市場趨勢與洞察
加強全球對合成農藥的監管
歐盟的「從農場到餐桌」策略旨在2030年將化學農藥的使用量減少50%,這將顯著促進生物農藥的替代。同時,美國環保署(EPA)於2024年取消了多種有機磷農藥的註冊,提高了87%受訪農戶對生物農藥的興趣。巴西簡化的生物農藥核准流程顯著縮短了核准時間,遠低於合成農藥,使生物農藥生產商在避免延誤方面具有成本效益優勢。泰國和其他東南亞國家也在製定類似政策,這標誌著全球監管正在向更嚴格的方向轉變。主要出口作物的殘留限量合規性帶來了切實的商業風險,買家正在敦促供應商減少對合成化學品的依賴。
擴大有機面積
受主要產區年成長率趨於穩定的推動,經認證的有機農地面積正在穩步成長。由於有機認證禁止使用合成投入品,生物農藥已成為這些系統中主要的病蟲害防治工具,為生物農藥供應商創造了穩定的收入基礎。有機產品的高零售價格使生產者能夠在保持盈利的同時,有效控制每公頃的處理成本。有機供應鏈中可控環境農業(CEA)的擴張進一步推動了需求,因為室內農場從一開始就採用生物防治,以滿足零殘留品牌的要求。此外,對區域有機研究中心的投資也更支持了生物產品的推廣,增強了人們對生物產品的信心。
與合成農藥的成本比較
生物農藥的每公頃處理成本仍然是傳統產品的兩到三倍,這主要是由於其活性成分濃度較低且施用週期更頻繁。非洲和亞洲部分地區的商品作物種植者往往不願意投資昂貴的投入品,即使高價出口管道可以涵蓋這些成本。將降低抗性管理和殘留檢測成本納入考慮的經濟模型可以部分抵消價格差異,但此類分析尚未透過推廣網路廣泛傳播。一些政府目前提供直接投入補貼以彌補價格差距,但補貼覆蓋範圍仍有限。
細分市場分析
生物殺菌劑仍將是生物農藥市場的核心組成部分,預計到2025年將佔總收入的46.92%。這反映了芽孢桿菌和木黴菌株在穀物、果樹和保護地蔬菜中經過實踐驗證的優異性能。可濕性粉劑和油性分散劑的配方創新提高了產品的貨架穩定性,從而促進了其在溫暖氣候地區的廣泛應用。該領域的廣泛效用增強了經銷商的信心,並促使其在零售通路中佔據更大的貨架空間。儘管生物殺蟲劑目前的市場佔有率落後,但預計將以11.86%的複合年成長率成長,超過其他類別。隨著種植者尋求新的防治鱗翅目害蟲抗藥性的方法,生物殺蟲劑的應用正在不斷增加。近期監管文件顯示,2024年生物農藥的應用量將增加35%,這意味著在預測期內將有更多選擇。
第二代生物除草劑目前仍屬於小眾市場,但隨著企業將新型創業投資分離株與助劑結合以增強宿主特異性,其商業性發展動能日益強勁。儘管受面積限制,產量仍然小規模,但它們為抗除草劑雜草提供了差異化的解決方案,吸引了風險投資的關注。其他生物農藥(如殺線蟲劑和殺軟體動物劑)則針對高價值的特種作物,在這些作物上,持續的產量足以抵消較高的投入成本。總而言之,這些多樣化的生物農藥形式代表著生物農藥市場技術範圍的持續擴展。
《生物農藥市場報告》依形態(生物殺菌劑、生物除草劑、生物殺蟲劑等)、作物類型(經濟作物、園藝作物等)及地區(非洲、亞太地區、歐洲、中東、北美等)細分。市場預測以價值(美元)和數量(公噸)為單位。
區域分析
複合年成長率(CAGR)指的是年均複合成長率,北美地區為12.05%。至2025年,北美地區將維持39.12%的收入佔有率,成為各地區中複合年成長率最高的地區。這鞏固了北美地區作為生物農藥市場規模最大且成長最快的地區的雙重地位。美國環保署(EPA)審查流程的簡化、各州層級的激勵計畫以及零售商對零殘留採購的堅定承諾,都在加速生物農藥的普及應用。美國受控環境農業(CEA)業務正在將生物農藥應用於綠葉蔬菜、番茄和草莓等作物,從而提供了穩定的需求基礎。加拿大有機農地的擴張以及墨西哥以出口為導向的園藝產業的發展,也進一步推動了北美地區生物農藥的普及應用。
在歐盟「從農場到餐桌」戰略的推動下,歐洲也跟進。歐洲生物防治市場成長顯著,如今已佔據作物保護產品銷售總額的相當大一部分。嚴格的核准流程耗時數年,雖然延緩了產品更新,但卻確保了高品質的資料包,並增強了種植者的信心。北部成員國高度重視減少穀物中的農藥殘留,而地中海地區則在園藝和葡萄栽培中廣泛應用生物防治劑。
南美洲正經歷最強勁的成長,這主要得益於巴西市場的擴張以及生物材料核准的協調統一等有利的監管改革。許多巴西生產商目前已將生物製品作為常規用途,推動市場年增率遠高於全球平均水準。阿根廷的等效性核准和智利的公共研究經費進一步推動了該地區的成長動能。亞太地區展現出巨大的潛力,這得益於有機農地的擴張和政府永續性政策的推動,但由於監管時間表不一和技術應用有限,進展較為分散。中東和非洲是尚處於起步階段的市場,捐助者資助的計畫和多國示範計畫正為未來的需求播下種子。
其他福利:
- Excel格式的市場預測(ME)表
- 3個月的分析師支持
目錄
第1章 引言
- 研究假設和市場定義
- 調查範圍
- 調查方法
第2章 報告
第3章執行摘要和主要發現
第4章:主要產業趨勢
- 有機耕作面積
- 人均有機產品支出
- 法律規範
- 阿根廷
- 澳洲
- 巴西
- 加拿大
- 中國
- 埃及
- 法國
- 德國
- 印度
- 印尼
- 伊朗
- 義大利
- 日本
- 墨西哥
- 荷蘭
- 奈及利亞
- 菲律賓
- 俄羅斯
- 南非
- 西班牙
- 泰國
- 土耳其
- 英國
- 美國
- 越南
- 價值鍊和通路分析
- 市場促進因素
- 加強全球對合成農藥的監管
- 擴大有機農業面積
- 對傳統化學農藥的抗藥性日益增強
- 政府對生物農藥的誘因與快速核准制度
- 可控制環境農業(CEA)的發展
- 降低發酵即服務規模化生產的門檻
- 市場限制
- 與合成農藥相比,高成本
- 保存期限短,高度依賴低溫運輸
- 微生物生產中原物料價格的波動
- 缺乏統一的現場績效KPI
第5章 市場規模和成長預測(價值和數量)
- 按形式
- 生物殺菌劑
- 生物除草劑
- 生物農藥
- 其他生物農藥
- 按作物類型
- 經濟作物
- 園藝作物
- 田間作物
- 按地區
- 非洲
- 按國家/地區
- 埃及
- 奈及利亞
- 南非
- 其他非洲地區
- 按國家/地區
- 亞太地區
- 按國家/地區
- 澳洲
- 中國
- 印度
- 印尼
- 日本
- 菲律賓
- 泰國
- 越南
- 亞太其他地區
- 按國家/地區
- 歐洲
- 按國家/地區
- 法國
- 德國
- 義大利
- 荷蘭
- 俄羅斯
- 西班牙
- 土耳其
- 英國
- 其他歐洲地區
- 按國家/地區
- 中東
- 按國家/地區
- 伊朗
- 沙烏地阿拉伯
- 其他中東地區
- 按國家/地區
- 北美洲
- 按國家/地區
- 加拿大
- 墨西哥
- 美國
- 北美其他地區
- 按國家/地區
- 南美洲
- 按國家/地區
- 阿根廷
- 巴西
- 南美洲其他地區
- 按國家/地區
- 非洲
第6章 競爭情勢
- 關鍵策略舉措
- 市佔率分析
- 公司簡介
- 公司簡介
- Bayer AG
- BASF SE
- Syngenta Group
- Corteva Agriscience
- FMC Corporation
- Valent BioSciences LLC(Sumitomo Chemical Co., Ltd.)
- Certis USA LLC(Mitsui and Co., Ltd.)
- Koppert BV
- Andermatt Group AG
- Marrone Bio Innovations Inc.(Bioceres Crop Solutions Corp.)
- Seipasa SA
- T.Stanes and Company Limited
- UPL Ltd.
- Atlantica Agricola
- Gujarat State Fertilizers and Chemicals Ltd.
第7章:CEO們需要思考的關鍵策略問題
The biopesticides market size in 2026 is estimated at USD 7.43 billion, growing from 2025 value of USD 6.72 billion with 2031 projections showing USD 12.28 billion, growing at 10.58% CAGR over 2026-2031.
Heightened regulatory scrutiny of synthetic chemistries, rapid expansion of organic farmland, and the emergence of fermentation-as-a-service platforms are converging to accelerate the commercialization of microbial-based solutions. Brazil's unified bioinputs law, effective December 2024, has already shortened approval timelines for biological products, providing momentum that other emerging markets are beginning to emulate. At the same time, North American growers lead global adoption because of a mature controlled-environment agriculture infrastructure and streamlined reviews under the reformed United States Coordinated Framework. Intensifying insecticide resistance, especially in lepidopteran pests, is steering both row-crop and horticultural producers toward biological modes of action that complement existing chemistries.
Global Biopesticides Market Trends and Insights
Stricter Global Curbs on Synthetic Pesticides
The European Union's Farm to Fork Strategy targets a 50% cut in chemical pesticide use by 2030, prompting a measurable substitution effect in favor of biologicals. Complementing this, the United States Environmental Protection Agency (EPA) cancelled several organophosphate registrations in 2024, which has increased biological awareness among 87% of surveyed row-crop growers. Brazil's streamlined approval process now takes significantly less time for biologicals compared to synthetics, creating a cost-of-delay advantage for biopesticide manufacturers. Thailand and other Southeast Asian nations are drafting comparable policies, illustrating the global reach of regulatory momentum. Across major export crops, residue-limit compliance has become a tangible business risk, so buyers are pressuring suppliers to reduce dependence on synthetic chemistries.
Expansion of Organic Farming Acreage
Certified organic farmland has been steadily increasing, supported by consistent annual growth across major producing regions. Since organic certification prohibits synthetic inputs, biologicals serve as the primary pest-management option in these systems, creating a reliable revenue base for biopesticide vendors. The premium retail pricing associated with organic products allows growers to manage higher per-hectare treatment costs while maintaining profitability. The expansion of controlled-environment agriculture (CEA) within organic supply chains further drives demand, as indoor farms adopt biological controls from the outset to meet residue-free branding requirements. Additionally, investment in regional organic research centers is enhancing extension support for biological products, boosting adoption confidence.
Higher Cost Versus Synthetic Pesticides
Per-hectare treatment costs for biologicals remain two to three times higher than conventional products, primarily because of lower active-ingredient density and more frequent application cycles. Commodity crop growers in Africa and parts of Asia hesitate to invest in premium inputs, even though premium export channels may cover those costs. Economic modeling that factors in resistance management and residue-testing savings can partially offset price gaps, but such analyses are not yet widely distributed through extension networks. Several governments now offer direct input subsidies to bridge the pricing differential, but program scope is still limited.
Other drivers and restraints analyzed in the detailed report include:
- Rising Resistance to Conventional Chemistries
- Government Biopesticide Incentives and Fast-Track Approvals
- Shorter Shelf Life and Cold-Chain Dependence
For complete list of drivers and restraints, kindly check the Table Of Contents.
Segment Analysis
Biofungicides generated 46.92% of 2025 revenue and continue to anchor the biopesticides market size, reflecting proven field performance of Bacillus and Trichoderma strains across cereals, fruits, and protected vegetables. Innovation in wettable-powder and oil-dispersion formulations has improved shelf stability, which supports penetration in warmer climates. The segment's broad utility has built distributor confidence, encouraging wider shelf allocation in retail channels. Bioinsecticides trail in current share but are forecast to advance at a 11.86% CAGR, outpacing other categories. Adoption is rising as growers seek new modes of action to counter lepidopteran resistance. Recent regulatory submissions show a 35% rise in bioinsecticide dossiers in 2024, supplying a pipeline that will expand choices over the forecast window.
Second-generation bioherbicides remain niche but show commercial momentum as companies pair novel microbial isolates with adjuvants that improve host specificity. While limited acreage uptake keeps volume small, the category attracts venture capital because it offers a differentiated solution to herbicide-resistant weeds. Other biopesticides, including nematicides and molluscicides, target high-value specialty crops where yield preservation justifies higher inputs. Together, these diverse forms demonstrate the expanding technical scope of the biopesticides market.
The Biopesticides Market Report is Segmented by Form (Biofungicides, Bioherbicides, Bioinsecticides, and More), Crop Type (Cash Crops, Horticultural Crops, and More), and Geography (Africa, Asia-Pacific, Europe, Middle East, North America, and More). The Market Forecasts are Provided in Terms of Value (USD) and Volume (Metric Tons).
Geography Analysis
North America retained 39.12% revenue in 2025 and posted the fastest regional CAGR at 12.05%, underscoring its dual status as both the largest and fastest-growing territory for the biopesticides market. Streamlined EPA reviews, state-level incentive programs, and strong retailer commitments to residue-free sourcing combine to accelerate uptake. United States CEA operations integrate biological pest control in leafy greens, tomatoes, and strawberries, providing a steady baseline of demand. Canada's organic acreage expansion and Mexico's export-oriented horticulture further expand regional use.
Europe follows closely, propelled by the European Union's Farm to Fork Strategy. The European biocontrol market has grown significantly, representing a notable portion of total crop-protection sales. Stringent approval processes extend over several years, slowing product turnover but ensuring high-quality data packages that bolster grower trust. Northern member states emphasize residue reduction in cereals, while Mediterranean regions employ biologicals heavily in horticulture and viticulture.
South America delivers the most dynamic growth, led by Brazil's expanding market and favorable regulatory reforms that unify bioinput approvals. A significant portion of Brazilian growers now report routine biological use, and annual market expansion vastly outstrips the global average. Argentina's equivalency recognition and Chile's public research funding enhance regional momentum. Asia-Pacific registers strong potential tied to rising organic acreage and government sustainability mandates, yet progress is fragmented by variable regulatory timelines and limited technical extension. Africa and the Middle East represent early-stage markets where donor-funded programs and multinational demonstrations seed future demand.
- Bayer AG
- BASF SE
- Syngenta Group
- Corteva Agriscience
- FMC Corporation
- Valent BioSciences LLC (Sumitomo Chemical Co., Ltd.)
- Certis USA LLC (Mitsui and Co., Ltd.)
- Koppert B.V.
- Andermatt Group AG
- Marrone Bio Innovations Inc. (Bioceres Crop Solutions Corp.)
- Seipasa SA
- T.Stanes and Company Limited
- UPL Ltd.
- Atlantica Agricola
- Gujarat State Fertilizers and Chemicals Ltd.
Additional Benefits:
- The market estimate (ME) sheet in Excel format
- 3 months of analyst support
TABLE OF CONTENTS
1 INTRODUCTION
- 1.1 Study Assumptions & Market Definition
- 1.2 Scope of the Study
- 1.3 Research Methodology
2 REPORT OFFERS
3 EXECUTIVE SUMMARY AND KEY FINDINGS
4 KEY INDUSTRY TRENDS
- 4.1 Area Under Organic Cultivation
- 4.2 Per Capita Spending On Organic Products
- 4.3 Regulatory Framework
- 4.3.1 Argentina
- 4.3.2 Australia
- 4.3.3 Brazil
- 4.3.4 Canada
- 4.3.5 China
- 4.3.6 Egypt
- 4.3.7 France
- 4.3.8 Germany
- 4.3.9 India
- 4.3.10 Indonesia
- 4.3.11 Iran
- 4.3.12 Italy
- 4.3.13 Japan
- 4.3.14 Mexico
- 4.3.15 Netherlands
- 4.3.16 Nigeria
- 4.3.17 Philippines
- 4.3.18 Russia
- 4.3.19 South Africa
- 4.3.20 Spain
- 4.3.21 Thailand
- 4.3.22 Turkey
- 4.3.23 United Kingdom
- 4.3.24 United States
- 4.3.25 Vietnam
- 4.4 Value Chain and Distribution Channel Analysis
- 4.5 Market Drivers
- 4.5.1 Stricter global curbs on synthetic pesticides
- 4.5.2 Expansion of organic farming acreage
- 4.5.3 Rising resistance to conventional chemistries
- 4.5.4 Government bio-pesticide incentives and fast-track approvals
- 4.5.5 Growth of controlled-environment agriculture (CEA)
- 4.5.6 Fermentation-as-a-service lowering scale-up barriers
- 4.6 Market Restraints
- 4.6.1 Higher cost versus synthetic pesticides
- 4.6.2 Shorter shelf life and cold-chain dependence
- 4.6.3 Feed-stock price volatility for microbial production
- 4.6.4 Absence of uniform field-performance KPIs
5 MARKET SIZE AND GROWTH FORECASTS (VALUE AND VOLUME)
- 5.1 Form
- 5.1.1 Biofungicides
- 5.1.2 Bioherbicides
- 5.1.3 Bioinsecticides
- 5.1.4 Other Biopesticides
- 5.2 Crop Type
- 5.2.1 Cash Crops
- 5.2.2 Horticultural Crops
- 5.2.3 Row Crops
- 5.3 Geography
- 5.3.1 Africa
- 5.3.1.1 By Country
- 5.3.1.1.1 Egypt
- 5.3.1.1.2 Nigeria
- 5.3.1.1.3 South Africa
- 5.3.1.1.4 Rest of Africa
- 5.3.1.1 By Country
- 5.3.2 Asia-Pacific
- 5.3.2.1 By Country
- 5.3.2.1.1 Australia
- 5.3.2.1.2 China
- 5.3.2.1.3 India
- 5.3.2.1.4 Indonesia
- 5.3.2.1.5 Japan
- 5.3.2.1.6 Philippines
- 5.3.2.1.7 Thailand
- 5.3.2.1.8 Vietnam
- 5.3.2.1.9 Rest of Asia-Pacific
- 5.3.2.1 By Country
- 5.3.3 Europe
- 5.3.3.1 By Country
- 5.3.3.1.1 France
- 5.3.3.1.2 Germany
- 5.3.3.1.3 Italy
- 5.3.3.1.4 Netherlands
- 5.3.3.1.5 Russia
- 5.3.3.1.6 Spain
- 5.3.3.1.7 Turkey
- 5.3.3.1.8 United Kingdom
- 5.3.3.1.9 Rest of Europe
- 5.3.3.1 By Country
- 5.3.4 Middle East
- 5.3.4.1 By Country
- 5.3.4.1.1 Iran
- 5.3.4.1.2 Saudi Arabia
- 5.3.4.1.3 Rest of Middle East
- 5.3.4.1 By Country
- 5.3.5 North America
- 5.3.5.1 By Country
- 5.3.5.1.1 Canada
- 5.3.5.1.2 Mexico
- 5.3.5.1.3 United States
- 5.3.5.1.4 Rest of North America
- 5.3.5.1 By Country
- 5.3.6 South America
- 5.3.6.1 By Country
- 5.3.6.1.1 Argentina
- 5.3.6.1.2 Brazil
- 5.3.6.1.3 Rest of South America
- 5.3.6.1 By Country
- 5.3.1 Africa
6 COMPETITIVE LANDSCAPE
- 6.1 Key Strategic Moves
- 6.2 Market Share Analysis
- 6.3 Company Landscape
- 6.4 Company Profiles (Includes Global-Level Overview, Market-Level Overview, Core Segments, Financials, Strategic Information, Market Rank/Share, Products and Services, and Recent Developments)
- 6.4.1 Bayer AG
- 6.4.2 BASF SE
- 6.4.3 Syngenta Group
- 6.4.4 Corteva Agriscience
- 6.4.5 FMC Corporation
- 6.4.6 Valent BioSciences LLC (Sumitomo Chemical Co., Ltd.)
- 6.4.7 Certis USA LLC (Mitsui and Co., Ltd.)
- 6.4.8 Koppert B.V.
- 6.4.9 Andermatt Group AG
- 6.4.10 Marrone Bio Innovations Inc. (Bioceres Crop Solutions Corp.)
- 6.4.11 Seipasa SA
- 6.4.12 T.Stanes and Company Limited
- 6.4.13 UPL Ltd.
- 6.4.14 Atlantica Agricola
- 6.4.15 Gujarat State Fertilizers and Chemicals Ltd.
7 KEY STRATEGIC QUESTIONS FOR AGRICULTURAL BIOLOGICALS CEOS
 液體生物農藥市場規模、佔有率和成長分析:按產品類型、原料、應用方法、作物、配方類型、最終用戶、配銷通路和地區分類——2026-2033年行業預測
 生物殺蟲劑市場報告:按產品、配方、原料、應用方法、作物類型和地區分類(2026-2034 年)
 生物農藥市場:按類型、作物、配方、應用和銷售管道分類-2026-2032年全球市場預測
 全球生物農藥市場規模、佔有率、趨勢和成長分析報告(2026-2034年)
 2026年全球生物農藥市場報告
 生物製藥市場-全球產業規模、佔有率、趨勢、機會、預測:按類型、作物類型、應用、製劑、地區和競爭格局分類,2021-2031年
 生物農藥市場規模、佔有率和趨勢分析報告:按產品、作物類型、來源、應用、地區和細分市場分類 - 預測,2026-2033年芽孢桿菌作物保護市場按作物類型、配方類型、應用方法、最終用戶和銷售管道分類-2026-2032年全球預測農業生物農藥市場按類型、作用方式、應用、作物類型和劑型分類-2026-2032年全球預測日本生物農藥市場報告(按產品類型(生物除草劑、生物殺蟲劑、生物殺菌劑及其他)、應用(作物用、非作物用)和地區分類,2026-2034)