


 |
市場調查報告書
商品編碼
1906858
石英:市場佔有率分析、產業趨勢與統計、成長預測(2026-2031)Quartz - Market Share Analysis, Industry Trends & Statistics, Growth Forecasts (2026 - 2031) |
||||||
※ 本網頁內容可能與最新版本有所差異。詳細情況請與我們聯繫。
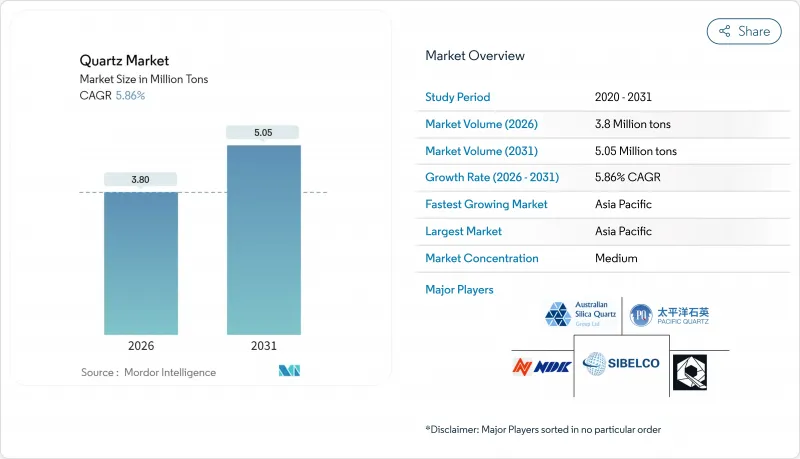
預計到 2026 年,石英市場規模將達到 380 萬噸,高於 2025 年的 359 萬噸。
預計到 2031 年將達到 505 萬噸,2026 年至 2031 年的複合年成長率為 5.86%。
這種穩定成長反映了石英在半導體光刻、太陽能晶錠生長、光纖和工程表面處理等領域中不可替代的作用。隨著製程節點縮小到7奈米以下,晶片製造廠正在將雜質容差提高到十億分之一的水平,迫使供應商投資先進的精煉設備。同時,太陽能晶錠製造設備正在擴大坩堝直徑以適應更大的晶圓,使石英的基準用量加倍。氣候相關的供應衝擊——最近的例子是颶風海倫導致斯普魯斯派恩工廠停產——正在推動石英生產多元化,轉向挪威、巴西和非洲,同時維持超高純度石英的溢價。最後,一系列產業整合和產能擴張表明,人們相信石英市場將在本世紀末繼續保持其在高科技製造生態系統中的基礎地位。
全球石英市場趨勢及展望
太陽能發電能力快速成長
全球太陽能發電裝置容量的擴張需要超高純度石英坩堝,以承受採用柴可拉斯基法法生長矽錠時高達 1723°C 的高溫。 M12 等更大尺寸的晶圓推動了單線產量的提升,迫使坩堝製造商提高坩堝直徑和壁厚均勻性。擁有純度達 99.999% 或更高 SiO2 的供應商正與尋求降低材料供應風險的大型晶圓製造商簽訂長期承購協議。亞太地區的需求是主導,但歐洲和美國的能源轉型獎勵也創造了額外的需求,並促進了加工基地的地域多角化。因此,即使在電子市場週期性波動的情況下,太陽能應用預計仍將是石英市場的穩定支柱。
半導體小型化推動了對超高純度半導體的需求
7奈米及以下製程的尖端邏輯和記憶體晶圓廠對雜質含量要求極高,達到十億分之一級別,這提高了熔融石英和石英產品供應商的技術門檻。獨家流程,包括合成、熔融石英和多級酸浸,可實現鋁含量低於9ppm、鐵含量低於0.2ppm。相關的資本密集度和認證週期有效地阻止了新進入者,使得現有企業能夠協商與純度而非噸位掛鉤的多年定價結構。隨著晶片製造商向3奈米製程過渡並推進2奈米試生產,預計到2030年,對超高純度石英的需求成長速度將超過整個石英市場的成長速度。
石英開採對生態環境的影響
棲息地破壞、地下水位變化和顆粒排放正促使北卡羅來納州、魁北克省和斯堪的納維亞半島部分地區實施更嚴格的許可製度。修復礦藏、生物多樣性基準評估和社區諮詢等環節,使得前置作業時間延長了長達24個月。缺乏可靠ESG(環境、社會和治理)藍圖的生產商將面臨更高的資本支出,而利用回收商和尾礦的措施也正獲得監管機構的認可。這種環境審查對石英市場施加了可衡量的限制,同時也推動了更環保的採購模式的創新。
細分市場分析
到2025年,矽金屬將佔據石英市場96.55%的佔有率,繼續保持其在產量上的主導地位,鞏固其與鋁合金、矽酮和多晶矽並駕齊驅的關鍵地位。受輕量化交通工具發展趨勢以及美國兩國太陽能電池用多晶矽產能擴張的推動,矽金屬加工所得石英的市場規模預計將穩定成長。 Ferroglobe、Elkem和Hosin等公司憑藉其大型埋弧爐和自有石英礦,保持著成本優勢,但電力供應的穩定性仍然是新參與企業面臨的關鍵挑戰。
儘管高純度石英的產量微乎其微,但其價值卻不成比例地高,平均售價超過每噸7000美元。預計到2031年,其年複合成長率(CAGR)將達到7.18%,反映了微縮技術進步和太陽能電池晶圓尺寸增大帶來的長期利多因素。進入門檻,例如ISO 9001:2000認證和需要12至18個月的客戶審核,確保了合約一旦簽訂就能長期有效。受颶風海倫對雲杉木材運輸的影響,半導體製造商開始從挪威和亞洲雙重採購,凸顯了經過認證的高純度石英(HPQ)供應商的戰略優勢。這一趨勢使高純度石英成為石英市場中成長最快的細分市場,即使矽金屬仍保持其銷售主導。
本石英市場報告按產品類型(高純度石英、石英晶體、金屬矽)、終端用戶產業(電子及半導體、太陽能、建築、光纖及通訊、汽車、其他終端用戶產業)及地區(亞太、北美、歐洲、南美、中東和非洲)進行細分。市場預測以噸為單位。
區域分析
到2025年,亞太地區將佔據全球石英市場55.01%的佔有率,這主要得益於中國垂直整合的叢集,這些集群能夠在數百公里範圍內將石英礦石加工成電子元件、太陽能電池板和工程表面材料。區域監管機構持續最佳化從礦場到製造工廠的物流,進一步縮短了營運資金週轉週期。在優惠的電價和鼓勵半導體後端加工在地化的政策支持下,印度和越南正在崛起為二次加工中心。到2031年,該地區的複合年成長率將達到6.27%,這主要受東南亞國協智慧型手機普及率的持續成長、屋頂太陽能政策的推動以及中產階級住宅維修需求的成長。
北美具有重要的戰略地位,其核心在於豐富的超高純度雲杉松礦藏。在2024年颶風災害發生之前,該地區供應了全球80%至90%的高矽原料。 Sibelco計劃投資7億美元進行擴建,Quartz在挪威新建工廠,體現了雙管齊下的風險緩解策略,該策略結合了地質優勢和地理冗餘。美國亞利桑那州、德克薩斯州和紐約州的晶圓廠運作正在推動下游需求,但不斷上漲的能源成本和嚴格的環境許可限制了商品級石英晶體生產的擴張。加拿大和墨西哥正利用其地理優勢為區域建築市場提供石英晶體,同時也試圖透過可再生能源走廊吸引利基高純度石英晶體(HPQ)投資。
歐洲正利用嚴格的ESG(環境、社會和治理)標準,在加值石英加工領域開拓高階市場。伊梅里斯公司在瑞典和法國經營礦床,並將低碳水力發電與鄰近的石英熔融廠結合。德國提供用於無漿切割和熱區組裝的精密機械,儘管礦石蘊藏量有限,但仍保持技術領先地位。南美洲和中東/非洲地區也在為石英生產做出貢獻,特別是巴西米納斯吉拉斯礦帶的供應量不斷增加,但基礎設施不足和水資源短缺限制了近期的成長。這些地區嚴重依賴進口,亞太和北美地區的供應商對全球石英市場的影響力日益增強。
其他福利:
- Excel格式的市場預測(ME)表
- 3個月的分析師支持
目錄
第1章 引言
- 研究假設和市場定義
- 調查範圍
第2章調查方法
第3章執行摘要
第4章 市場情勢
- 市場概覽
- 市場促進因素
- 太陽能發電能力快速成長
- 半導體節點小型化推動了對超高純度材料的需求。
- 人造石英內表面的需求激增
- 5G/FTTx中的光纖部署
- 尾礦衍生的高純度石英(HPQ)降低了成本曲線
- 市場限制
- 石英開採對生態環境的影響
- 高耗能的精煉過程
- 氣候變遷導致採礦作業中斷
- 價值鏈分析
- 波特五力模型
- 供應商的議價能力
- 買方的議價能力
- 新進入者的威脅
- 替代品的威脅
- 競爭對手之間的競爭
第5章 市場規模與成長預測
- 依產品類型
- 高純度石英
- 石英石檯面和瓷磚
- 熔融石英坩堝
- 石英玻璃
- 水晶
- 矽金屬
- 高純度石英
- 按最終用戶行業分類
- 電子和半導體
- 太陽能發電
- 建築/施工
- 光纖和電訊
- 車
- 其他終端用戶產業
- 按地區
- 亞太地區
- 中國
- 印度
- 日本
- 韓國
- 馬來西亞
- 泰國
- 印尼
- 越南
- 亞太其他地區
- 北美洲
- 美國
- 加拿大
- 墨西哥
- 歐洲
- 德國
- 英國
- 法國
- 義大利
- 西班牙
- 北歐國家
- 土耳其
- 俄羅斯
- 其他歐洲地區
- 南美洲
- 巴西
- 阿根廷
- 哥倫比亞
- 南美洲其他地區
- 中東和非洲
- 沙烏地阿拉伯
- 卡達
- 阿拉伯聯合大公國
- 奈及利亞
- 埃及
- 南非
- 其他中東和非洲地區
- 亞太地區
第6章 競爭情勢
- 市場集中度
- 策略趨勢
- 市佔率(%)/排名分析
- 公司簡介
- AGC Inc.
- Australian Silica Quartz Group Ltd
- Dow
- East Hope Group
- Elkem ASA
- Ferroglobe
- Hoshine Silicon Industry Co., Ltd.
- Imerys
- India Quartz
- Jiangsu Pacific Quartz Co., Ltd
- MACTUS
- NIHON DEMPA KOGYO CO., LTD.
- Nordic Mining ASA
- Saint-Gobain
- Sibelco
- SIMCOA
- The Quartz Corp
- WACKER CHEMIE AG
第7章 市場機會與未來展望
Quartz Market size in 2026 is estimated at 3.8 million tons, growing from 2025 value of 3.59 million tons with 2031 projections showing 5.05 million tons, growing at 5.86% CAGR over 2026-2031.
This steady expansion reflects the mineral's irreplaceable role in semiconductor lithography, photovoltaic ingot growth, optical fibers, and engineered surfaces. As node geometries shrink below 7 nm, chip fabs elevate impurity thresholds to parts-per-billion, forcing suppliers to invest in advanced purification assets. Solar ingot pullers are simultaneously scaling crucible diameters for larger wafers, multiplying baseline quartz volumes. Climate-related supply shocks-most recently Hurricane Helene's disruption of Spruce Pine-have propelled diversification efforts into Norway, Brazil, and Africa while sustaining premium pricing for ultra-high-purity grades. Finally, a wave of consolidation and capacity additions signals confidence that the quartz market will remain a cornerstone of high-tech manufacturing ecosystems through the end of the decade.
Global Quartz Market Trends and Insights
Growing Solar-PV Capacity Surge
Global photovoltaic build-outs require ultra-pure quartz crucibles capable of withstanding 1,723 °C during Czochralski silicon ingot growth. Larger wafer formats, such as M12, amplify volume per line, forcing crucible producers to scale both diameter and wall uniformity. Suppliers with track records in more than 99.999% SiO2 grades secure long-term offtake agreements from wafer majors eager to derisk material availability. Asia-Pacific dominates demand, yet European and U.S. energy-transition incentives are creating incremental pull that helps regionalize processing footprints. As a result, solar applications are forecast to be a stabilizing pillar for the quartz market amid cyclical swings in electronics.
Semiconductor Node-Shrink Drives Ultra-High-Purity Demand
Leading-edge logic and memory fabs operating below 7 nm mandate impurity ceilings in the parts-per-billion range, raising the technical bar for fused silica and quartz ware suppliers. Proprietary processes. including synthetic route, fused silica, and multi-stage acid leaching, enable aluminum contents below 9 ppm and iron below 0.2 ppm. The capital intensity and qualification cycles involved effectively deter new entrants, allowing incumbents to negotiate multi-year pricing formulas tracking purity rather than tonnage. As chipmakers move toward 3 nm production and pilot 2 nm, demand for ultra-high-purity quartz is set to outpace broader quartz market growth through 2030.
Ecological Impact of Quartz Mining
Habitat disruption, water-table alteration, and particulate emissions are prompting stricter permitting regimes across North Carolina, Quebec, and parts of Scandinavia. Restoration bonding, baseline biodiversity assessments, and community consultations now extend lead times by up to 24 months. Producers lacking credible ESG roadmaps face escalating capex, while recyclers and tailings-based initiatives gain regulatory goodwill. This environmental scrutiny places a measurable drag on the quartz market, although it simultaneously accelerates innovation in lower-impact sourcing models.
Other drivers and restraints analyzed in the detailed report include:
- Boom in Engineered-Quartz Interior Surfaces
- Tailings-Derived HPQ Lowers Cost Curve
- Energy-Intensive Purification Process
For complete list of drivers and restraints, kindly check the Table Of Contents.
Segment Analysis
Silicon metal dominated tonnage with a 96.55% quartz market share in 2025, underscoring its indispensable role in aluminum alloys, silicones, and polysilicon. The quartz market size attributed to silicon metal processing is projected to expand steadily in line with light-weighting in transportation, and solar-grade polysilicon capacity adds in China and the U.S. Ferroglobe, Elkem, and Hoshine capitalize on large submerged-arc furnaces and captive quartzite mines to defend cost positions, while electricity availability remains a swing factor for new entrants.
High-purity quartz, though tiny in volume, captures a disproportionate value pool thanks to average selling prices exceeding USD 7,000 per ton. Its forecast 7.18% CAGR through 2031 reflects secular tailwinds from node migration and larger solar wafer formats. Qualification barriers such as ISO 9001:2000 and customer audits spanning 12-18 months cement long-term contracts once secured. Hurricane Helene's interference with Spruce Pine shipments prompted chipmakers to dual-source from Norway and Asia, spotlighting the strategic leverage of certified HPQ suppliers. This dynamic positions HPQ as the fastest-rising slice of the quartz market, even as silicon metal maintains volume leadership.
The Quartz Report is Segmented by Product Type (High-Purity Quartz, Quartz Crystal, and Silicon Metal), End-User Industry (Electronics and Semiconductor, Solar, Building and Construction, Optical Fiber and Telecommunication, Automotive, and Other End-User Industries), and Geography (Asia-Pacific, North America, Europe, South America, and Middle-East and Africa). The Market Forecasts are Provided in Terms of Volume (Tons).
Geography Analysis
Asia-Pacific accounted for 55.01% of the quartz market share in 2025, driven by China's vertically integrated clusters that convert quartz ore into electronics, solar panels, and engineered surfaces within a few hundred kilometers. Regional regulators continue to streamline mine-to-fab logistics, further compressing working capital cycles. India and Vietnam are emerging as supplementary processing hubs, buoyed by favorable power tariffs and incentives to localize semiconductor back-end. The 6.27% regional CAGR through 2031 is underpinned by relentless smartphone adoption, rooftop solar policies, and middle-class home upgrades across ASEAN economies.
North America remains strategically vital owing to Spruce Pine's ultra-pure vein-the bedrock for 80-90% of global HPQ feedstock before the 2024 hurricane event. Sibelco's USD 700 million expansion and The Quartz Corp's Norway commissioning reflect a dual-axis mitigation strategy that pairs geological excellence with geographic redundancy. U.S. fab build-outs in Arizona, Texas, and New York offer a downstream pull, yet higher energy costs and stringent environmental permitting temper capacity growth in commodity grades. Canada and Mexico serve regional construction markets with proximity advantages, while aiming to attract niche HPQ investments through renewable power corridors.
Europe leverages stringent ESG standards to carve out a premium niche in value-added quartz processing. Imerys operates deposits in Sweden and France, integrating them with fused silica plants adjacent to low-carbon hydro power. Germany supplies precision machinery for slurry-less sawing and hot-zone assembly, ensuring technological leadership despite modest ore endowment. South America, the Middle East, and Africa contribute incremental tonnage, particularly from Brazil's Minas Gerais belt, yet infrastructure deficits and water scarcity cap near-term growth. These regions rely heavily on imports, reinforcing Asia-Pacific and North American suppliers' influence over the global quartz market.
- AGC Inc.
- Australian Silica Quartz Group Ltd
- Dow
- East Hope Group
- Elkem ASA
- Ferroglobe
- Hoshine Silicon Industry Co., Ltd.
- Imerys
- India Quartz
- Jiangsu Pacific Quartz Co., Ltd
- MACTUS
- NIHON DEMPA KOGYO CO., LTD.
- Nordic Mining ASA
- Saint-Gobain
- Sibelco
- SIMCOA
- The Quartz Corp
- WACKER CHEMIE AG
Additional Benefits:
- The market estimate (ME) sheet in Excel format
- 3 months of analyst support
TABLE OF CONTENTS
1 Introduction
- 1.1 Study Assumptions and Market Definition
- 1.2 Scope of the Study
2 Research Methodology
3 Executive Summary
4 Market Landscape
- 4.1 Market Overview
- 4.2 Market Drivers
- 4.2.1 Growing solar-PV capacity surge
- 4.2.2 Semiconductor node-shrink drives ultra-high-purity demand
- 4.2.3 Boom in engineered-quartz interior surfaces
- 4.2.4 Fibre-optic rollout in 5G/FTTx
- 4.2.5 Tailings-derived HPQ lowers cost curve
- 4.3 Market Restraints
- 4.3.1 Ecological impact of quartz mining
- 4.3.2 Energy-intensive purification process
- 4.3.3 Climate-driven mine disruptions
- 4.4 Value Chain Analysis
- 4.5 Porter's Five Forces
- 4.5.1 Bargaining Power of Suppliers
- 4.5.2 Bargaining Power of Buyers
- 4.5.3 Threat of New Entrants
- 4.5.4 Threat of Substitutes
- 4.5.5 Competitive Rivalry
5 Market Size and Growth Forecasts (Volume)
- 5.1 By Product Type
- 5.1.1 High-purity Quartz
- 5.1.1.1 Quartz Surface and Tile
- 5.1.1.2 Fused Quartz Crucible
- 5.1.1.3 Quartz Glass
- 5.1.2 Quartz Crystal
- 5.1.3 Silicon Metal
- 5.1.1 High-purity Quartz
- 5.2 By End-user Industry
- 5.2.1 Electronics and Semiconductor
- 5.2.2 Solar
- 5.2.3 Building and Construction
- 5.2.4 Optical Fiber and Telecommunication
- 5.2.5 Automotive
- 5.2.6 Other End-user Industries
- 5.3 By Geography
- 5.3.1 Asia-Pacific
- 5.3.1.1 China
- 5.3.1.2 India
- 5.3.1.3 Japan
- 5.3.1.4 South Korea
- 5.3.1.5 Malaysia
- 5.3.1.6 Thailand
- 5.3.1.7 Indonesia
- 5.3.1.8 Vietnam
- 5.3.1.9 Rest of Asia-Pacific
- 5.3.2 North America
- 5.3.2.1 United States
- 5.3.2.2 Canada
- 5.3.2.3 Mexico
- 5.3.3 Europe
- 5.3.3.1 Germany
- 5.3.3.2 United Kingdom
- 5.3.3.3 France
- 5.3.3.4 Italy
- 5.3.3.5 Spain
- 5.3.3.6 NORDIC Countries
- 5.3.3.7 Turkey
- 5.3.3.8 Russia
- 5.3.3.9 Rest of Europe
- 5.3.4 South America
- 5.3.4.1 Brazil
- 5.3.4.2 Argentina
- 5.3.4.3 Colombia
- 5.3.4.4 Rest of South America
- 5.3.5 Middle-East and Africa
- 5.3.5.1 Saudi Arabia
- 5.3.5.2 Qatar
- 5.3.5.3 United Arab Emirates
- 5.3.5.4 Nigeria
- 5.3.5.5 Egypt
- 5.3.5.6 South Africa
- 5.3.5.7 Rest of Middle-East and Africa
- 5.3.1 Asia-Pacific
6 Competitive Landscape
- 6.1 Market Concentration
- 6.2 Strategic Moves
- 6.3 Market Share (%)/Ranking Analysis
- 6.4 Company Profiles (includes Global level Overview, Market level overview, Core Segments, Financials as available, Strategic Information, Market Rank/Share for key companies, Products and Services, and Recent Developments)
- 6.4.1 AGC Inc.
- 6.4.2 Australian Silica Quartz Group Ltd
- 6.4.3 Dow
- 6.4.4 East Hope Group
- 6.4.5 Elkem ASA
- 6.4.6 Ferroglobe
- 6.4.7 Hoshine Silicon Industry Co., Ltd.
- 6.4.8 Imerys
- 6.4.9 India Quartz
- 6.4.10 Jiangsu Pacific Quartz Co., Ltd
- 6.4.11 MACTUS
- 6.4.12 NIHON DEMPA KOGYO CO., LTD.
- 6.4.13 Nordic Mining ASA
- 6.4.14 Saint-Gobain
- 6.4.15 Sibelco
- 6.4.16 SIMCOA
- 6.4.17 The Quartz Corp
- 6.4.18 WACKER CHEMIE AG
7 Market Opportunities and Future Outlook
- 7.1 White-space and Unmet-need Assessment
 全球石英市場規模、佔有率、趨勢和成長分析報告(2026-2034年)
 石英市場規模、佔有率、趨勢及預測(按產品、最終用戶及地區分類),2026-2034年
 2026年全球石英市場報告
 住宅人造石英石市場(按產品類型、表面處理、厚度、應用和分銷管道分類)預測(2026-2032年)石英管市場依直徑、形狀、壁厚、應用通路-2026-2032年全球預測石英粉市場按產品類型、純度、粒徑、技術、應用和通路分類-2026-2032年全球預測電子級石英砂市場按產品類型、粒徑、純度等級、最終用途產業和分銷管道分類-全球預測(2026-2032 年)
 人造石英石表面市場規模、佔有率和成長分析(按類型、應用、表面處理、圖案、技術和地區分類)—產業預測(2026-2033 年)
 石英市場規模、佔有率及成長分析(按產品、應用及地區分類)-2026年至2033年產業預測
 石英市場規模、佔有率和趨勢分析報告:按等級、應用、地區和細分市場預測(2025-2033 年)