


 |
市場調查報告書
商品編碼
1906282
POP展示架:市佔率分析、產業趨勢與統計、成長預測(2026-2031年)POP Display - Market Share Analysis, Industry Trends & Statistics, Growth Forecasts (2026 - 2031) |
||||||
※ 本網頁內容可能與最新版本有所差異。詳細情況請與我們聯繫。
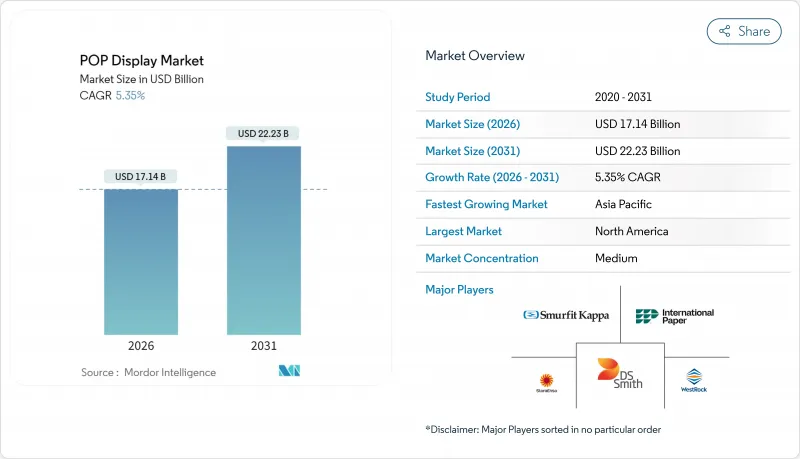
預計到 2026 年,POP 展示市場價值將達到 171.4 億美元,高於 2025 年的 162.7 億美元。
預計到 2031 年將達到 222.3 億美元,2026 年至 2031 年的複合年成長率為 5.35%。
儘管電子商務蓬勃發展,但衝動性購買仍然在實體店中普遍存在,因此零售商持續增加對商店陳列的投入。落地展示架和瓦楞紙板解決方案仍然是商品展示方案的基礎,這反映出零售商需要經濟高效、可回收且能快速部署到全國門市網路的材料。零售媒體網路的日益普及推動了感測器和數位螢幕在實體展示中的整合,使品牌能夠即時衡量顧客參與度並最佳化陳列圖。同時,永續性法規和不斷上漲的原料成本正在加速向纖維基材料和閉合迴路供應鏈的轉型。
全球POP展示市場趨勢與洞察
新興經濟體中日常消費品和便利商店的快速擴張
7-Eleven 和 Lawson 等連鎖店積極分店宣傳活動,推動了當地對緊湊型產品展示架的需求,這些展示架能夠在有限的空間內最大限度地提升銷售效果。在印度尼西亞,小型商店佔現代食品雜貨交易量的 73%(高於 2013 年的 47%),這凸顯了對適合有限占地面積的垂直模組化解決方案的需求。
零售商需要高轉換率的店內接點
品牌所有者如今期望從每一平方英尺的銷售空間中獲得可衡量的收益。費列羅的「2025完美門市」計畫正是這種轉變的體現,該計畫將展示與分析儀錶板結合,提供SKU等級的即時銷售數據。這些數據豐富的系統使品類經理能夠在促銷期間調整商品陳列位置,而不是在促銷結束後才進行調整。
電子商務和數位廣告佔據了實體店預算的大部分。
隨著行銷主管競相追求可歸因點擊量,線上廣告的興起抑制了部分實體商品行銷支出。研究表明,投資回報率的不確定性以及對干擾門市營運的擔憂,正在減緩店內零售媒體的普及,並推遲預算回歸實體店面。為了彌補這一缺口,零售商們正在嘗試音訊廣告和貨架邊緣螢幕,這些方式只需對占地面積進行最小程度的重新配置。
細分市場分析
到2025年,落地式展示架將佔POP展示市場43.15%的佔有率,並以5.75%的複合年成長率持續成長,這印證了大型展示架是體驗式銷售區域的核心。櫃檯式和端架式展示架旨在促進收銀台附近或貨架盡頭的衝動性購買。托盤式展示架則適用於倉儲式會員店和折扣零售商,支援越庫作業,實現商品直接送達銷售區域。據Look Company稱,雜貨店擴大採用試吃區和地面圖形來鼓勵顧客使用食譜主導購物車,從而推動了對結合紙板和螢幕的混合結構的需求。落地式展示架的規模允許嵌入感測器、QR碼和NFC標籤,將實體觸點與零售媒體網路連接起來。品牌支付的黃金地段租金為門市經營者提供了新的收入來源,進一步擴大了POP展示市場。端架式展示架的升級也遵循著類似的趨勢,提供可根據一天中不同時間更換創新的動態LED頂燈,無需人工貼標籤即可提高SKU的輪換效率。
到2025年,瓦楞紙板將佔POP展示市場35.05%的佔有率,而發泡板將繼續以6.1%的複合年成長率成長。其光滑的表面有利於高解析度印刷,這對於化妝品和高科技設備至關重要。纖維材料的優點在於其輕盈、可回收和相對較低的單位成本。塑膠和金屬是戶外和潮濕地區長壽命貨架展示架的必備材料,但不斷上漲的原生聚合物課稅加大了轉向替代材料的壓力。新興的生物複合板將纖維素和農作物殘渣混合,在較低的紙張重量下即可達到相同的抗壓強度。零售商歡迎這些基材,因為它們可以簡化EPR系統要求的報廢產品回收審核。發泡板的崛起在高階護膚領域尤其明顯,其結構、色彩還原度和邊緣發光標識無需笨重的鋼架即可提升貨架展示效果。
POP展示架市場按產品類型(檯面展示架、落地展示架、端架展示架等)、材料(瓦楞紙、塑膠、金屬等)、銷售管道(百貨公司、超級市場/大賣場等)、最終用戶(食品飲料、化妝品及個人護理等)和地區進行細分。市場預測以以金額為準。
區域分析
至2025年,北美將維持24.25%的POP展示市佔率。到2030年,零售媒體的普及和資本投資(例如WestRock位於威斯康辛州的「超級工廠」自動化設施)將推動市場成長,該設施將提升瓦楞紙板的生產能力並縮短前置作業時間。美國食品零售商正透過結合數位和光纖自助終端的程序化預訂系統,加速端架庫存的貨幣化。加拿大的延伸生產者責任制(EPR)立法正在推動對經認證的路邊可回收展示架的需求。與此同時,墨西哥不斷壯大的中產階級正在推動與跨國供應鏈相關的便利商店連鎖企業採用品牌運輸容器。
預計亞太地區將達到最高成長率,到2031年複合年成長率將達到5.55%。便利商店連鎖計畫到2026年新增1萬家門市。中國的智慧零售商正在門市實施人工智慧驅動的貨架陳列最佳化,將產品輪換週期從數週縮短至數小時。印度的連鎖零售商正在將購物中心擴展到區域城市,品牌商則利用雙語圖文和QR碼食譜演示來推廣產品知識。在東南亞的商店(許多面積不到200平方公尺),預先組裝的輕薄可折疊展示架正逐漸成為主流,以降低運輸成本。歐洲的POP展示市場正圍繞著永續性。英國的塑膠稅和德國的包裝方法(VerpackG)正在推動循環材料的使用(參見gov.uk)。零售商要求供應商提供管理證書,並擴大使用FSC認證的紙板和水性油墨。法國的大型超市正在試行使用防冷凝紙質冷藏櫃罩,並擴大冷藏區紡織材料的使用。數位化應用程式也不斷成長,一家荷蘭食品集團已將其配備電子貨架的貨架與行動應用程式連接,以便即時推送促銷訊息。儘管面臨通膨壓力,化妝品和奢侈食品領域的高階策略仍能維持單價,並抵銷價格敏感型品類銷售成長放緩的影響。
其他福利:
- Excel格式的市場預測(ME)表
- 分析師支持(3個月)
目錄
第1章 引言
- 研究假設和市場定義
- 調查範圍
第2章調查方法
第3章執行摘要
第4章 市場情勢
- 市場概覽
- 市場促進因素
- 日常消費品(FMCG)和便利商店在新興國家的快速擴張
- 店內接點的需求促使零售商實現高轉換率
- 永續纖維基紙板取代塑膠
- 配備智慧感測器的POP用於即時分析
- 模組化顯示器即服務 (DaaS) 租賃模式日益普及
- 利用3D列印技術實現超小批量客製化顯示器
- 市場限制
- 電子商務和數位廣告佔據了商店預算的大部分。
- 箱板紙和樹脂價格的波動給利潤率帶來了壓力。
- 嚴格的掩埋和塑膠稅法規
- 由於店面面積縮小,商品陳列密度降低
- 供應鏈分析
- 監管環境
- 技術展望
- 波特五力分析
- 供應商的議價能力
- 買方的議價能力
- 新進入者的威脅
- 替代品的威脅
- 競爭對手之間的競爭
- 對影響市場的宏觀經濟因素進行評估
第5章 市場規模與成長預測
- 依產品類型
- 櫃檯展示
- 落地展示
- 端蓋展示
- 托盤展示
- 其他
- 材料
- 紙板
- 塑膠
- 金屬
- 樹
- 其他
- 按銷售管道
- 百貨公司
- 超級市場和大賣場
- 專賣店
- 其他
- 最終用戶
- 食品/飲料
- 化妝品和個人護理
- 製藥
- 電子設備/家用電器
- 其他
- 按地區
- 北美洲
- 美國
- 加拿大
- 墨西哥
- 南美洲
- 巴西
- 阿根廷
- 其他南美洲
- 歐洲
- 德國
- 英國
- 法國
- 義大利
- 西班牙
- 其他歐洲地區
- 亞太地區
- 中國
- 日本
- 印度
- 韓國
- 東南亞
- 亞太其他地區
- 中東和非洲
- 中東
- 沙烏地阿拉伯
- 阿拉伯聯合大公國
- 土耳其
- 其他中東地區
- 非洲
- 南非
- 奈及利亞
- 埃及
- 其他非洲地區
- 中東
- 北美洲
第6章 競爭情勢
- 市場集中度
- 策略趨勢
- 市佔率分析
- 公司簡介
- DS Smith PLC
- WestRock Company
- Smurfit Kappa Group PLC
- International Paper Company
- Stora Enso Oyj
- Pratt Industries Inc.
- Sonoco Products Company
- Graphic Packaging International
- Georgia-Pacific LLC
- Menasha Packaging Company LLC
- Creative Displays Now!
- PPDandG
- Shenzhen WOW Display Co. Ltd.
- Mondi Group PLC
- Durabox Displays
- FFR Merchandising
- Parkway Display Products Ltd.
- Great Northern Corporation
- Hansen Display Group
- Repack Canada
第7章 市場機會與未來展望
The POP display market size in 2026 is estimated at USD 17.14 billion, growing from 2025 value of USD 16.27 billion with 2031 projections showing USD 22.23 billion, growing at 5.35% CAGR over 2026-2031.
Retailers continue to invest in on-shelf theatre because impulse purchases still originate in stores even as e-commerce grows. Floor displays and corrugated cardboard solutions remain the backbone of merchandising programs, reflecting retailers' need for cost-effective, recyclable materials that can be deployed quickly across national store networks. Heightened interest in retail media networks is driving the integration of sensors and digital screens into physical displays, allowing brands to measure engagement and optimize planograms in real time. At the same time, sustainability legislation and raw-material cost spikes are accelerating the shift toward fibre-based substrates and closed-loop supply chains.
Global POP Display Market Trends and Insights
Surging FMCG and Convenience-Store Roll-outs in Emerging Economies
Aggressive store-opening campaigns by chains such as 7-Eleven and Lawson are fuelling localised demand for compact merchandising fixtures that can generate maximum impact within tight footprints. Small-format stores already represent 73% of modern grocery trade in Indonesia, compared with 47% in 2013, underscoring the need for vertical, modular solutions that fit limited floor space.
Retailers' Demand for High-conversion In-store Touchpoints
Brand owners now expect every square foot of selling space to deliver measurable returns. Ferrero's 2025 Perfect Store programme illustrates this shift, with displays linked to analytics dashboards that reveal SKU-level performance in real time. Such data-rich installations allow category managers to tweak placement during a promotion cycle rather than after it.
E-commerce and Digital Ads Siphoning In-store Budgets
A tilt toward online advertising has curbed some physical merchandising spend as marketing chiefs chase attributable clicks. Research finds ROI uncertainty and store interference fears slowing adoption of in-store retail media, delaying budget migration back to fixtures. To compensate, retailers are piloting audio ads and shelf-edge screens that require minimal floor-space reconfiguration.
Other drivers and restraints analyzed in the detailed report include:
- Fibre-based Corrugated Replacing Plastics
- Smart Sensor-equipped POP for Real-time Analytics
- Volatile Linerboard and Resin Pricing Squeezes Margins
For complete list of drivers and restraints, kindly check the Table Of Contents.
Segment Analysis
Floor units held 43.15% share of the POP display market in 2025 and are expanding at 5.75% CAGR, confirming that large-format fixtures remain the anchor of experiential selling zones. Countertop and end-cap units target impulse moments near tills and aisle terminations. Pallet displays support warehouse clubs and discount retailers, enabling cross-docking straight to sales floors. The Look Company notes that grocers now fuse sampling stations with floor graphics to trigger recipe-led baskets, spurring demand for hybrid cardboard-and-screen constructions.Floor displays' scale allows embedded sensors, QR codes and NFC tags, linking physical touchpoints to retail-media networks. As brands pay tenancy fees for prime floor real estate, store operators derive new income streams, further scaling the POP display market. End-cap upgrades mirror that trend, offering dynamic LED headers that switch creatives by daypart, improving SKU rotation without manual relabeling.
Corrugated cardboard represented 35.05% of the POP display market size in 2025, but foam board is advancing at 6.1% CAGR because its smooth surface delivers high-definition print crucial for cosmetics and tech gadgets. Fibre dominance stems from its light weight, recyclability and comparatively low unit cost. Plastic and metal remain vital for long-life gondolas in outdoor or high-humidity zones, yet taxes on virgin polymer intensify substitution pressure. Emergent bio-composite boards mix cellulose with crop residue, promising similar crush resistance at lower grammage. Retailers welcome such substrates because they simplify end-of-life recycling audits mandated by EPR regimes. Foam board's rise is pronounced in premium skincare where structure, colour fidelity and edge-lit logos elevate shelf presence without heavy steel frames.
POP Display Market is Segmented by Product Type (Countertop Displays, Floor Displays, End-Cap Displays, and More), Material (Corrugated Cardboard, Plastic, Metal, and More), Sales Channel (Department Stores, Supermarkets and Hypermarkets, and More), End User (Food and Beverages, Cosmetics and Personal Care and More) and by Geography. The Market Forecasts are Provided in Terms of Value (USD).
Geography Analysis
North America retained 24.25% share of the POP display market in 2025. Growth through 2030 stems from retail-media rollouts and capital investments such as WestRock's automated Wisconsin "superplant," which enhances corrugated capacity and shortens lead times. US grocers increasingly monetise end-cap inventory through programmatic booking systems that bundle digital kiosks with fibre kiosks. Canada's EPR legislation spurs demand for displays certified for curbside recycling, while Mexico's rising middle class drives adoption of branded shippers in convenience chains linked to cross-border supply hubs.
Asia-Pacific will record the fastest CAGR at 5.55% through 2031 as convenience chains plan 10,000 additional outlets by 2026. Chinese smart retail operators retrofit stores with AI-driven planogram optimisation, compressing refresh cycles from weeks to hours. India's organised retail corridor adds malls in second-tier cities, where brands deploy bilingual graphics and QR-coded recipe demos to build category education. Southeast Asian formats, often under 200 sqm, rely on slim, fold-flat towers that ship in knock-down kits to minimise freight.Europe's POP display market dynamics revolve around sustainability. The UK's plastic-tax framework and Germany's VerpackG law incentivise closed-loop substrates gov.uk. Retailers demand chain-of-custody certification, propelling interest in FSC-certified corrugated and water-based inks. French hypermarkets trial paper-based cooler claddings that resist condensation, extending fibre usage into refrigerated aisles. Digital adoption is growing as well, with grocery groups in the Netherlands linking ESL-equipped gondolas to mobile apps for instant promotions. Despite inflationary headwinds, premium positioning across cosmetics and gourmet food sustains unit values, offsetting volume softness in price-sensitive categories.
- DS Smith PLC
- WestRock Company
- Smurfit Kappa Group PLC
- International Paper Company
- Stora Enso Oyj
- Pratt Industries Inc.
- Sonoco Products Company
- Graphic Packaging International
- Georgia-Pacific LLC
- Menasha Packaging Company LLC
- Creative Displays Now!
- PPDandG
- Shenzhen WOW Display Co. Ltd.
- Mondi Group PLC
- Durabox Displays
- FFR Merchandising
- Parkway Display Products Ltd.
- Great Northern Corporation
- Hansen Display Group
- Repack Canada
Additional Benefits:
- The market estimate (ME) sheet in Excel format
- 3 months of analyst support
TABLE OF CONTENTS
1 INTRODUCTION
- 1.1 Study Assumptions and Market Definition
- 1.2 Scope of the Study
2 RESEARCH METHODOLOGY
3 EXECUTIVE SUMMARY
4 MARKET LANDSCAPE
- 4.1 Market Overview
- 4.2 Market Drivers
- 4.2.1 Surging FMCG and C-store roll-outs in emerging economies
- 4.2.2 Retailers demand for high-conversion in-store touchpoints
- 4.2.3 Sustainable, fibre-based corrugated replacing plastics
- 4.2.4 Smart sensor-equipped POP for real-time analytics
- 4.2.5 Modular display-as-a-service rental models gain traction
- 4.2.6 3-D printing enabling ultra-short-run custom displays
- 4.3 Market Restraints
- 4.3.1 E-commerce and digital ads siphoning in-store budgets
- 4.3.2 Volatile linerboard and resin pricing squeezes margins
- 4.3.3 Strict landfill and plastics-tax regulations
- 4.3.4 Shrink-floor retail concepts lowering display density
- 4.4 Supply-Chain Analysis
- 4.5 Regulatory Landscape
- 4.6 Technological Outlook
- 4.7 Porter's Five Forces Analysis
- 4.7.1 Bargaining Power of Suppliers
- 4.7.2 Bargaining Power of Buyers
- 4.7.3 Threat of New Entrants
- 4.7.4 Threat of Substitutes
- 4.7.5 Intensity of Competitive Rivalry
- 4.8 Assesment of Macroeconomic Factors on the market
5 MARKET SIZE AND GROWTH FORECASTS (VALUE)
- 5.1 By Product Type
- 5.1.1 Countertop Displays
- 5.1.2 Floor Displays
- 5.1.3 End-cap Displays
- 5.1.4 Pallet Displays
- 5.1.5 Others
- 5.2 By Material
- 5.2.1 Corrugated Cardboard
- 5.2.2 Plastic
- 5.2.3 Metal
- 5.2.4 Wood
- 5.2.5 Others
- 5.3 By Sales Channel
- 5.3.1 Department Stores
- 5.3.2 Supermarkets and Hypermarkets
- 5.3.3 Specialty Stores
- 5.3.4 Others
- 5.4 By End User
- 5.4.1 Food and Beverages
- 5.4.2 Cosmetics and Personal Care
- 5.4.3 Pharmaceuticals
- 5.4.4 Electronics and Appliances
- 5.4.5 Others
- 5.5 By Geography
- 5.5.1 North America
- 5.5.1.1 United States
- 5.5.1.2 Canada
- 5.5.1.3 Mexico
- 5.5.2 South America
- 5.5.2.1 Brazil
- 5.5.2.2 Argentina
- 5.5.2.3 Rest of South America
- 5.5.3 Europe
- 5.5.3.1 Germany
- 5.5.3.2 United Kingdom
- 5.5.3.3 France
- 5.5.3.4 Italy
- 5.5.3.5 Spain
- 5.5.3.6 Rest of Europe
- 5.5.4 Asia-Pacific
- 5.5.4.1 China
- 5.5.4.2 Japan
- 5.5.4.3 India
- 5.5.4.4 South Korea
- 5.5.4.5 Southeast Asia
- 5.5.4.6 Rest of Asia-Pacific
- 5.5.5 Middle East and Africa
- 5.5.5.1 Middle East
- 5.5.5.1.1 Saudi Arabia
- 5.5.5.1.2 United Arab Emirates
- 5.5.5.1.3 Turkey
- 5.5.5.1.4 Rest of Middle East
- 5.5.5.2 Africa
- 5.5.5.2.1 South Africa
- 5.5.5.2.2 Nigeria
- 5.5.5.2.3 Egypt
- 5.5.5.2.5 Rest of Africa
- 5.5.5.1 Middle East
- 5.5.1 North America
6 COMPETITIVE LANDSCAPE
- 6.1 Market Concentration
- 6.2 Strategic Moves
- 6.3 Market Share Analysis
- 6.4 Company Profiles (includes Global level Overview, Market level overview, Core Segments, Financials as available, Strategic Information, Market Rank/Share for key companies, Products and Services, and Recent Developments)
- 6.4.1 DS Smith PLC
- 6.4.2 WestRock Company
- 6.4.3 Smurfit Kappa Group PLC
- 6.4.4 International Paper Company
- 6.4.5 Stora Enso Oyj
- 6.4.6 Pratt Industries Inc.
- 6.4.7 Sonoco Products Company
- 6.4.8 Graphic Packaging International
- 6.4.9 Georgia-Pacific LLC
- 6.4.10 Menasha Packaging Company LLC
- 6.4.11 Creative Displays Now!
- 6.4.12 PPDandG
- 6.4.13 Shenzhen WOW Display Co. Ltd.
- 6.4.14 Mondi Group PLC
- 6.4.15 Durabox Displays
- 6.4.16 FFR Merchandising
- 6.4.17 Parkway Display Products Ltd.
- 6.4.18 Great Northern Corporation
- 6.4.19 Hansen Display Group
- 6.4.20 Repack Canada
7 MARKET OPPORTUNITIES AND FUTURE OUTLOOK
- 7.1 White-space and Unmet-need Assessment
 商店展示市場:依展示類型、通路和產業分類-2026-2032年全球市場預測商品行銷單元市場:按產品類型、最終用戶和銷售管道分類 - 2026-2032 年全球預測
 全球POP展示市場規模、佔有率、趨勢和成長分析報告(2026-2034年)全球商品行銷單元市場規模、佔有率、趨勢和成長分析報告(2026-2034)
 2032 年商品行銷單位市場預測:依產品類型、材料、通路、應用、最終用戶和地區進行分析
 地板 POP 展示市場,按產品、按材料、按類型、按最終用戶、按國家和地區 - 2024-2032 年行業分析、市場規模、市場佔有率和預測