


 |
市場調查報告書
商品編碼
1906089
基於位置的虛擬實境-市場佔有率分析、產業趨勢與統計、成長預測(2026-2031)Location-Based VR - Market Share Analysis, Industry Trends & Statistics, Growth Forecasts (2026 - 2031) |
||||||
※ 本網頁內容可能與最新版本有所差異。詳細情況請與我們聯繫。
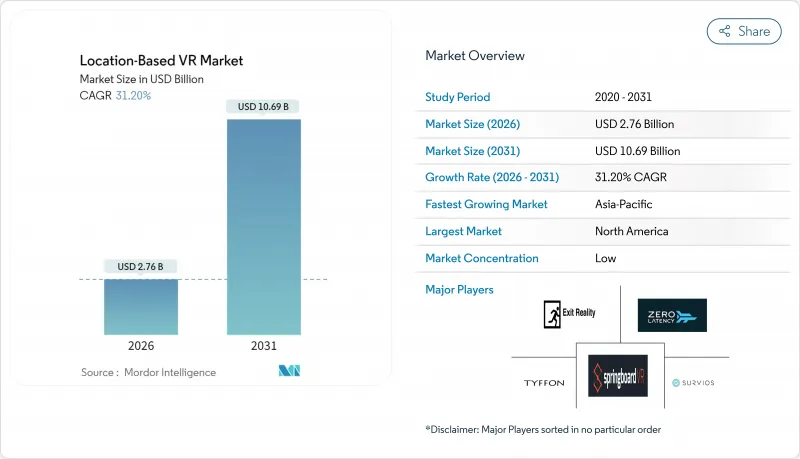
預計到 2025 年,基於位置的 VR 市場價值將達到 21 億美元,從 2026 年的 27.6 億美元成長到 2031 年的 106.9 億美元。
預計在預測期(2026-2031 年)內,複合年成長率將達到 31.2%。
硬體價格下降、與熱門智慧財產權 (IP) 的合作增加以及基礎設施的改善提升了設施的經濟效益,這些因素共同推動了這一加速成長。營運商如今將虛擬實境體驗館定位為穩定的收入來源,與保齡球館、電影院和密室逃脫遊戲廳競爭。在消費者對社交體驗的需求、活性化經營模式的興起以及城市更新補貼的津貼下,市場擴張穩步推進。設備製造商透過增加預測性診斷和無線功能來滿足設施需求,從而提高維護效率。同時,軟體平台正在將渲染轉移到雲端並縮短內容更新周期,從而增加用戶重複存取的收入潛力。這些因素共同推動了基於位置的虛擬實境市場走上穩健成長的道路。
全球基於位置的虛擬實境市場趨勢與洞察
硬體成本的快速下降提高了營運商的投資收益。
設備價格下降和無線系統佈線成本降低,正在改善場館的經濟效益。 Zero Latency 的 8 人 VR 系統目前售價為 24.5 萬美元,比上一代產品便宜 30%,同時還增加了 5K 解析度和無線串流功能。無線組件省去了耗時的設定步驟,使工作人員能夠更快地開始遊戲。頭顯內建的預測性診斷功能可減少非計劃性停機時間並降低維修預算。較低的資本支出和人員配備減少,使得位置優越的場館的投資回收期從三年縮短至最短 18 個月。價格下降正鼓勵小規模業者進入基於位置的 VR 市場,從而擴大場館的安裝基礎。
消費者對身臨其境型行動體驗的需求日益成長
消費者正增加自由裁量權的支出,用於那些無法在家複製的共用體驗。 Sandbox VR在2024年售出140萬張門票,較去年同期成長33%,美國顧客平均消費53美元。團體預訂已成為常態,85%的遊客會攜帶3-6名同伴,凸顯了社交娛樂的吸引力。研究表明,年輕一代如今更重視創造回憶而非物質財富,這種偏好即使在經濟狀況不確定時期也能維持較高的客流量。營運商正抓住這一趨勢,將食品、飲料和周邊商品融入行動體驗中,從而提高人均消費和利潤率。
較高的初始資本投入與維護成本
即使經過近期的成本削減,經營完整的遊樂設施仍然需要大量資金。一套Park Playground特許經營方案需要35萬英鎊(約44.8萬美元)的初始資金,投資者預計第一年收入將達到60萬英鎊(約合76.8萬美元),並在大約20個月內實現盈虧平衡。年度維護成本相當於設施價值的10%至15%,而內容授權費用可能高達每部作品數千美元。在區域性城市,由於房地產成本、保險成本以及熟練技術人員的人事費用,損益平衡點甚至更高。這種成本壁壘減緩了新興市場(資金籌措管道有限)的普及速度。
細分市場分析
2024年,硬體將成為設施支出的主要組成部分,這主要受頭戴式顯示器、追蹤攝影機和網路設備高昂成本的驅動。商用頭戴式顯示器的價格遠高於消費級產品,每個售價在800美元到3000美元之間,迫使營運商配備備用設備以減少停機時間。網路附加儲存、GPU伺服器和安全設備也將推高成本。
儘管硬體佔據主導地位反映了當前的支出結構,但軟體領域目前正經歷著最快的成長,年複合成長率高達 33.15%。 NVIDIA CloudXR 等邊緣雲端管道使場館能夠從異地伺服器串流逼真的環境。訂閱模式將零散的投資轉化為可控的月費,而雲端託管的分析功能則為營運商提供了關於用戶停留時間和轉換漏斗的指導。轉向軟體可以提高利潤率、穩定現金流,並在景氣衰退時期增強韌性。
VR娛樂設施面積小規模,體驗週轉快,因此非常適合購物中心和娛樂區。到2025年,VR娛樂設施將佔據45.60%的市場佔有率,並受到優先考慮透過吸引租戶來吸引顧客的房地產所有者的青睞。營運商正透過改進佈局、配備自助服務終端以及增加附帶消費(例如銷售輕食和周邊商品)來縮短等待時間。
自由漫遊競技場目前是領先的應用領域,預計到2031年將以33.40%的複合年成長率成長。無線追蹤和精簡型用戶端頭戴設備讓8-12名玩家無需背負背包即可在倉庫大小的空間內自由探索。玩家們在現實世界中解謎、躲避虛擬敵人並互相擊掌高觸感,從而帶動口碑傳播。企業團建活動和生日派對也紛紛湧向這些競技場,不僅能帶來平日收入,還能有效緩和需求的波動。
區域分析
到2025年,北美將繼續保持主導,這主要得益於富裕的消費者、有利的特許經營法律以及城市更新獎勵。舊金山的「市中心ENRG」計畫為有助於振興零售街區的體驗式場所提供5萬美元的津貼。業者通常將VR與餐飲概念結合,打造適合混合用途區域的混合空間。在加拿大,購物中心業主正在將現有的主力店重新定位為娛樂中心,協調VR體驗館、匹克球場和電競休息室等設施。墨西哥開發商正在採用收益分成租賃模式,以降低初始租金並吸引外國加盟商。
儘管亞太地區面積較小,但其複合年成長率卻高達33.20%,位居全球之首。中國的國家藍圖旨在2026年將VR相關產業規模擴大至3,500億日圓(人民幣),並為硬體製造商和場館連鎖提供補貼。地方政府津貼涵蓋娛樂區的土地成本,有助於降低業者的風險。日本成熟的主機遊戲機文化對內容有著極高的期望,促使場館透過區域獨家遊戲和動畫合作來打造差異化優勢。韓國樂天世界建造了一個700平方公尺的自由漫遊VR體驗館,融合了K-pop智慧財產權和社群媒體拍照點。在印度的一線城市,購物中心空置率的上升促使業主將其改造成VR娛樂叢集,並提供租金補貼。每個市場都會根據當地的休閒模式,量身訂做遊樂場、VR體驗館和教育中心的組合。
歐洲正經歷穩定成長,主要集中在德國、英國和法國。受高人均休閒消費的吸引,德國的特許經營夥伴承諾到2026年開設多達12家Sandbox VR體驗中心。英國則著重走高階路線,在倫敦和曼徹斯特的旗艦店提供精釀雞尾酒和VIP休息室。法國正利用文化基金在其國家博物館內安裝VR展品。東歐業者正利用較低的建設成本,但同時也面臨消費者接受度較低的挑戰,他們透過與西方品牌成立合資企業來共用行銷經驗。中東和非洲地區是一個新興市場,但旅遊業主導的消費為其發展提供了支撐。沙烏地阿拉伯的「2030願景」計畫正在資助在利雅德新城中心建造混合實境樂園,而阿拉伯聯合大公國的一家購物中心則將VR技術與室內跳傘和雪地樂園相結合,以保持全年客流量。
其他福利:
- Excel格式的市場預測(ME)表
- 3個月的分析師支持
目錄
第1章 引言
- 研究假設和市場定義
- 調查範圍
第2章調查方法
第3章執行摘要
第4章 市場情勢
- 市場概覽
- 市場促進因素
- 硬體成本的快速下降提高了營運商的投資收益(ROI)。
- 消費者對身臨其境型戶外體驗的需求日益成長
- 與熱門IP進行內容合作
- 無線自由漫遊追蹤技術的進步
- 5G邊緣串流媒體降低了本地運算成本
- 體驗式設施的城市振興津貼
- 市場限制
- 較高的初始資本投入與維護成本
- 獨家高級多人遊戲內容
- 保險費和責任險;
- 對光學元件徵收半導體關稅
- 產業價值鏈分析
- 宏觀經濟因素的影響
- 技術展望
- 監管環境
- 波特五力分析
- 供應商的議價能力
- 買方的議價能力
- 新進入者的威脅
- 替代品的威脅
- 競爭對手之間的競爭
第5章 市場規模與成長預測
- 按解決方案類型
- 硬體
- 頭戴式顯示器
- 抬頭顯示器
- 眼鏡
- 感應器
- 相機
- 軟體
- 硬體
- 透過使用
- VR娛樂設施
- VR主題樂園
- VR影院
- 自由漫遊競技場
- VR電競休息室
- 教育培訓中心
- 按最終用途
- 遊樂園
- 遊樂場工作室
- 電影院
- 博物館和文化中心
- 商業和零售商店
- 軍事和訓練設施
- 透過技術
- 2D
- 3D
- 雲端融合現實
- 按地區
- 北美洲
- 美國
- 加拿大
- 墨西哥
- 南美洲
- 巴西
- 阿根廷
- 其他南美洲
- 歐洲
- 德國
- 法國
- 英國
- 義大利
- 西班牙
- 俄羅斯
- 其他歐洲地區
- 亞太地區
- 中國
- 日本
- 韓國
- 印度
- 澳洲
- 亞太其他地區
- 中東
- 阿拉伯聯合大公國
- 沙烏地阿拉伯
- 土耳其
- 其他中東地區
- 非洲
- 南非
- 奈及利亞
- 埃及
- 其他非洲地區
- 北美洲
第6章 競爭情勢
- 市場集中度
- 策略趨勢
- 市佔率分析
- 公司簡介
- Sandbox VR Inc.
- Zero Latency Pty Ltd
- Hologate GmbH
- Dreamscape Immersive Inc.
- VRstudios Inc.
- Vertigo Games Holding BV(Springboard VR)
- EXIT VR GmbH
- Survios Inc.
- Tyffon Inc.
- Neurogaming Limited
- Ctrl V Inc.
- IMAX Corporation
- Spaces LLC
- Nomadic Inc.
- The VOID LLC
- HTC Corporation(Viveport Arcade)
- Facebook Technologies LLC(Oculus VR)
- Disney Parks, Experiences and Products Inc.
- Pico Interactive Inc.
- DPVR Co. Ltd.
第7章 市場機會與未來展望
The location-based virtual reality market was valued at USD 2.1 billion in 2025 and estimated to grow from USD 2.76 billion in 2026 to reach USD 10.69 billion by 2031, at a CAGR of 31.2% during the forecast period (2026-2031).
The acceleration comes from falling hardware prices, rising blockbuster intellectual-property partnerships, and infrastructure advances that improve venue economics. Operators now treat venues as dependable profit centers that compete with bowling, cinemas, and escape rooms. Consumer demand for social experiences, strong franchise roll-outs, and supportive urban revitalization grants keep expansion on track. Equipment makers align with venue needs by adding predictive diagnostics and wireless capability that streamline maintenance. At the same time, software platforms shift rendering to the cloud and shorten content-refresh cycles, which raises repeat-visit revenue potential. These forces collectively anchor the location-based virtual reality market on a solid growth trajectory.
Global Location-Based VR Market Trends and Insights
Rapid Hardware Cost Decline Improving ROI for Operators
Venue economics improve as equipment prices drop and wireless systems remove cabling costs. A Zero Latency eight-player rig now lists at USD 245,000, down 30% from the prior generation while adding 5K resolution and wireless streaming. Wireless packs eliminate time-consuming setup tasks so staff can turn around play sessions faster. Predictive diagnostics inside headsets cut unplanned downtime and shrink maintenance budgets. Lower capital outlays and lighter staffing shorten payback periods from three years to as little as 18 months for well located sites. The downward price curve motivates smaller entrepreneurs to enter the location-based virtual reality market, broadening the venue footprint.
Growing Consumer Appetite for Immersive Out-of-Home Experiences
Consumers channel more discretionary spending toward shared experiences that cannot be reproduced at home. Sandbox VR sold 1.4 million tickets in 2024, up 33% year over year, at an average U.S. price of USD 53 per guest. Group bookings dominate, with 85% of visits involving three to six participants, showing the draw of social play. Surveys indicate younger adults now rank memory-making activities above material goods, a preference that underpins healthy attendance even when macroeconomic conditions wobble. Operators leverage this trend by layering food, beverage, and merchandise into the outing, which lifts per-capita spend and margins.
High Upfront Capex and Maintenance
A full venue still demands sizeable capital even after recent cost declines. The Park Playground's franchise kit requires GBP 350,000 (USD 448,000) in startup funds, and investors aim for GBP 600,000 (USD 768,000) in first-year revenue to break even in about 20 months. Annual upkeep can run 10-15% of hardware value, and content licenses add several thousand dollars per title. Real-estate, insurance, and skilled technician wages push breakeven higher in secondary cities. This cost barrier slows penetration in emerging economies where financing options remain limited.
Other drivers and restraints analyzed in the detailed report include:
- Content Partnerships with Blockbuster IP
- Advances in Wireless Free-Roam Tracking
- Rising Insurance and Liability Premiums
For complete list of drivers and restraints, kindly check the Table Of Contents.
Segment Analysis
Hardware accounts for the bulk of 2024 venue spending because head-mounted displays, tracking cameras, and networking gear command premium prices. Commercial-grade headsets sell for USD 800 to USD 3,000 apiece, far above consumer models, and operators must own spares to minimize downtime. Network-attached storage devices, GPU servers, and safety gear push the bill higher.
Although hardware dominance reflects today's spending mix, software now posts the fastest rise at 33.15% CAGR. Edge-cloud pipelines like NVIDIA CloudXR let venues stream photorealistic environments from off-site servers. Subscription models convert lumpy investments into manageable monthly fees, and cloud-hosted analytics guide operators on dwell times and conversion funnels. The pivot toward software lifts margins and smooths cash flow, offering resiliency in downturns
VR Arcades occupy modest footprints, deliver quick session turnover, and suit mall or high-street settings. They held 45.60% share in 2025 because landlords favor such tenants for foot-traffic generation. Operators refine layouts with self-serve kiosks that shorten wait lines and grow ancillary spend on snacks and merchandise.
Free-Roam Arenas now pace the application leaderboard with 33.40% CAGR through 2031. Wireless tracking and thin-client headsets allow 8-12 players to navigate warehouse-scale spaces without backpacks. Teams solve puzzles, dodge digital foes, and share real-world high-fives, which elevates word-of-mouth marketing. Corporate team-building events and birthday parties gravitate to arenas, producing weekday revenue that smooths peaks and troughs.
The Location-Based Virtual Reality Market Report is Segmented by Solution Type (Hardware, and Software), Application (VR Arcades, VR Theme Parks, VR Cinemas, Free-Roam Arenas, and More), End-Use (Amusement Parks, Arcade Studios, Cinemas, Museums and Cultural Centres, Commercial and Retail Venues, and More), Technology (2D, 3D, and Cloud Merged Reality), and Geography. The Market Forecasts are Provided in Terms of Value (USD).
Geography Analysis
North America retains leadership with 39.60% of location-based virtual reality market share in 2025 thanks to affluent consumers, favorable franchising laws, and urban revitalization incentives. San Francisco's Downtown ENRG program earmarks USD 50,000 grants for experiential venues that help reactivate retail corridors. Operators often pair VR with food and beverage concepts, creating hybrid spaces that fit mixed-use districts. In Canada, mall owners reposition legacy anchor stores as entertainment hubs that host VR arenas, pickleball courts, and e-sports lounges under one roof. Mexican developers adopt revenue-sharing lease models that lower upfront rent and invite foreign franchisees.
Asia Pacific, while smaller today, delivers the fastest 33.20% CAGR. China's national roadmap targets RMB 350 billion in overall VR activity by 2026, funneling subsidies toward hardware makers and venue chains. Provincial grants cover land costs for entertainment districts, reducing operator risk. Japan's mature console culture fuels high content expectations, so venues attain differentiation with location-exclusive titles and anime collaborations. South Korea's Lotte World built a 700-square-meter free-roam arena that ties into K-pop intellectual property and social-media-friendly photo zones. India's first-tier cities witness rising mall vacancy rates, which landlords convert into VR entertainment clusters at subsidized rents. Each market tailors its mix of arcades, arenas, and educational centres to local leisure patterns.
Europe posts steady growth anchored by Germany, the United Kingdom, and France. German franchise partners committed to rolling out up to 12 Sandbox VR locations each by 2026, attracted by strong per-capita spending on leisure. The United Kingdom favors premium positioning, with flagship London and Manchester venues bundling craft cocktails and VIP lounges. France capitalizes on cultural funding to install VR exhibits in national museums. Eastern European operators leverage lower construction costs yet face slower consumer adoption, prompting joint ventures with Western brands to share marketing know-how. The Middle East and Africa region, though still emerging, enjoys tourist-led spending. Saudi Arabia's Vision 2030 plan finances mixed-reality parks in Riyadh's new downtown, and United Arab Emirates malls integrate VR with indoor skydiving and snow parks to maintain year-round traffic.
- Sandbox VR Inc.
- Zero Latency Pty Ltd
- Hologate GmbH
- Dreamscape Immersive Inc.
- VRstudios Inc.
- Vertigo Games Holding B.V. (Springboard VR)
- EXIT VR GmbH
- Survios Inc.
- Tyffon Inc.
- Neurogaming Limited
- Ctrl V Inc.
- IMAX Corporation
- Spaces LLC
- Nomadic Inc.
- The VOID LLC
- HTC Corporation (Viveport Arcade)
- Facebook Technologies LLC (Oculus VR)
- Disney Parks, Experiences and Products Inc.
- Pico Interactive Inc.
- DPVR Co. Ltd.
Additional Benefits:
- The market estimate (ME) sheet in Excel format
- 3 months of analyst support
TABLE OF CONTENTS
1 INTRODUCTION
- 1.1 Study Assumptions and Market Definition
- 1.2 Scope of the Study
2 RESEARCH METHODOLOGY
3 EXECUTIVE SUMMARY
4 MARKET LANDSCAPE
- 4.1 Market Overview
- 4.2 Market Drivers
- 4.2.1 Rapid hardware cost decline improving ROI for operators
- 4.2.2 Growing consumer appetite for immersive out-of-home experiences
- 4.2.3 Content partnerships with blockbuster IP
- 4.2.4 Advances in wireless free-roam tracking
- 4.2.5 5G edge streaming reduces in-venue compute costs
- 4.2.6 Urban revitalisation grants for experiential venues
- 4.3 Market Restraints
- 4.3.1 High upfront capex and maintenance
- 4.3.2 Limited premium multiplayer content
- 4.3.3 Rising insurance and liability premiums
- 4.3.4 Semiconductor tariffs on optical components
- 4.4 Industry Value Chain Analysis
- 4.5 Impact of Macroeconomic Factors
- 4.6 Technological Outlook
- 4.7 Regulatory Landscape
- 4.8 Porter's Five Forces Analysis
- 4.8.1 Bargaining Power of Suppliers
- 4.8.2 Bargaining Power of Buyers
- 4.8.3 Threat of New Entrants
- 4.8.4 Threat of Substitute Products
- 4.8.5 Intensity of Competitive Rivalry
5 MARKET SIZE AND GROWTH FORECASTS (VALUE)
- 5.1 By Solution Type
- 5.1.1 Hardware
- 5.1.1.1 Head-Mounted Displays
- 5.1.1.2 Head-Up Displays
- 5.1.1.3 Glasses
- 5.1.1.4 Sensors
- 5.1.1.5 Cameras
- 5.1.2 Software
- 5.1.1 Hardware
- 5.2 By Application
- 5.2.1 VR Arcades
- 5.2.2 VR Theme Parks
- 5.2.3 VR Cinemas
- 5.2.4 Free-Roam Arenas
- 5.2.5 VR Esports Lounges
- 5.2.6 Educational and Training Centres
- 5.3 By End-Use
- 5.3.1 Amusement Parks
- 5.3.2 Arcade Studios
- 5.3.3 Cinemas
- 5.3.4 Museums and Cultural Centres
- 5.3.5 Commercial and Retail Venues
- 5.3.6 Military and Training Facilities
- 5.4 By Technology
- 5.4.1 2D
- 5.4.2 3D
- 5.4.3 Cloud Merged Reality
- 5.5 By Geography
- 5.5.1 North America
- 5.5.1.1 United States
- 5.5.1.2 Canada
- 5.5.1.3 Mexico
- 5.5.2 South America
- 5.5.2.1 Brazil
- 5.5.2.2 Argentina
- 5.5.2.3 Rest of South America
- 5.5.3 Europe
- 5.5.3.1 Germany
- 5.5.3.2 France
- 5.5.3.3 United Kingdom
- 5.5.3.4 Italy
- 5.5.3.5 Spain
- 5.5.3.6 Russia
- 5.5.3.7 Rest of Europe
- 5.5.4 Asia Pacific
- 5.5.4.1 China
- 5.5.4.2 Japan
- 5.5.4.3 South Korea
- 5.5.4.4 India
- 5.5.4.5 Australia
- 5.5.4.6 Rest of Asia Pacific
- 5.5.5 Middle East
- 5.5.5.1 United Arab Emirates
- 5.5.5.2 Saudi Arabia
- 5.5.5.3 Turkey
- 5.5.5.4 Rest of Middle East
- 5.5.6 Africa
- 5.5.6.1 South Africa
- 5.5.6.2 Nigeria
- 5.5.6.3 Egypt
- 5.5.6.4 Rest of Africa
- 5.5.1 North America
6 COMPETITIVE LANDSCAPE
- 6.1 Market Concentration
- 6.2 Strategic Moves
- 6.3 Market Share Analysis
- 6.4 Company Profiles {(includes Global level Overview, Market level overview, Core Segments, Financials as available, Strategic Information, Market Rank/Share for key companies, Products and Services, and Recent Developments)}
- 6.4.1 Sandbox VR Inc.
- 6.4.2 Zero Latency Pty Ltd
- 6.4.3 Hologate GmbH
- 6.4.4 Dreamscape Immersive Inc.
- 6.4.5 VRstudios Inc.
- 6.4.6 Vertigo Games Holding B.V. (Springboard VR)
- 6.4.7 EXIT VR GmbH
- 6.4.8 Survios Inc.
- 6.4.9 Tyffon Inc.
- 6.4.10 Neurogaming Limited
- 6.4.11 Ctrl V Inc.
- 6.4.12 IMAX Corporation
- 6.4.13 Spaces LLC
- 6.4.14 Nomadic Inc.
- 6.4.15 The VOID LLC
- 6.4.16 HTC Corporation (Viveport Arcade)
- 6.4.17 Facebook Technologies LLC (Oculus VR)
- 6.4.18 Disney Parks, Experiences and Products Inc.
- 6.4.19 Pico Interactive Inc.
- 6.4.20 DPVR Co. Ltd.
7 MARKET OPPORTUNITIES AND FUTURE OUTLOOK
- 7.1 White-Space and Unmet-Need Assessment
 虛擬實境市場:依技術類型、組件、設備類型和最終用戶分類-2026-2032年全球市場預測
 虛擬實境市場規模、佔有率、趨勢和預測:按設備類型、技術、組件、應用和地區分類,2026-2034年觸覺虛擬實境市場:依產品類型、組件和應用分類-2026年至2032年全球市場預測
 2026年全球太空虛擬實境市場報告2026年全球擴增實境市場報告2026年全球太空現實顯示器市場報告2026年全球虛擬實境市場報告
 教育領域虛擬實境(VR)市場規模、佔有率、成長率及全球產業分析:按類型、應用和地區分類的洞察,2026-2034年預測2026年全球虛擬實境地球儀市場報告2026年全球虛擬實境服務市場報告