


 |
市場調查報告書
商品編碼
1906025
印度油氣上游:市場佔有率分析、產業趨勢與統計、成長預測(2026-2031)India Oil And Gas Upstream - Market Share Analysis, Industry Trends & Statistics, Growth Forecasts (2026 - 2031) |
||||||
※ 本網頁內容可能與最新版本有所差異。詳細情況請與我們聯繫。
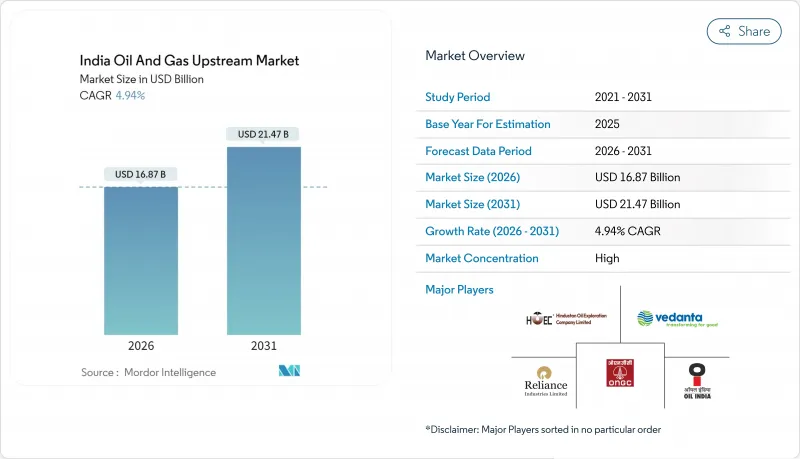
印度上游油氣市場預計將從 2025 年的 160.8 億美元成長到 2026 年的 168.7 億美元,預計到 2031 年將達到 214.7 億美元,2026 年至 2031 年的複合年成長率為 4.94%。
強力的政策支持、數位化油田的普及以及提高採收率(EOR)計劃的推進,正在抵消地質複雜性帶來的限制,使營運商能夠從成熟油田中開採更多石油,從而減緩進口成長。資本正轉向深水探勘計劃,大規模發現可以與現有基礎設施連接,但隨著印度第一代海上平台接近使用壽命終點,一波退役合約正在湧現。私人公司正在採用靈活的鑽井和完井技術,而國有企業則透過區塊持有和現有基礎設施保持戰略控制。鑽井平台、支撐劑和海底設備的供應鏈瓶頸仍然是主要的營運挑戰,但隨著「印度製造」政策下國內製造業的擴張,這些瓶頸正在逐步緩解。
印度油氣上游市場趨勢與分析
國內產量下降推動了提高採收率投資
隨著國內油氣產量從2017會計年度的3,600萬噸下降到2024會計年度的2,940萬噸,業者顯然有充分的獎勵在成熟儲存中採用強化採油(ASP)、聚合物注入和混合氣體注入技術。凱恩石油天然氣公司在2025年4月的股東報告中累計,將投入10億美元用於其拉賈斯坦邦油田的全油田強化採油(ASP)實施,目標是將採收率提高15%至20%。在阿薩姆邦的拉克瓦油田和古吉拉突邦的卡羅爾油田試驗計畫已證實,日產量增加了4000至6000桶,顯示該方法在印度430個成熟油田中具有可重複的成效。由於大部分地面基礎設施已經到位,營運商目前正將強化採油(EOR)定位為比風險更高的前沿探勘更有利可圖的替代方案,從而將投資回收期縮短至不到四年。
擴大石油和天然氣探勘和特許權政策(OALP)競標輪次和HELP獎勵
印度的《油氣探勘與許可政策》(HELP)使印度得以從成本回收的生產分成體系過渡到透明的收益分成體系,解決了審核爭議,並全面開放了天然氣銷售。據印度油氣總局稱,自2018年以來,已進行了九輪開放式油氣探勘許可(OALP)競標,共授予134個區塊,承諾的工作計劃價值13.7億美元。 BP和埃尼等主要企業已獲得即將進行的第十輪招標的資格預審,它們被涵蓋常規和非常規資源的統一許可條款所吸引。開放式區塊模式允許競標根據其探勘目標設定多邊形區塊,無需等待政府指定的競標地圖,從而加快了區塊獲取週期。
成熟陸上盆地的地質複雜性
拉賈斯坦邦巴爾默爾山脈的儲存非均質性以及阿薩姆邦的裂隙碳酸鹽岩,使得多級水力壓裂和高密度垂直測井成為必要,鑽井成本比傳統油井高出一倍。印度油氣總局已將60多個滲透率低於1mD的探勘油田歸類為「緻密油」。儲存品質的不確定性增加了鑽井失敗的風險,迫使作業者在鑽井過程中預先採購完井設備,從而佔用資金並推高油田的損益平衡點。此外,在傑伊瑟爾梅爾等乾旱地區,壓裂作業用水的取得也需要加強環境監測。
細分市場分析
2025年,海上油田收入佔總收入的46.22%,但預計到2031年,由於深水回接計畫投資回收期縮短,海上油田收入將以6.32%的複合年成長率超過陸上油田。印度上游油氣市場規模(僅海上油田)預計將從2025年的74.3億美元成長到2031年的107.3億美元。同時,陸上油田雖然仍佔據重要地位,但由於大多數易採資源已被耗盡,預計其產量將趨於穩定,複合年成長率僅3.56%。
海上成長要素包括印度石油天然氣公司(ONGC)的KG-DWN-98/2叢集、信實工業(Reliance)和英國石油公司(BP)的MJ油田及其衛星油田開發項目,以及印度石油公司(Oil India)和巴西石油公司(Petrobras)在馬哈納迪盆地的合資項目。海底增壓幫浦、多相幫浦和長距離回接管道的應用正在降低單位生產成本,即使在水深超過1500公尺的情況下也是如此。潘納穆克塔塔普蒂(Panna Mukta Tapti)平台的退役表明監管機構有能力管理報廢責任,這鼓勵了那些關注報廢義務的新進入者。擁有成熟基礎設施的陸上油氣機會仍然具有吸引力,但嚴格的用水限制和土地使用權延遲可能會減緩近期成長。
儘管原油在2025年仍維持了67.45%的收入佔有率,但隨著天然氣產量成長以實現國家初級能源佔15%的目標,預計到2031年,天然氣相關收入將佔34.80%。根據「能源、環境和生活改善計畫」(HELP)獲得許可的富含天然氣的區塊將推動印度上游油氣市場規模(天然氣產業)在2025年達到52.3億美元,年複合成長率(CAGR)為6.88%。這一增速超過了石油業4.18%的成長率,反映了政策獎勵和脫碳進程的推動。
基礎建設,包括擴建全國天然氣管網和新建295座壓縮天然氣(CNG)加氣站,將確保天然氣需求穩定。天然氣生產商將可自由出售自2016年以來發現的高達6兆立方英尺(Tcf)的天然氣產量,從而避免傳統價格上限對收入的影響。同時,以石油為主的資產依賴於提高採收率(EOR)投資來限制減產,這增加了成本並限制了利潤成長。聯產氣貨幣化仍然是一個尚未充分利用的途徑,僅印度石油天然氣公司(ONGC)的孟買高地火炬回流計劃預計在完工後每天就能貢獻4億立方英尺(Bcf/d)的伴生氣,從而增強其均衡的油氣投資組合。
其他福利:
- Excel格式的市場預測(ME)表
- 分析師支持(3個月)
目錄
第1章 引言
- 研究假設和市場定義
- 調查範圍
第2章調查方法
第3章執行摘要
第4章 市場情勢
- 市場概覽
- 市場促進因素
- 國內產量下降推動了提高採收率投資
- 擴大OALP競標輪次和HELP獎勵
- 天然氣價格指數化改革改善了計劃經濟效益
- 印度大型IT公司主導油田數位轉型
- 市場限制
- 成熟陸上盆地的地質複雜性
- 冗長的環境和土地徵用核准程序
- 國內壓裂支撐劑供應短缺
- 供應鏈分析
- 技術展望
- 監管環境
- 原油產量和消費量預測
- 天然氣生產與消費預測
- 非傳統資源資本支出展望(緻密油、油砂、深水)
- 波特五力模型
- 新進入者的威脅
- 供應商的議價能力
- 買方的議價能力
- 替代品的威脅
- 競爭強度
- PESTEL 分析
第5章 市場規模與成長預測
- 按安裝位置
- 陸上
- 離岸
- 按資源類型
- 原油
- 天然氣
- 按井類型
- 傳統的
- 傳統型
- 透過服務
- 探勘
- 開發與生產
- 退休
第6章 競爭情勢
- 市場集中度
- 策略性舉措(併購、夥伴關係、購電協議)
- 市場佔有率分析(主要企業的市場排名和佔有率)
- 公司簡介
- Oil & Natural Gas Corporation
- Oil India Ltd
- Vedanta Ltd(Cairn O&G)
- Reliance Industries
- BP plc
- Hindustan Oil Exploration Co.
- Bharat PetroResources Ltd
- Essar Oil & Gas Exploration
- Adani Welspun Exploration
- Sun Petrochemicals
- GAIL(E&P)
- Shell India(BG Exploration)
- Joshi Technologies Int'l
- Deep Industries Ltd
- Jindal Drilling & Industries
- Larsen & Toubro Ltd(L&T)
- Hindustan Construction Co.
- Halliburton India
- Schlumberger India
- Baker Hughes India
第7章 市場機會與未來展望
The India Oil And Gas Upstream Market is expected to grow from USD 16.08 billion in 2025 to USD 16.87 billion in 2026 and is forecast to reach USD 21.47 billion by 2031 at 4.94% CAGR over 2026-2031.
Strong policy support, digital oilfield rollouts, and enhanced oil recovery (EOR) projects offset the drag from geological complexity, enabling operators to extract additional barrels from maturing assets and thereby slowing import growth. Capital is shifting toward deepwater prospects, where large discoveries can be tied back to existing infrastructure, while a wave of decommissioning contracts emerges as India's first generation of offshore platforms nears the end of their life. Private companies introduce agile drilling and completion technologies, yet state-owned enterprises retain strategic control through acreage holdings and legacy infrastructure. Supply-chain bottlenecks in rigs, proppants, and subsea equipment remain the principal operational headwinds but are gradually easing as domestic manufacturing expands under "Make in India" mandates.
India Oil And Gas Upstream Market Trends and Insights
Declining Domestic Output Spurring EOR Investments
National oil output fell from 36 million tonnes in FY2017 to 29.4 million tonnes in FY2024, creating a clear incentive for operators to deploy ASP, polymer, and miscible-gas flooding in mature reservoirs. Cairn Oil & Gas has earmarked USD 1 billion to retrofit its Rajasthan fields with full-field ASP, targeting a 15-20% uplift in recovery factors as per its April 2025 shareholder presentation. Pilot programs in Assam's Lakwa and Gujarat's Kalol fields recorded incremental gains of 4,000-6,000 barrels per day, demonstrating replicable gains across India's 430 mature fields. Operators now view EOR as a margin-accretive alternative to risky frontier exploration because most surface facilities are already in place, shortening payback periods to under four years.
Expansion of OALP Bid Rounds & HELP Incentives
The Hydrocarbon Exploration & Licensing Policy (HELP) has transitioned India from a cost-recovery production-sharing regime to a transparent revenue-sharing system, thereby eliminating audit disputes while granting full marketing freedom for gas. Since 2018, nine OALP rounds have cumulatively awarded 134 blocks and attracted work-program commitments worth USD 1.37 billion, according to the Directorate General of Hydrocarbons. Major industry players, such as BP and Eni, have pre-qualified for the upcoming Round X, enticed by unified license terms that cover both conventional and unconventional resources. The open-acreage model allows bidders to carve out prospect-specific polygons instead of waiting for government-curated bid maps, thereby accelerating acreage acquisition cycles.
Geological Complexity of Mature Onshore Basins
Reservoir heterogeneity in Rajasthan's Barmer-Hill and Assam's fractured carbonates requires multi-stage hydraulic fracturing and high-density vertical logging, which doubles drilling costs compared to vintage wells. The Directorate General of Hydrocarbons lists more than 60 prospects with permeability below 1 mD, classifying them as tight oil. Reservoir-quality uncertainty elevates failure risk and forces operators to pre-commit completion hardware while drilling, tying up capital and inflating field-level break-evens. Water sourcing for frac jobs also raises environmental scrutiny in arid districts such as Jaisalmer.
Other drivers and restraints analyzed in the detailed report include:
- Gas-Price Indexation Reforms Improving Project Economics
- Digital-Oilfield Adoption Led by Indian IT Majors
- Prolonged Environmental & Land-Acquisition Approvals
For complete list of drivers and restraints, kindly check the Table Of Contents.
Segment Analysis
Offshore fields delivered 46.22% of 2025 revenue, yet they are set to outpace onshore operations with a 6.32% CAGR through 2031 as deepwater tie-backs shorten payback periods. The India oil & gas upstream market size derived from offshore alone is projected to grow from USD 7.43 billion in 2025 to USD 10.73 billion by 2031. Meanwhile, the onshore domain, although still larger, faces a plateauing output at a 3.56% CAGR because most low-hanging resources have already been drained.
The offshore growth narrative is based on ONGC's KG-DWN-98/2 cluster, Reliance-BP's MJ and Satellite developments, and the collaboration between Oil India and Petrobras in the Mahanadi Basin. Sub-sea boosting, multiphase pumping, and long-tie-back pipelines reduce unit lifting costs, even in water depths exceeding 1,500 meters. Decommissioning of the Panna-Mukta-Tapti platforms also demonstrates the regulator's capacity to manage late-life liabilities, encouraging new entrants wary of end-of-life obligations. Onshore opportunities remain attractive where mature infrastructure exists; however, stringent water-use restrictions and land-access delays can dilute near-term growth.
Crude oil retained a 67.45% revenue share in 2025; however, natural-gas-linked revenue is expected to capture 34.80% by 2031 as gas output increases to meet the national goal of a 15% primary-energy share. Gas-rich blocks licensed under HELP contribute to an India oil & gas upstream market size of USD 5.23 billion in 2025 for gas, expanding at a 6.88% CAGR. This acceleration outpaces oil, which grows at 4.18%, mirroring policy incentives and lower carbon intensity.
Enabling infrastructure, including the National Gas Grid extension and 295 new CNG stations, creates offtake certainty. Gas producers enjoy marketing freedom for volumes up to 6 Tcf discovered post-2016, shielding returns from legacy price caps. Conversely, oil-focused assets rely on EOR spending to stem declines, adding cost layers that curb margin upside. Associated-gas monetization remains an under-exploited lever; ONGC's Mumbai High flare-back project alone could contribute 0.4 Bcf/d once completed, reinforcing balanced oil-gas portfolios.
The India Oil and Gas Upstream Market Report is Segmented by Location of Deployment (Onshore and Offshore), Resource Type (Crude Oil and Natural Gas), Well Type (Conventional and Unconventional), and Service (Exploration, Development and Production, and Decommissioning). The Market Sizes and Forecasts are Provided in Terms of Value (USD).
List of Companies Covered in this Report:
- Oil & Natural Gas Corporation
- Oil India Ltd
- Vedanta Ltd (Cairn O&G)
- Reliance Industries
- BP plc
- Hindustan Oil Exploration Co.
- Bharat PetroResources Ltd
- Essar Oil & Gas Exploration
- Adani Welspun Exploration
- Sun Petrochemicals
- GAIL (E&P)
- Shell India (BG Exploration)
- Joshi Technologies Int'l
- Deep Industries Ltd
- Jindal Drilling & Industries
- Larsen & Toubro Ltd (L&T)
- Hindustan Construction Co.
- Halliburton India
- Schlumberger India
- Baker Hughes India
Additional Benefits:
- The market estimate (ME) sheet in Excel format
- 3 months of analyst support
TABLE OF CONTENTS
1 Introduction
- 1.1 Study Assumptions & Market Definition
- 1.2 Scope of the Study
2 Research Methodology
3 Executive Summary
4 Market Landscape
- 4.1 Market Overview
- 4.2 Market Drivers
- 4.2.1 Declining domestic output spurring EOR investments
- 4.2.2 Expansion of OALP bid rounds & HELP incentives
- 4.2.3 Gas-price indexation reforms improving project economics
- 4.2.4 Digital-oilfield adoption led by Indian IT majors
- 4.3 Market Restraints
- 4.3.1 Geological complexity of mature onshore basins
- 4.3.2 Prolonged environmental & land-acquisition approvals
- 4.3.3 Shortage of fracking-grade domestic proppant supply
- 4.4 Supply-Chain Analysis
- 4.5 Technological Outlook
- 4.6 Regulatory Landscape
- 4.7 Crude-Oil Production & Consumption Outlook
- 4.8 Natural-Gas Production & Consumption Outlook
- 4.9 Unconventional Resources CAPEX Outlook (tight oil, oil sands, deep-water)
- 4.10 Porter's Five Forces
- 4.10.1 Threat of New Entrants
- 4.10.2 Bargaining Power of Suppliers
- 4.10.3 Bargaining Power of Buyers
- 4.10.4 Threat of Substitutes
- 4.10.5 Intensity of Rivalry
- 4.11 PESTLE Analysis
5 Market Size & Growth Forecasts
- 5.1 By Location of Deployment
- 5.1.1 Onshore
- 5.1.2 Offshore
- 5.2 By Resource Type
- 5.2.1 Crude Oil
- 5.2.2 Natural Gas
- 5.3 By Well Type
- 5.3.1 Conventional
- 5.3.2 Unconventional
- 5.4 By Service
- 5.4.1 Exploration
- 5.4.2 Development and Production
- 5.4.3 Decomissioning
6 Competitive Landscape
- 6.1 Market Concentration
- 6.2 Strategic Moves (M&A, Partnerships, PPAs)
- 6.3 Market Share Analysis (Market Rank/Share for key companies)
- 6.4 Company Profiles (includes Global level Overview, Market level overview, Core Segments, Financials as available, Strategic Information, Products & Services, and Recent Developments)
- 6.4.1 Oil & Natural Gas Corporation
- 6.4.2 Oil India Ltd
- 6.4.3 Vedanta Ltd (Cairn O&G)
- 6.4.4 Reliance Industries
- 6.4.5 BP plc
- 6.4.6 Hindustan Oil Exploration Co.
- 6.4.7 Bharat PetroResources Ltd
- 6.4.8 Essar Oil & Gas Exploration
- 6.4.9 Adani Welspun Exploration
- 6.4.10 Sun Petrochemicals
- 6.4.11 GAIL (E&P)
- 6.4.12 Shell India (BG Exploration)
- 6.4.13 Joshi Technologies Int'l
- 6.4.14 Deep Industries Ltd
- 6.4.15 Jindal Drilling & Industries
- 6.4.16 Larsen & Toubro Ltd (L&T)
- 6.4.17 Hindustan Construction Co.
- 6.4.18 Halliburton India
- 6.4.19 Schlumberger India
- 6.4.20 Baker Hughes India
7 Market Opportunities & Future Outlook
- 7.1 White-space & Unmet-need Assessment
 油氣中游設備市場:依設備類型、材質、應用、最終用途及通路分類-2026-2032年全球市場預測石油和天然氣資本支出市場:按資本支出類型、產品、流型、技術、終端用戶產業和地區分類-2026-2032年全球市場預測石油和天然氣工程服務市場:2026-2032年全球市場預測(按服務類型、計劃類型、合約類型、採用的技術、應用和最終用戶分類)
 2026年全球電池儲能EPC(工程、採購和施工)市場報告潛艦切割解決方案市場:依切割技術、服務類型、部署方式、動力來源、應用與最終用途分類-2026-2032年全球預測2026年全球上游油氣活動市場報告2026年全球油氣基礎設施市場報告2026年全球油氣支持活動市場報告2026年全球油氣計量儀器市場報告2026年全球真空瓦斯油市場報告