


 |
市場調查報告書
商品編碼
1906016
金屬包裝:市場佔有率分析、產業趨勢與統計、成長預測(2026-2031)Metal Packaging - Market Share Analysis, Industry Trends & Statistics, Growth Forecasts (2026 - 2031) |
||||||
※ 本網頁內容可能與最新版本有所差異。詳細情況請與我們聯繫。
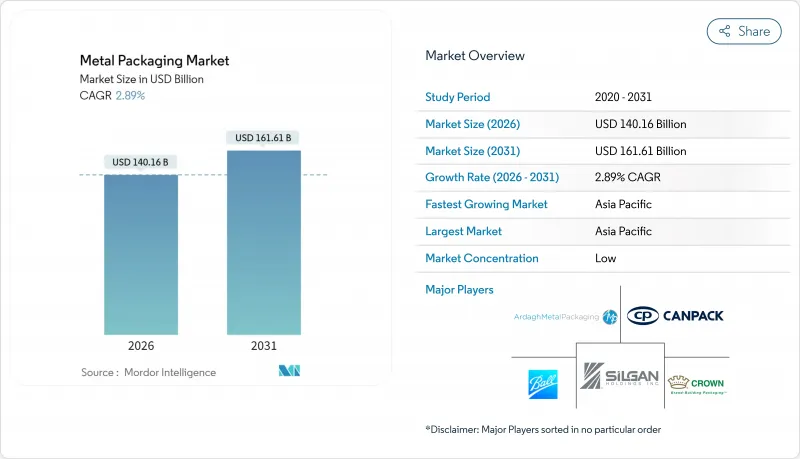
預計金屬包裝市場規模將從 2025 年的 1,362.2 億美元成長到 2026 年的 1,401.6 億美元,預計到 2031 年將達到 1,616.1 億美元,2026 年至 2031 年的複合年成長率為 2.89%。
這一穩步成長得益於循環經濟法規、即飲飲料的高階化以及零售商以金屬替代塑膠的努力。鋁材良好的回收經濟性,加上輕量化材料的進步以及品牌所有者提出的範圍3減排目標,正在鞏固金屬包裝市場作為碳酸飲料和機能飲料首選包裝的地位。製造商繼續透過長期合約和基於廢料的供應策略來規避鋁和鋼價格波動的風險。同時,塗料供應商正在加速向不含排放A(無BPA)的化學品轉型,以支持消費者的安全聲明。儘管競爭環境適中,但主要製罐製造商正在深化塗層、回收和數位印刷能力的垂直整合,以在這個成熟但充滿機會的市場環境中保護市場佔有率。
全球金屬包裝市場趨勢與洞察
對循環經濟的需求正在推動易拉罐回收。
日益嚴格的監管正在重塑價值鏈經濟格局,強制規定最低再生材料含量(鋁罐已達到此標準),並為金屬包裝市場帶來合規優勢。歐盟的《包裝廢棄物指令》(PPWR) 要求到 2030 年,飲料容器的再生材料含量必須達到 30%,而鋁罐的平均再生材料含量為 71%。押金返還計劃正推動回收率在 2029 年前達到 90%,從而確保可預測的廢料供應,並減少對原生金屬的依賴。像 Ball 這樣的全球製造商的目標是達到 85% 的再生材料含量,以增強閉合迴路效率,降低原料成本風險。澳洲也遵循歐盟法規,並推出了一項標準,要求到 2040 年,食品罐的消費後再生材料含量達到 80%。持續的監管勢頭正在鞏固鋁相對於 PET 的優勢,尤其是在飲料行業,因為循環性評分現在已被納入採購過程中的供應商競標評估。
新興亞洲的高級即飲飲料
亞太地區對高階罐裝飲料的強勁需求正在加速金屬包裝市場的成長。在日本,受消費者對低卡路里和含酒精飲料的需求推動,罐裝酒市場預計將在2018年至2023年間成長兩倍。朝日啤酒旗下的生啤酒(Nama Jockey)等品牌便是包裝創新如何將店內體驗帶入家庭環境的絕佳例證。中國和印度消費者可支配收入的成長正推動高階即飲咖啡、康普茶和功能性代餐飲料進入大眾零售市場,而這些產品都依賴罐裝來維持風味和保溫。優質化使製造商能夠將不斷上漲的原料成本轉嫁給消費者,從而在鋁價波動的情況下維持利潤率。
倫敦金屬交易所(LME)鋁和鋼鐵價格波動
能源價格波動導致的價格波動對金屬包裝市場的利潤率帶來壓力,因為該市場仍然依賴於滯後於現貨價格波動的轉嫁合約。北美關稅加劇了市場的複雜性,迫使生產商結合使用避險工具和區域採購來維持自身競爭力。歐洲冶煉廠面臨持續的能源成本壓力,加劇了全球價格波動。雖然大型企業可以透過廢料原料和多年期合約來抵消價格波動的影響,但小型冶煉廠仍然容易受到影響,這可能導致資本支出週期放緩。
細分市場分析
截至2025年,鋁將佔金屬包裝市場42.80%的佔有率,預計到2031年將以3.57%的複合年成長率成長,這主要得益於符合PPWR法規的閉合迴路回收系統的普及。鋼材仍將在大型食品容器和工業桶中佔據一席之地,但由於重量和能源效率的考慮,其成長速度將放緩。諾貝麗斯公司在英國投資9,000萬美元將其易拉罐回收能力翻倍的擴建計劃,凸顯了鋁材的戰略重要性。鋁材的輕量特性有助於減少物流排放,提升企業在環境、社會和治理(ESG)的排放,並增強消費者對飲料品牌的忠誠度。市場參與企業持續投資於重熔技術,推動了再生鋁金屬包裝市場規模的穩定成長。
與原生鋁相比,再生鋁的價格優勢有助於品牌控制原物料成本並降低採購風險。印度鋁業(Hindalco)100億美元的生產力計畫表明,一體化的冶煉和回收工廠如何縮短供應鏈並支持積極的再生材料含量目標。鋼鐵的磁性可回收性在混合廢棄物處理中仍然是一項優勢,但隨著碳排放稅的日益普及,容器重量的增加推高了運輸成本。總體而言,鋁的成本、循環性和重量優勢鞏固了其主導地位。同時,鋼鐵在一些注重機械強度和抗穿刺性的細分市場中也扮演著重要角色。
截至2025年,罐裝產品將佔金屬包裝市場41.12%的佔有率,預計在全球便利商店通路中,即飲咖啡、硬蘇打水和機能飲料的高階化趨勢推動下,罐裝產品將以6.08%的複合年成長率成長。波爾公司的Dynamark Advanced Pro可變圖形系統可實現大規模罐身個人化客製化,協助負責人提升消費者參與度,增強商店吸引力。食品罐市場保持穩定,為番茄醬、湯料和寵物食品等產品的全球貿易提供高阻隔保護。氣霧罐正在個人護理領域佔有一席之地,隨著疫情後新興市場需求的復甦,美髮造型產品、除臭劑和家用清潔劑劑等品類的需求正在成長。
輕量化舉措在不影響強度的前提下減少了單位鋁材的使用量,有助於控制成本並減少範圍3排放。瓶蓋、封蓋和旋蓋憑藉其防篡改功能和便利性,在細分市場中保持市場佔有率。散裝桶和中型鋼製容器在農業化學品和食用油行業仍然很受歡迎,因為在這些行業中,可重複使用性和聯合國運輸認證至關重要。這些趨勢鞏固了罐體作為金屬包裝市場主流產品的地位,而鄰近細分市場則透過材料科學和設計創新不斷發展。
區域分析
到2025年,亞太地區將佔全球金屬包裝市場38.21%的佔有率,並在2031年之前以5.89%的複合年成長率成長,這主要得益於中國即飲飲料行業的快速成長和印度中產階級的不斷壯大。本地生產的罐鋼供應,加上印度鋁業公司(Hindalco)數十億美元的冶煉廠和回收設施擴建計劃,不僅具有成本優勢,而且有助於循環經濟發展,因此吸引了全球品牌所有者的注意。日本透過出口高品質的雉海罐,展現了其在設計領域的領先地位,並影響著區域市場的發展趨勢。同時,東南亞國家正利用旅遊業帶來的飲料需求以及正在實施的押金返還試點項目,積極開拓市場。
北美市場已趨於成熟,與主要啤酒和軟性飲料灌裝商簽訂的長期供應協議確保了國內易拉罐生產線接近滿載運作。關稅迫使易拉罐製造商在國內採購金屬,從而推動了對廢鋼坯加工廠和倉庫自動化設施的投資,並降低了單位成本。各州完善的瓶罐法規使鋁回收率維持在60%以上,提高了二次生產所需原料的供應穩定性。
在歐洲,嚴格的PPWR(產品包裝廢棄物法規)要求與先進的回收網路相結合,為塗層創新和數位浮水印測試提供了試驗場。皇冠集團位於西班牙和義大利的可擴展工廠正在為精釀啤酒出口商增設高速生產線,這表明即使在飽和的市場中,仍然存在持續的成長機會。以巴西為首的南美洲市場需求正穩定成長,啤酒品牌紛紛轉向罐裝包裝,以提升優質化並簡化物流。
儘管中東和非洲地區在基礎設施方面落後,但人口成長和收入提高為新進入者打入氣霧劑除臭劑和罐頭食品市場創造了機會,全部區域必將為全球金屬包裝市場的成長做出貢獻。
其他福利:
- Excel格式的市場預測(ME)表
- 3個月的分析師支持
目錄
第1章 引言
- 研究假設和市場定義
- 調查範圍
第2章調查方法
第3章執行摘要
第4章 市場情勢
- 市場概覽
- 市場促進因素
- 循環經濟政策推動罐頭到罐頭的回收循環
- 亞洲新興市場即飲飲料的優質化
- 零售商對塑膠和金屬的承諾
- 與PET相比,較高的廢料回收率可降低實際成本。
- 利用罐內2D碼/NFC技術實現消費者資料貨幣化
- 電子商務和DTC飲料零售的擴張
- 市場限制
- 倫敦金屬交易所(LME)鋁和鋼鐵價格波動
- 品牌所有者對範圍 3 二氧化碳排放的強烈反對
- 單一材料紙瓶的興起
- 金屬包裝的高成本生產和營運成本
- 供應鏈分析
- 監管環境
- 技術展望
- 波特五力分析
- 供應商的議價能力
- 買方的議價能力
- 新進入者的威脅
- 替代品的威脅
- 競爭對手之間的競爭
- 地緣政治局勢如何影響市場
- 投資分析
第5章 市場規模與成長預測
- 依材料類型
- 鋁
- 鋼
- 依產品類型
- 能
- 罐頭食品
- 飲料罐
- 氣霧罐
- 散裝容器
- 桶和桶的運輸
- 瓶蓋和封口
- 能
- 按最終用戶行業分類
- 飲料
- 食物
- 化妝品和個人護理
- 家
- 其他終端用戶產業
- 按塗層/襯裡類型
- 含雙酚A的環氧樹脂
- BPA-NI環氧樹脂
- 聚酯/PET
- 其他塗層/襯裡類型
- 按貨櫃容量
- 少於250毫升
- 251-500 ml
- 501-1000 ml
- 1000毫升或更多
- 按地區
- 北美洲
- 美國
- 加拿大
- 墨西哥
- 歐洲
- 德國
- 英國
- 法國
- 義大利
- 西班牙
- 俄羅斯
- 其他歐洲地區
- 亞太地區
- 中國
- 印度
- 日本
- 韓國
- 澳洲和紐西蘭
- 亞太其他地區
- 中東和非洲
- 中東
- 阿拉伯聯合大公國
- 沙烏地阿拉伯
- 土耳其
- 其他中東地區
- 非洲
- 南非
- 奈及利亞
- 埃及
- 其他非洲地區
- 中東
- 南美洲
- 巴西
- 阿根廷
- 其他南美洲
- 北美洲
第6章 競爭情勢
- 市場集中度
- 策略趨勢
- 市佔率分析
- 公司簡介
- Ardagh Metal Packaging SA
- Ball Corporation
- Crown Holdings Inc.
- CANPACK SA
- Silgan Holdings Inc.
- Greif Inc.
- TUBEX Packaging GmbH
- Mauser Packaging Solutions
- Nampak Limited
- Colep Packaging
- CPMC Holdings Ltd.
- Toyo Seikan Group Holdings
- Amcor plc(Metal division)
- AptarGroup Inc.
- Alcoa Corporation
- Sherwin-Williams(Can Coatings)
- Novelis Inc.
- Hindalco Industries Ltd.
- RPC Group plc
- BWAY Corporation
- Berlin Packaging
第7章 市場機會與未來展望
The metal packaging market is expected to grow from USD 136.22 billion in 2025 to USD 140.16 billion in 2026 and is forecast to reach USD 161.61 billion by 2031 at 2.89% CAGR over 2026-2031.
Steady growth stems from circular-economy legislation, premiumisation of ready-to-drink beverages, and retailers' plastic-to-metal substitution pledges. Aluminium's superior recycling economics, combined with material-lightweighting advances and brand-owner scope-3 reduction targets, reinforce the metal packaging market as the default option for carbonated and functional beverages. Producers continue to hedge aluminium and steel price swings through long-term contracts and scrap-based supply strategies, while coating suppliers accelerate the shift to BPA-free chemistries that underpin consumer safety narratives. Competitive intensity remains moderate as the leading canmakers deepen vertical integration across coating, recycling, and digital printing capabilities to defend share in a mature yet opportunity-rich landscape.
Global Metal Packaging Market Trends and Insights
Circular-Economy Mandates Boost Can-to-Can Recycling Loops
Tighter legislation is reshaping value-chain economics by mandating minimum recycled-content thresholds that aluminium cans already exceed, giving the metal packaging market a compliance edge. The EU's PPWR requires 30% recycled material in beverage containers by 2030, yet aluminium cans average 71% recycled content. Deposit-return schemes are driving collection rates toward 90% by 2029, supporting predictable scrap flows and reducing virgin-metal dependency. Global producers such as Ball target 85% recycled content, reinforcing closed-loop efficiencies that temper raw-material cost risk. Australia mirrors EU rules with an 80% post-consumer threshold for food-grade cans by 2040.Sustained regulatory momentum cements aluminium's moat over PET, particularly in beverages where procurement now factors circularity scores into supplier bids.
Premiumization of RTD Beverages in Emerging Asia
Surging demand for premium canned drinks is accelerating the metal packaging market growth in Asia-Pacific. Japan's canned chuhai segment tripled in the United States between 2018 and 2023 as consumers seek low-calorie, low-alcohol options. Brands like Asahi's Nama Jokki can demonstrate how packaging innovations replicate on-premise experiences in at-home settings. Rising disposable incomes in China and India push premium RTD coffee, kombucha, and functional meal-replacement beverages into mainstream retail, all of which rely on cans for flavor protection and thermal performance. The premiumisation wave enables manufacturers to pass higher material costs through to consumers, sustaining margins despite aluminium volatility.
Price Volatility of LME Aluminium and Steel
Energy-driven price swings strain margins because the metal packaging market still relies on contracts with pass-through clauses that lag spot fluctuations. North American tariffs add complexity, forcing producers to blend hedging tools with regional sourcing to protect competitiveness.European smelters face persistent energy-cost pressure, contributing to global price turbulence. While large players offset volatility through scrap-based feedstocks and multi-year agreements, smaller converters remain exposed, which can slow capital investment cycles.
Other drivers and restraints analyzed in the detailed report include:
- Retailers' Plastic-to-Metal Substitution Pledges
- High Scrap Recovery Rates Lower True Cost vs. PET
- Brand-Owner Push-Back on Scope-3 CO2 Footprint
For complete list of drivers and restraints, kindly check the Table Of Contents.
Segment Analysis
Aluminium generated 42.80% of the metal packaging market share in 2025 and is projected to grow at a 3.57% CAGR through 2031, benefiting from closed-loop recycling systems that meet PPWR mandates. Steel maintains relevance in large-format food and industrial drums but grows more slowly due to weight and energy considerations. Novelis's USD 90 million UK expansion to double can-recycling capacity underscores the material's strategic importance. Aluminium's light weight reduces logistics emissions, aligning with ESG scorecards and deepening customer loyalty among beverage brands. Market participants continue to invest in remelt technology, enabling the metal packaging market size associated with secondary aluminium to expand steadily.
Secondary aluminium pricing advantages help brands manage raw-material costs relative to virgin metal, mitigating procurement risk. Hindalco's USD 10 billion capacity plan illustrates how integrated smelting and recycling hubs shorten supply chains and support aggressive recycled-content targets. Steel's magnetic recoverability remains a plus in mixed-waste streams, yet higher container weight raises transport costs as carbon taxes spread. Altogether, aluminium's cost, circularity, and weight advantages cement its leadership position, even as steel serves resilient niches that prioritize mechanical strength and puncture resistance.
Cans represented 41.12% of the metal packaging market in 2025 and are set to grow at a 6.08% CAGR, propelled by the premiumisation of RTD coffee, hard seltzer, and functional beverages across global convenience channels. Ball's Dynamark Advanced Pro variable-graphics system personalizes cans at scale, allowing marketers to boost engagement and shelf appeal. Food cans hold a stable base, supplying high-barrier protection that underwrites global trade in tomato paste, soups, and pet food. Aerosol cans tap personal-care growth as pent-up post-pandemic demand lifts hair styling, deodorant, and household-cleaning categories in emerging markets.
Light-weighting initiatives reduce aluminium per unit without compromising integrity, helping contain costs and shrink scope-3 footprints. Caps, closures, and lug lids maintain niche relevance by providing tamper evidence and convenience. Bulk drums and intermediate steel containers retain popularity for agrochemicals and edible oils, where reusability and UN transport certifications are critical. Collectively, these dynamics guarantee that cans remain the metal packaging market's flagship product while ancillary segments evolve through material science and design innovation.
The Metal Packaging Market Report is Segmented by Material Type (Aluminum, Steel), Product Type (Bulk Containers, Shipping Barrels and Drums, Caps and Closures, and More), End-User Industry (Beverage, Food, and More), Coating/Lining Type (BPA-Based Epoxy, BPA-NI Epoxy and More), Container Capacity (less Than 250 Ml, 251-500, and More), Geography (North America, and More). The Market Forecasts are Provided in Terms of Value (USD).
Geography Analysis
Asia-Pacific held 38.21% of the metal packaging market in 2025 and is tracking a 5.89% CAGR through 2031, anchored by China's burgeoning RTD sector and India's rising middle class. Localised can-sheet supply, combined with Hindalco's multi-billion-dollar smelter-plus-recycling build-out, underpins cost leadership and circular credentials that appeal to global brand owners. Japan contributes design leadership, exporting high-quality chuhai formats that influence regional adoption patterns, while Southeast Asian nations leverage tourism-driven beverage demand and emerging deposit-return pilots.
North America represents a mature arena where domestic can lines run near full utilisation, cushioned by long-term supply contracts with major beer and soft-drink fillers. Tariff regimes compel canmakers to source metal domestically, spurring investment in scrap-based billet facilities and warehouse automation to drive down per-unit costs. Widespread state-level bottle bills keep aluminium recovery rates above 60%, bolstering feedstock security for secondary production.
Europe combines rigorous PPWR requirements with sophisticated recycling networks, making it a crucible for coating innovations and digital watermark pilots. Crown's scalable plants in Spain and Italy recently added high-speed lines to serve craft-beer exporters, evidencing sustained opportunity even within a saturated market. South America, spearheaded by Brazil, exhibits strong volume growth as beer brand owners convert to cans for premium positioning and logistics efficiency.
The Middle East and Africa trail on infrastructure, yet population expansion and rising incomes provide greenfield prospects for aerosol deodorant and canned-food penetration, ensuring region-wide growth contributions to the global metal packaging market.
- Ardagh Metal Packaging S.A.
- Ball Corporation
- Crown Holdings Inc.
- CANPACK S.A.
- Silgan Holdings Inc.
- Greif Inc.
- TUBEX Packaging GmbH
- Mauser Packaging Solutions
- Nampak Limited
- Colep Packaging
- CPMC Holdings Ltd.
- Toyo Seikan Group Holdings
- Amcor plc (Metal division)
- AptarGroup Inc.
- Alcoa Corporation
- Sherwin-Williams (Can Coatings)
- Novelis Inc.
- Hindalco Industries Ltd.
- RPC Group plc
- BWAY Corporation
- Berlin Packaging
Additional Benefits:
- The market estimate (ME) sheet in Excel format
- 3 months of analyst support
TABLE OF CONTENTS
1 INTRODUCTION
- 1.1 Study Assumptions and Market Definition
- 1.2 Scope of the Study
2 RESEARCH METHODOLOGY
3 EXECUTIVE SUMMARY
4 MARKET LANDSCAPE
- 4.1 Market Overview
- 4.2 Market Drivers
- 4.2.1 Circular-economy mandates boost can-to-can recycling loops
- 4.2.2 Premiumisation of RTD beverages in emerging Asia
- 4.2.3 Retailers' plastic-to-metal substitution pledges
- 4.2.4 High scrap recovery rates lower true cost vs. PET
- 4.2.5 In-can QR/NFC tech unlocking consumer-data monetisation
- 4.2.6 Expansion of e-commerce and DTC beverage retailing
- 4.3 Market Restraints
- 4.3.1 Price volatility of LME aluminium and steel
- 4.3.2 Brand-owner push-back on scope-3 CO? footprint
- 4.3.3 Rise of mono-material paper bottles
- 4.3.4 High production and operational costs of metal packaging
- 4.4 Supply-Chain Analysis
- 4.5 Regulatory Landscape
- 4.6 Technological Outlook
- 4.7 Porter's Five Forces Analysis
- 4.7.1 Bargaining Power of Suppliers
- 4.7.2 Bargaining Power of Buyers
- 4.7.3 Threat of New Entrants
- 4.7.4 Threat of Substitutes
- 4.7.5 Intensity of Competitive Rivalry
- 4.8 Impact of Geopolitical Scenario on the Market
- 4.9 Investment Analysis
5 MARKET SIZE AND GROWTH FORECASTS (VALUE)
- 5.1 By Material Type
- 5.1.1 Aluminium
- 5.1.2 Steel
- 5.2 By Product Type
- 5.2.1 Cans
- 5.2.1.1 Food Cans
- 5.2.1.2 Beverage Cans
- 5.2.1.3 Aerosol Cans
- 5.2.2 Bulk Containers
- 5.2.3 Shipping Barrels and Drums
- 5.2.4 Caps and Closures
- 5.2.1 Cans
- 5.3 By End-user Industry
- 5.3.1 Beverage
- 5.3.2 Food
- 5.3.3 Cosmetics and Personal Care
- 5.3.4 Household
- 5.3.5 Other End-user Industry
- 5.4 By Coating / Lining Type
- 5.4.1 BPA-Based Epoxy
- 5.4.2 BPA-NI Epoxy
- 5.4.3 Polyester / PET
- 5.4.4 Other Coating / Lining Type
- 5.5 By Container Capacity
- 5.5.1 Less than 250 ml
- 5.5.2 251 - 500 ml
- 5.5.3 501 - 1000 ml
- 5.5.4 More than 1000 ml
- 5.6 By Geography
- 5.6.1 North America
- 5.6.1.1 United States
- 5.6.1.2 Canada
- 5.6.1.3 Mexico
- 5.6.2 Europe
- 5.6.2.1 Germany
- 5.6.2.2 United Kingdom
- 5.6.2.3 France
- 5.6.2.4 Italy
- 5.6.2.5 Spain
- 5.6.2.6 Russia
- 5.6.2.7 Rest of Europe
- 5.6.3 Asia-Pacific
- 5.6.3.1 China
- 5.6.3.2 India
- 5.6.3.3 Japan
- 5.6.3.4 South Korea
- 5.6.3.5 Australia and New Zealand
- 5.6.3.6 Rest of Asia-Pacific
- 5.6.4 Middle East and Africa
- 5.6.4.1 Middle East
- 5.6.4.1.1 United Arab Emirates
- 5.6.4.1.2 Saudi Arabia
- 5.6.4.1.3 Turkey
- 5.6.4.1.4 Rest of Middle East
- 5.6.4.2 Africa
- 5.6.4.2.1 South Africa
- 5.6.4.2.2 Nigeria
- 5.6.4.2.3 Egypt
- 5.6.4.2.4 Rest of Africa
- 5.6.4.1 Middle East
- 5.6.5 South America
- 5.6.5.1 Brazil
- 5.6.5.2 Argentina
- 5.6.5.3 Rest of South America
- 5.6.1 North America
6 COMPETITIVE LANDSCAPE
- 6.1 Market Concentration
- 6.2 Strategic Moves
- 6.3 Market Share Analysis
- 6.4 Company Profiles (includes Global level Overview, Market level overview, Core Segments, Financials as available, Strategic Information, Market Rank/Share for key companies, Products and Services, and Recent Developments)
- 6.4.1 Ardagh Metal Packaging S.A.
- 6.4.2 Ball Corporation
- 6.4.3 Crown Holdings Inc.
- 6.4.4 CANPACK S.A.
- 6.4.5 Silgan Holdings Inc.
- 6.4.6 Greif Inc.
- 6.4.7 TUBEX Packaging GmbH
- 6.4.8 Mauser Packaging Solutions
- 6.4.9 Nampak Limited
- 6.4.10 Colep Packaging
- 6.4.11 CPMC Holdings Ltd.
- 6.4.12 Toyo Seikan Group Holdings
- 6.4.13 Amcor plc (Metal division)
- 6.4.14 AptarGroup Inc.
- 6.4.15 Alcoa Corporation
- 6.4.16 Sherwin-Williams (Can Coatings)
- 6.4.17 Novelis Inc.
- 6.4.18 Hindalco Industries Ltd.
- 6.4.19 RPC Group plc
- 6.4.20 BWAY Corporation
- 6.4.21 Berlin Packaging
7 MARKET OPPORTUNITIES AND FUTURE OUTLOOK
- 7.1 White-space and Unmet-need Assessment
 金屬包裝市場:依產品類型、材料類型、塗層類型、產品設計、生產技術和最終用途產業分類-2026-2032年全球預測
 泰國金屬包裝:市場佔有率分析、產業趨勢與統計、成長預測(2026-2031)
 2026-2030年全球輕量化金屬包裝市場
 金屬包裝市場規模、佔有率及成長分析(依產品類型、材料、應用及地區分類)-2026-2033年產業預測
 全球金屬包裝市場預測(至2032年):按產品類型、材質、最終用戶和地區分類的分析
 金屬包裝市場:依材料、產品類型、最終用途產業及地區分類
 2025-2033年金屬包裝市場報告(依產品類型、材料、應用和地區)乳製品金屬包裝市場按容器類型、材料類型、封蓋類型、應用和分銷管道分類 - 全球預測 2025-2030
 全球金屬包裝市場:市場規模、佔有率、趨勢分析(按材料、產品類型、最終用途和地區)、細分市場預測(2025-2030 年)印度金屬包裝:市場佔有率分析、行業趨勢和成長預測(2025-2030 年)