


 |
市場調查報告書
商品編碼
1905996
石油煉製:市場佔有率分析、產業趨勢與統計、成長預測(2026-2031)Oil Refining - Market Share Analysis, Industry Trends & Statistics, Growth Forecasts (2026 - 2031) |
||||||
※ 本網頁內容可能與最新版本有所差異。詳細情況請與我們聯繫。
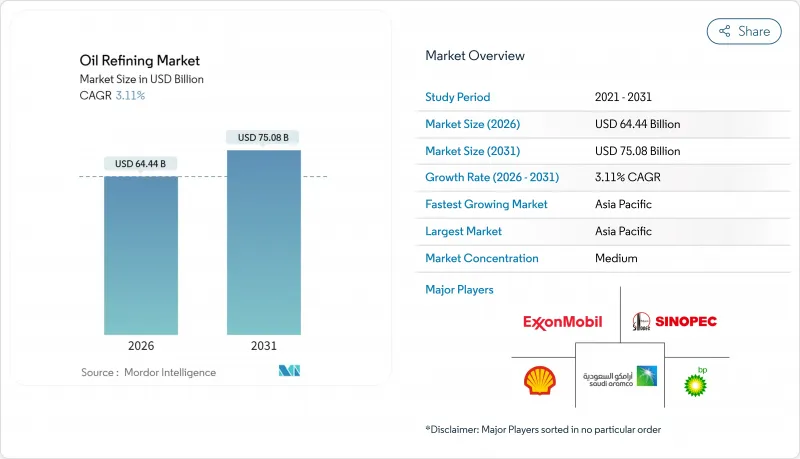
2025 年石油煉製市場價值 625 億美元,預計從 2026 年的 644.4 億美元成長到 2031 年的 750.8 億美元,預測期(2026-2031 年)複合年成長率為 3.11%。
這一成長軌跡主要得益於加速推進石化一體化、大規模脫硫維修以及可再生柴油平台,這些措施有助於在汽油需求疲軟的情況下保障利潤率。那些結合深度轉化、數位最佳化和多元化燃料組合的營運商持續表現優異,而那些依賴單一燃料經濟性或缺乏原料柔軟性的煉油廠則面臨關閉或轉型為特殊用途。亞太、中東和部分非洲市場的煉油產能新增最為強勁,這些地區的政府正大力支持下游產業的自給自足和出口目標。同時,經合組織國家的合理化改革以及缺乏與環境、社會和治理(ESG)相關的資本,限制了已開發地區的新建設,加劇了全球對優質原油和穩定裂解價差的競爭。
全球煉油市場趨勢與洞察
亞洲對石化原料需求的成長推動了轉化設施的升級改造。
亞洲煉油廠正透過整合催化裂解裝置和聚丙烯生產線,朝向價值鏈上游邁進。中國海洋石油總公司(中海油)寧波煉廠的升級改造,每年新增45萬噸聚丙烯產能,原油加工能力提升50%,使其能滿足國內強勁的化工產品需求。印度也在進行類似的投資,目標是到2030年新增3,500萬至4,000萬噸產能。石腦油將被轉用於芳烴和烯烴的生產。產業整合正在獲取更高的石化產品價差,這有助於抵禦電動車帶來的利潤侵蝕,並支撐整個煉油市場的長期獲利能力。
IMO 2020 新規實施後,低硫船用燃料亟需維修改造
硫含量上限持續重塑著人們對燃油品質的預期。埃克森美孚在弗利(Foley)的投資項目包括一套加氫處理裝置,該裝置每年將生產5.7億加侖低硫柴油。內陸煉油廠也正在維修脫硫裝置,以供應更高品質的船用燃料,從而擴大供應基礎並改善套利機會。持續流入的監管升級資金正在增強對氫氣和催化系統的需求,維持產能柔軟性,並為石油煉製市場提供支援。
經合組織國家在淨零排放目標下的煉油廠合理化
在歐洲和北美,隨著企業調整經營策略以適應氣候政策,一些老舊煉油廠正在關閉或改造。道達爾能源公司正在將格蘭德普伊煉油廠改造成一個零原油平台,用於生產永續航空燃料和生物聚合物。殼牌公司將於2025年前停止韋瑟林煉油廠的原油加工,並轉型生產基礎油。這些措施將收緊區域供應,提高剩餘煉油廠的運轉率,並重塑成品油進口格局,但同時也限制了煉油市場的產能擴張。
細分市場分析
2025年,中餾分油在成品油市場中將維持37.12%的佔有率,這主要得益於噴射機燃料和柴油市場的復甦,而航空煤油和柴油市場的復甦又受到新興市場全球旅行需求和貨運量復甦的推動。輕餾分油持續受惠於開發中國家汽車保有量的成長,但在成熟市場則面臨結構性下滑。重油受到航運和發電業監管趨嚴的影響,促使企業投資焦化和加氫裂解裝置以提升殘渣油的品質。預計石化原料領域將以3.85%的複合年成長率實現最高增速,這主要得益於一體化運營商將石腦油和液化石油氣轉化為高利潤聚合物產品鏈。向化工領域的轉型正在推動利潤率的穩定,並支撐成品油市場收入基礎的擴大。
高度一體化提高了裝置的複雜性,增強了原油加工的柔軟性,並實現了更多樣化的產品組合。中國海洋石油總公司(中海油)寧波聚丙烯項目的擴建以及殼牌公司計劃於2028年在海州擴建的項目,凸顯了以化工為中心運營的趨勢。這些計劃擴大了高轉換率煉油設備的市場規模,並保障了電動車取代汽油需求所造成的收入損失。
石油煉製市場報告按產品組合(輕質餾分油、中質餾分油、燃料油及殘渣、石化原料)、所有權類型(國家石油公司、綜合石油公司、獨立/公司煉油商)和地區(北美、歐洲、亞太、南美、中東和非洲)進行細分。市場規模和預測以美元計價。
區域分析
亞太地區的煉油擴張鞏固了其主導地位。中國海洋石油總公司(中海油)投資27.4億美元擴建寧波煉油廠,將使原油加工能力提升至每日24萬桶,並新增聚丙烯產能以滿足國內塑膠需求。印度計畫新增19兆至22兆印度盧比的煉油產能,將支撐其以4%年複合成長率成長的消費需求。在東南亞,越南和印尼正在推動旨在減少對成品油進口依賴的新計畫,而日本和韓國則專注於提高營運效率和技術出口。該地區的一體化模式和政府支持將繼續推動其煉油市場的擴張。
北美仍然是重要的出口地區。頁岩輕質原油供應降低了美國墨西哥灣沿岸煉油廠的原料成本。菲利普斯66公司位於斯威尼的煉油廠升級改造後,能夠靈活運營,優先生產汽油和化學原料。瓦萊羅能源公司正在投資54億美元用於低碳計劃,包括可再生柴油,以平衡排放目標和獲利能力。在加拿大和墨西哥競相在政策轉變中實現煉油廠現代化之際,美國憑藉著豐富的原料和深水物流網路,在煉油市場保持結構性優勢。
歐洲正經歷最快速的結構性變革。道達爾能源公司正將其位於格蘭德普伊的煉油廠改造為可再生能源中心。殼牌公司正在對其韋瑟林煉油廠進行改造,減少傳統產能,同時增加永續航空燃料和基礎油的生產。碳定價提高了重質燃料的營運成本,推動了裝置改造和氫能的整合。煉油廠關閉造成的供應限制導致從中東和美國的進口量增加,促進了跨大西洋貿易,並擴大了煉油廠市場中倖存煉油廠之間的競爭差距。
其他福利:
- Excel格式的市場預測(ME)表
- 3個月的分析師支持
目錄
第1章 引言
- 研究假設和市場定義
- 調查範圍
第2章調查方法
第3章執行摘要
第4章 市場情勢
- 市場概覽
- 市場促進因素
- 亞洲對石化原料的需求不斷成長,推動了轉化設施的升級改造。
- IMO 2020新規實施後,低硫船用燃料將引發一波維修
- 透過對中東國家石油公司的下游整合來獲得下游利潤
- 美國輕質油繁榮推動冷凝油分離器投資
- 俄羅斯烏拉爾原油價格下跌提振歐洲煉油廠利潤率。
- 經合組織國家的可再生柴油協同加工獎勵措施增加了加氫處理支出
- 市場限制
- 經合組織國家在淨零排放目標下的煉油廠合理化
- 新建工廠所需的ESG主導資本日益短缺
- 不穩定的裂解價格上漲會削弱煉油廠的資本報酬率。
- 透過碳定價壓縮重油利潤率
- 供應鏈分析
- 技術展望
- 監理展望
- 波特五力模型
- 供應商的議價能力
- 買方的議價能力
- 新進入者的威脅
- 替代品的威脅
- 競爭對手之間的競爭
第5章 市場規模與成長預測
- 按產品配置
- 輕質餾分油(汽油、石腦油)
- 中間餾分油(瓦斯油/柴油、航空煤油/煤油)
- 燃料油和殘渣
- 石油化學原料(丙烯、芳烴化合物)
- 所有權
- 國家石油公司(NOC)
- 綜合石油公司(IOC)
- 獨立/公司煉油商
- 按地區
- 北美洲
- 美國
- 加拿大
- 墨西哥
- 歐洲
- 英國
- 德國
- 法國
- 西班牙
- 北歐國家
- 俄羅斯
- 其他歐洲地區
- 亞太地區
- 中國
- 印度
- 日本
- 韓國
- 馬來西亞
- 泰國
- 印尼
- 越南
- 澳洲
- 亞太其他地區
- 南美洲
- 巴西
- 阿根廷
- 哥倫比亞
- 其他南美洲
- 中東和非洲
- 阿拉伯聯合大公國
- 沙烏地阿拉伯
- 南非
- 埃及
- 其他中東和非洲地區
- 北美洲
第6章 競爭情勢
- 市場集中度
- 策略性舉措(併購、聯盟、購電協議)
- 市場佔有率分析(主要企業的市場排名和佔有率)
- 公司簡介
- Exxon Mobil Corporation
- Sinopec Corp.
- Shell plc
- Saudi Aramco
- BP plc
- Chevron Corporation
- Valero Energy Corp.
- Marathon Petroleum Corp.
- Phillips 66
- Indian Oil Corporation Ltd.
- Rosneft PJSC
- CNPC
- TotalEnergies SE
- PKN Orlen SA
- Petrobras SA
- ENOC
- Reliance Industries Ltd.
- Petron Corp.
- PETRONAS
- Bharat Petroleum Corporation Limited
第7章 市場機會與未來展望
The Oil Refining Market was valued at USD 62.5 billion in 2025 and estimated to grow from USD 64.44 billion in 2026 to reach USD 75.08 billion by 2031, at a CAGR of 3.11% during the forecast period (2026-2031).
This forward trajectory stems from refiners' accelerated push into petrochemical integration, large-scale desulfurization retrofits, and renewable diesel platforms that help shield margins from soft gasoline demand. Operators that combine conversion depth, digital optimization, and diversified fuel slates continue to outperform, while plants locked into single-fuel economics or lacking feedstock flexibility are closing or converting to specialty uses. Refinery throughput growth remains strongest in the Asia-Pacific, the Middle East, and select African markets, where governments support downstream self-sufficiency and export ambitions. Simultaneously, OECD rationalization and ESG-linked capital scarcity limit green-field build in developed regions, intensifying the global contest for high-quality barrels and resilient cracks.
Global Oil Refining Market Trends and Insights
Petro-chemical feed-stock push in Asia bolstering conversion upgrades
Asia's refiners integrate catalytic crackers and polypropylene lines to move up the value chain. CNOOC's Ningbo upgrade added 450,000 tpy polypropylene capacity and lifted crude runs by 50%, giving the complex access to robust domestic chemical demand. Similar investments in India aim to target 35-40 million tonnes of new capacity by 2030, with naphtha being directed to aromatic and olefin chains. Integration protects margins from erosion driven by electric vehicles, while capturing higher petrochemical spreads that underpin long-term earnings resilience across the oil refining market.
Low-sulfur marine fuels post-IMO 2020 triggering desulfurization retrofits
The sulfur cap continues to reshape fuel quality expectations. ExxonMobil's Fawley investment includes a hydrotreater that produces 570 million gallons of low-sulfur diesel annually. Inland refiners also retrofit desulfurizers to supply premium bunker fuel, expanding geographic supply and improving arbitrage options. Sustained capital inflows toward compliance upgrades reinforce demand for hydrogen and catalyst systems, sustaining throughput flexibility and supporting the oil refining market.
OECD refinery rationalisation under net-zero targets
Europe and North America are closing or repurposing older plants as firms align with climate policies. TotalEnergies is converting Grandpuits into a zero-crude platform producing sustainable aviation fuel and biopolymers. Shell will end crude runs at Wesseling by 2025, shifting to base oils. These actions tighten regional supply, elevate utilization at surviving sites, and reshape product import patterns, yet cap capacity growth within the oil refining market.
Other drivers and restraints analyzed in the detailed report include:
- Middle-East NOCs' forward integration capturing downstream margins
- U.S. light-tight oil boom driving condensate splitter investments
- Rising ESG-driven capital scarcity for green-field plants
For complete list of drivers and restraints, kindly check the Table Of Contents.
Segment Analysis
Middle distillates retained a 37.12% oil refining market share in 2025, as jet fuel and diesel recovered alongside global travel and emerging-market freight. Light distillates continue to benefit from rising vehicle ownership in developing economies, yet face structural declines in mature regions. Heavy fuel oil struggles with stricter marine and power regulations, prompting investments in cokers and hydrocrackers to upgrade residues. The petrochemical feedstock category grows at the fastest rate, with a 3.85% CAGR, as integrated operators channel naphtha and LPG into high-margin polymer chains. The chemicals pivot enhances margin stability and supports a broader revenue base within the oil refining market.
Greater integration increases unit complexity, enhancing crude flexibility and enabling the selection of a diverse slate. CNOOC's polypropylene addition in Ningbo and Shell's Huizhou expansion, scheduled for 2028, highlight the trend toward operations centered on chemicals. Such projects expand the oil refining market size for high-conversion assets and shield earnings from gasoline displacement by electric vehicles.
The Oil Refining Market Report is Segmented by Product Slate (Light Distillates, Middle Distillates, Fuel Oil and Residuals, and Petro-Chemical Feed-Stocks), Ownership (National Oil Companies, Integrated Oil Companies, and Independent/Merchant Refiners), and Geography (North America, Europe, Asia-Pacific, South America, and Middle East and Africa). The Market Size and Forecasts are Provided in Terms of Revenue (USD).
Geography Analysis
Asia-Pacific's refining complex expansion underpins its leadership. CNOOC's USD 2.74 billion Ningbo upgrade lifted crude runs to 240,000 bpd, adding polypropylene units to meet domestic plastics demand. India's planned capacity builds worth INR 1.9-2.2 lakh crore support sustained supply as consumption expands at 4% CAGR. Southeast Asia is seeing new projects in Vietnam and Indonesia aimed at reducing product import dependence, while Japan and South Korea are focusing on high-efficiency operations and technology exports. The region's integrated models and government backing continue to enlarge the oil refining market.
North America remains a pivotal exporter. Shale-driven light crude availability reduces feedstock costs for Gulf Coast refineries. Phillips 66's Sweeny upgrades allow flexible runs that favor gasoline and chemical feedstock production. Valero channels USD 5.4 billion into low-carbon projects, including renewable diesel, to balance emissions objectives with margin capture. Canada and Mexico vie to modernize their assets amid policy shifts, yet the U.S. maintains a structural advantage in the oil refining market through its abundant feedstocks and deepwater logistics networks.
Europe experiences the fastest structural change. TotalEnergies converts Grandpuits to a renewable platform, while Shell repurposes Wesseling, removing conventional capacity yet adding sustainable aviation and base-oil output. Carbon pricing increases operating costs for heavy-fuel streams, incentivizing the conversion of units and the integration of hydrogen. Supply tightness from closures increases imports from the Middle East and the United States, elevating trans-Atlantic trade and reinforcing competitiveness gaps among surviving plants within the oil refining market.
- Exxon Mobil Corporation
- Sinopec Corp.
- Shell plc
- Saudi Aramco
- BP plc
- Chevron Corporation
- Valero Energy Corp.
- Marathon Petroleum Corp.
- Phillips 66
- Indian Oil Corporation Ltd.
- Rosneft PJSC
- CNPC
- TotalEnergies SE
- PKN Orlen SA
- Petrobras SA
- ENOC
- Reliance Industries Ltd.
- Petron Corp.
- PETRONAS
- Bharat Petroleum Corporation Limited
Additional Benefits:
- The market estimate (ME) sheet in Excel format
- 3 months of analyst support
TABLE OF CONTENTS
1 Introduction
- 1.1 Study Assumptions & Market Definition
- 1.2 Scope of the Study
2 Research Methodology
3 Executive Summary
4 Market Landscape
- 4.1 Market Overview
- 4.2 Market Drivers
- 4.2.1 Petro-chemical feed-stock push in Asia bolstering conversion upgrades
- 4.2.2 Low-sulfur marine fuels post-IMO 2020 triggering desulfurization retrofit wave
- 4.2.3 Middle-East NOCs' forward integration capturing downstream margins
- 4.2.4 U.S. light-tight oil boom driving condensate-splitter investments
- 4.2.5 Discounted Russian Urals stimulating European complex refinery margins
- 4.2.6 Renewable diesel co-processing incentives in OECD raising hydro-treating spend
- 4.3 Market Restraints
- 4.3.1 OECD refinery rationalization under net-zero targets
- 4.3.2 Rising ESG-driven capital scarcity for green-field plants
- 4.3.3 Volatile crack?spreads eroding ROCE for merchant refiners
- 4.3.4 Carbon-pricing schemes compressing heavy-fuel margins
- 4.4 Supply-Chain Analysis
- 4.5 Technological Outlook
- 4.6 Regulatory Outlook
- 4.7 Porter's Five Forces
- 4.7.1 Bargaining Power of Suppliers
- 4.7.2 Bargaining Power of Buyers
- 4.7.3 Threat of New Entrants
- 4.7.4 Threat of Substitutes
- 4.7.5 Competitive Rivalry
5 Market Size & Growth Forecasts
- 5.1 By Product Slate
- 5.1.1 Light Distillates (Gasoline, Naphtha)
- 5.1.2 Middle Distillates (Diesel/Gasoil, Jet/Kero)
- 5.1.3 Fuel Oil and Residuals
- 5.1.4 Petro-chemical Feed-stocks (Propylene, Aromatics)
- 5.2 By Ownership
- 5.2.1 National Oil Companies (NOCs)
- 5.2.2 Integrated Oil Companies (IOCs)
- 5.2.3 Independent/Merchant Refiners
- 5.3 By Geography
- 5.3.1 North America
- 5.3.1.1 United States
- 5.3.1.2 Canada
- 5.3.1.3 Mexico
- 5.3.2 Europe
- 5.3.2.1 United Kingdom
- 5.3.2.2 Germany
- 5.3.2.3 France
- 5.3.2.4 Spain
- 5.3.2.5 Nordic Countries
- 5.3.2.6 Russia
- 5.3.2.7 Rest of Europe
- 5.3.3 Asia-Pacific
- 5.3.3.1 China
- 5.3.3.2 India
- 5.3.3.3 Japan
- 5.3.3.4 South Korea
- 5.3.3.5 Malaysia
- 5.3.3.6 Thailand
- 5.3.3.7 Indonesia
- 5.3.3.8 Vietnam
- 5.3.3.9 Australia
- 5.3.3.10 Rest of Asia-Pacific
- 5.3.4 South America
- 5.3.4.1 Brazil
- 5.3.4.2 Argentina
- 5.3.4.3 Colombia
- 5.3.4.4 Rest of South America
- 5.3.5 Middle East and Africa
- 5.3.5.1 United Arab Emirates
- 5.3.5.2 Saudi Arabia
- 5.3.5.3 South Africa
- 5.3.5.4 Egypt
- 5.3.5.5 Rest of Middle East and Africa
- 5.3.1 North America
6 Competitive Landscape
- 6.1 Market Concentration
- 6.2 Strategic Moves (M&A, Partnerships, PPAs)
- 6.3 Market Share Analysis (Market Rank/Share for key companies)
- 6.4 Company Profiles (includes Global level Overview, Market level overview, Core Segments, Financials as available, Strategic Information, Products & Services, and Recent Developments)
- 6.4.1 Exxon Mobil Corporation
- 6.4.2 Sinopec Corp.
- 6.4.3 Shell plc
- 6.4.4 Saudi Aramco
- 6.4.5 BP plc
- 6.4.6 Chevron Corporation
- 6.4.7 Valero Energy Corp.
- 6.4.8 Marathon Petroleum Corp.
- 6.4.9 Phillips 66
- 6.4.10 Indian Oil Corporation Ltd.
- 6.4.11 Rosneft PJSC
- 6.4.12 CNPC
- 6.4.13 TotalEnergies SE
- 6.4.14 PKN Orlen SA
- 6.4.15 Petrobras SA
- 6.4.16 ENOC
- 6.4.17 Reliance Industries Ltd.
- 6.4.18 Petron Corp.
- 6.4.19 PETRONAS
- 6.4.20 Bharat Petroleum Corporation Limited
7 Market Opportunities & Future Outlook
- 7.1 White-space & Unmet-Need Assessment
 煉油和石化過濾市場:2026-2032年全球市場預測(按應用、過濾介質介質、過濾技術、設備類型和最終用途行業分類)
 全球石油煉製市場規模、佔有率、趨勢和成長分析報告(2026-2034)
 2026年全球煉油和石化過濾器市場報告煉油製程添加劑市場按類型、原料、應用和最終用戶分類 - 全球預測 2026-2032鍋爐製程添加劑市場按產品類型、鍋爐類型、給水來源、應用、最終用途產業和分銷管道分類-全球預測,2026-2032年
 石油煉製市場規模、佔有率和成長分析(按複雜程度、產品類型、製程類型、煉廠產能、最終用戶和地區分類)-2026-2033年產業預測
 全球煉油和石化過濾市場(按過濾器類型、應用、最終用戶和地區分類)- 預測至 2030 年
 全球煉油市場
 煉油廠和石化過濾市場-全球產業規模、佔有率、趨勢、機會和預測(按類型、應用、地區和競爭細分,2020-2030 年)全球常規石油市場