


 |
市場調查報告書
商品編碼
1684834
石油精煉市場機會、成長動力、產業趨勢分析與 2025 - 2034 年預測Oil Refining Market Opportunity, Growth Drivers, Industry Trend Analysis, and Forecast 2025 - 2034 |
||||||
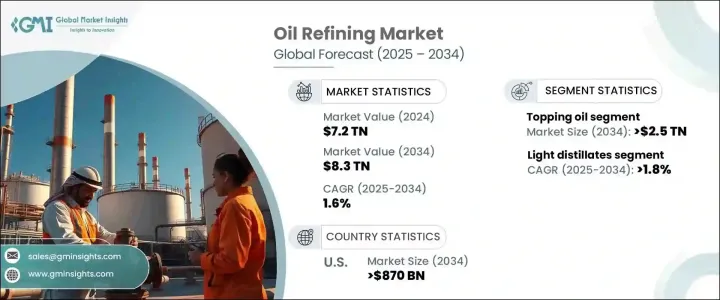
2024 年全球煉油市場規模達到 7.2 兆美元,預計 2025 年至 2034 年期間的複合年成長率為 1.6%。快速的工業化、經濟擴張和全球人口的成長正在推動對精煉石油產品的需求。隨著城鎮化進程加快和生活水準提高,發展中經濟體,特別是亞洲和非洲的能源消耗正在增加。航空和運輸業是這一成長的主要驅動力,需要穩定的精煉燃料供應來支持不斷擴大的全球流動性。
同時,更嚴格的環境法規正在重塑煉油業務,推動企業投資更清潔的技術和永續的實踐。該行業正在平衡燃料安全需求和向低碳解決方案的過渡,將煉油廠現代化作為首要任務。世界各國政府都在鼓勵對煉油基礎設施的投資,以減少進口依賴並提高能源生產的自給自足能力。加氫裂解和催化重整等先進的煉油製程正在提高效率、最大限度提高原油產量,支持市場穩步擴張。正在進行的新石油儲備的探勘和煉油廠管理中數位技術的採用進一步增強了該行業的前景。隨著煉油能力的不斷提高以及對燃料和石化產品的持續需求,全球煉油市場有望實現長期成長。
| 市場範圍 | |
|---|---|
| 起始年份 | 2024 |
| 預測年份 | 2025-2034 |
| 起始值 | 7.2兆美元 |
| 預測值 | 8.3兆美元 |
| 複合年成長率 | 1.6% |
預計到 2034 年,頂級石油產業將創收 2.5 兆美元,這得益於其將大型碳氫化合物分子分解為高價值精煉產品的效率。隨著工業製造和能源生產對石化原料的依賴性不斷增強,對優質油的需求持續上升。提高產量效率的強化煉油技術正在成為行業標準,幫助煉油廠最大限度地提高產量和盈利能力。該部門在為工業營運提供關鍵燃料方面發揮的作用,進一步鞏固了其在滿足全球能源需求方面的重要性。
受全球可支配收入增加和中產階級人口擴大的推動,到 2034 年,輕質餾分油市場預計將以 1.8% 的複合年成長率成長。汽油、石腦油和其他精煉石油產品在製造業、運輸業和住宅供暖等多個領域的廣泛使用正在推動需求。基礎設施擴張,特別是發展中經濟體的基礎設施擴張,正在增加對高品質精煉燃料的需求。隨著工業化進程的加快,該領域將保持穩定成長,鞏固其在石油煉製領域的關鍵作用。
受國產石油產品強勁需求的推動,美國煉油市場預計到 2034 年將創收 8,700 億美元。隨著國家尋求減少對外國石油的依賴,有利於煉油廠擴建和技術進步的政策正在加速產業成長。對數位化煉油廠管理、自動化和流程最佳化的投資正在提高效率,使美國煉油廠在全球舞台上更具競爭力。此外,政府探索未開發石油儲備和提高煉油能力的措施正在確保供應鏈的穩定性和彈性。憑藉著不斷的進步和對能源獨立的承諾,美國仍然是全球石油煉製市場的主導力量。
目錄
第 1 章:方法論與範圍
- 市場定義
- 基礎估算與計算
- 預測計算
- 資料來源
- 基本的
- 次要
- 有薪資的
- 民眾
第 2 章:執行摘要
第 3 章:產業洞察
- 產業生態系統分析
- 監管格局
- 產業衝擊力
- 成長動力
- 產業陷阱與挑戰
- 成長潛力分析
- 波特的分析
- PESTEL 分析
第4章:競爭格局
- 介紹
- 戰略儀表板
- 創新與永續發展格局
第 5 章:市場規模及預測:依複雜程度,2021 年至 2034 年
- 主要趨勢
- 食材
- 轉換
- 深度轉化
第 6 章:市場規模及預測:依產品,2021 – 2034 年
- 主要趨勢
- 輕質餾分油
- 中間餾分
- 燃料油
- 其他
第 7 章:市場規模與預測:按燃料,2021 – 2034 年
- 主要趨勢
- 汽油
- 柴油
- 煤油
- 液化石油氣
- 其他
第 8 章:市場規模與預測:按應用,2021 年至 2034 年
- 主要趨勢
- 公路運輸
- 航空
- 海上燃油
- 石油化工
- 其他行業
- 住宅/商業/農業
- 發電
- 鐵路和國內
第 9 章:市場規模與預測:按地區,2021 – 2034 年
- 主要趨勢
- 北美洲
- 美國
- 加拿大
- 墨西哥
- 歐洲
- 德國
- 法國
- 義大利
- 荷蘭
- 俄羅斯
- 西班牙
- 英國
- 亞太地區
- 中國
- 韓國
- 印度
- 新加坡
- 印尼
- 中東和非洲
- 沙烏地阿拉伯
- 阿拉伯聯合大公國
- 科威特
- 埃及
- 南非
- 奈及利亞
- 拉丁美洲
- 巴西
- 阿根廷
第10章:公司簡介
- ADNOC
- Bharat Petroleum
- BP
- Chevron
- CNPC
- ExxonMobil
- Fluor
- Hindustan Petroleum
- Indian Oil
- Kuwait Petroleum
- Marathon Petroleum
- PBF Energy
- Phillips 66
- Reliance Industries
- S-Oil
- Saudi Aramco
- Shell
- Valero
The Global Oil Refining Market reached USD 7.2 trillion in 2024 and is expected to grow at a CAGR of 1.6% between 2025 and 2034. Rapid industrialization, economic expansion, and the rising global population are fueling the demand for refined petroleum products. Developing economies, particularly in Asia and Africa, are witnessing increasing energy consumption as urbanization accelerates and living standards rise. The aviation and transportation industries are key drivers of this growth, requiring a steady supply of refined fuels to support expanding global mobility.
At the same time, stricter environmental regulations are reshaping refining operations, pushing companies to invest in cleaner technologies and sustainable practices. The industry is balancing the need for fuel security with the transition to lower-carbon solutions, making refinery modernization a top priority. Governments worldwide are incentivizing investments in refining infrastructure to reduce import dependency and boost self-sufficiency in energy production. Advanced refining processes, including hydrocracking and catalytic reforming, are enhancing efficiency and maximizing yield from crude oil, supporting steady market expansion. The ongoing exploration of new oil reserves and the adoption of digital technologies in refinery management further strengthen the sector's outlook. With continued advancements in refining capabilities and sustained demand for fuel and petrochemical products, the global oil refining market is poised for long-term growth.
| Market Scope | |
|---|---|
| Start Year | 2024 |
| Forecast Year | 2025-2034 |
| Start Value | $7.2 Trillion |
| Forecast Value | $8.3 Trillion |
| CAGR | 1.6% |
The topping oil segment is projected to generate USD 2.5 trillion by 2034, driven by its efficiency in breaking down large hydrocarbon molecules into high-value refined products. As industries increase their reliance on petrochemical feedstocks for manufacturing and energy production, demand for topping oil continues to rise. Enhanced refining techniques that improve yield efficiency are becoming industry standards, helping refiners maximize output and profitability. The segment's role in supplying crucial fuels for industrial operations further solidifies its importance in meeting global energy demands.
The light distillates segment is expected to grow at a CAGR of 1.8% through 2034, supported by rising disposable incomes and expanding middle-class populations worldwide. The widespread use of gasoline, naphtha, and other refined petroleum products across multiple sectors-including manufacturing, transportation, and residential heating-is driving demand. Infrastructure expansion, particularly in developing economies, is increasing the need for high-quality refined fuels. With industrialization gaining momentum, the segment is positioned for steady growth, reinforcing its critical role in the oil refining landscape.
The U.S. oil refining market is projected to generate USD 870 billion by 2034, bolstered by strong demand for domestically produced oil products. As the country seeks to reduce reliance on foreign oil, policies favoring refinery expansions and technological advancements are accelerating industry growth. Investments in digital refinery management, automation, and process optimization are improving efficiency, making U.S. refineries more competitive on the global stage. Additionally, government initiatives to explore untapped oil reserves and increase refining capacity are ensuring a stable and resilient supply chain. With ongoing advancements and a commitment to energy independence, the U.S. remains a dominant force in the global oil refining market.
Table of Contents
Chapter 1 Methodology & Scope
- 1.1 Market definitions
- 1.2 Base estimates & calculations
- 1.3 Forecast calculation
- 1.4 Data sources
- 1.4.1 Primary
- 1.4.2 Secondary
- 1.4.2.1 Paid
- 1.4.2.2 Public
Chapter 2 Executive Summary
- 2.1 Industry synopsis, 2021 - 2034
Chapter 3 Industry Insights
- 3.1 Industry ecosystem analysis
- 3.2 Regulatory landscape
- 3.3 Industry impact forces
- 3.3.1 Growth drivers
- 3.3.2 Industry pitfalls & challenges
- 3.4 Growth potential analysis
- 3.5 Porter's analysis
- 3.5.1 Bargaining power of suppliers
- 3.5.2 Bargaining power of buyers
- 3.5.3 Threat of new entrants
- 3.5.4 Threat of substitutes
- 3.6 PESTEL analysis
Chapter 4 Competitive Landscape, 2024
- 4.1 Introduction
- 4.2 Strategic dashboard
- 4.3 Innovation & sustainability landscape
Chapter 5 Market Size and Forecast, By Complexity Level, 2021 – 2034 (USD Billion, Million Barrels Per Day)
- 5.1 Key trends
- 5.2 Topping
- 5.3 Conversion
- 5.4 Deep conversion
Chapter 6 Market Size and Forecast, By Product, 2021 – 2034 (USD Billion, Million Barrels Per Day)
- 6.1 Key trends
- 6.2 Light distillates
- 6.3 Middle distillates
- 6.4 Fuel oil
- 6.5 Others
Chapter 7 Market Size and Forecast, By Fuel, 2021 – 2034 (USD Billion, Million Barrels Per Day)
- 7.1 Key trends
- 7.2 Gasoline
- 7.3 Gasoil
- 7.4 Kerosene
- 7.5 LPG
- 7.6 Others
Chapter 8 Market Size and Forecast, By Application, 2021 – 2034 (USD Billion, Million Barrels Per Day)
- 8.1 Key trends
- 8.2 Road transport
- 8.3 Aviation
- 8.4 Marine bunker
- 8.5 Petrochemical
- 8.6 Other industry
- 8.7 Residential/Commercial/Agriculture
- 8.8 Electricity generation
- 8.9 Rail & domestic
Chapter 9 Market Size and Forecast, By Region, 2021 – 2034 (USD Billion, Million Barrels Per Day)
- 9.1 Key trends
- 9.2 North America
- 9.2.1 U.S.
- 9.2.2 Canada
- 9.2.3 Mexico
- 9.3 Europe
- 9.3.1 Germany
- 9.3.2 France
- 9.3.3 Italy
- 9.3.4 Netherlands
- 9.3.5 Russia
- 9.3.6 Spain
- 9.3.7 UK
- 9.4 Asia Pacific
- 9.4.1 China
- 9.4.2 South Korea
- 9.4.3 India
- 9.4.4 Singapore
- 9.4.5 Indonesia
- 9.5 Middle East & Africa
- 9.5.1 Saudi Arabia
- 9.5.2 UAE
- 9.5.3 Kuwait
- 9.5.4 Egypt
- 9.5.5 South Africa
- 9.5.6 Nigeria
- 9.6 Latin America
- 9.6.1 Brazil
- 9.6.2 Argentina
Chapter 10 Company Profiles
- 10.1 ADNOC
- 10.2 Bharat Petroleum
- 10.3 BP
- 10.4 Chevron
- 10.5 CNPC
- 10.6 ExxonMobil
- 10.7 Fluor
- 10.8 Hindustan Petroleum
- 10.9 Indian Oil
- 10.10 Kuwait Petroleum
- 10.11 Marathon Petroleum
- 10.12 PBF Energy
- 10.13 Phillips 66
- 10.14 Reliance Industries
- 10.15 S-Oil
- 10.16 Saudi Aramco
- 10.17 Shell
- 10.18 Valero
 石油煉製:市場佔有率分析、產業趨勢與統計、成長預測(2026-2031)
 石油煉製市場規模、佔有率和成長分析(按複雜程度、產品類型、製程類型、煉廠產能、最終用戶和地區分類)-2026-2033年產業預測
 煉油和石化過濾市場:按應用、濾材、過濾技術、設備類型和最終用戶產業分類-全球預測,2025-2032年
 全球煉油和石化過濾市場(按過濾器類型、應用、最終用戶和地區分類)- 預測至 2030 年
 全球煉油市場
 2025-2029年全球精製市場
 煉油廠和石化過濾市場-全球產業規模、佔有率、趨勢、機會和預測(按類型、應用、地區和競爭細分,2020-2030 年)全球常規石油市場
 2025年精製和石化過濾全球市場報告
 全球精製和石化過濾市場(按過濾器類型、應用、最終用戶、地區(北美、歐洲、亞太地區、拉丁美洲、中東/非洲)):趨勢分析、競爭格局、未來預測(2019-2030) )