


 |
市場調查報告書
商品編碼
1852017
體育分析:市場佔有率分析、行業趨勢、統計數據和成長預測(2025-2030 年)Sports Analytics - Market Share Analysis, Industry Trends & Statistics, Growth Forecasts (2025 - 2030) |
||||||
※ 本網頁內容可能與最新版本有所差異。詳細情況請與我們聯繫。
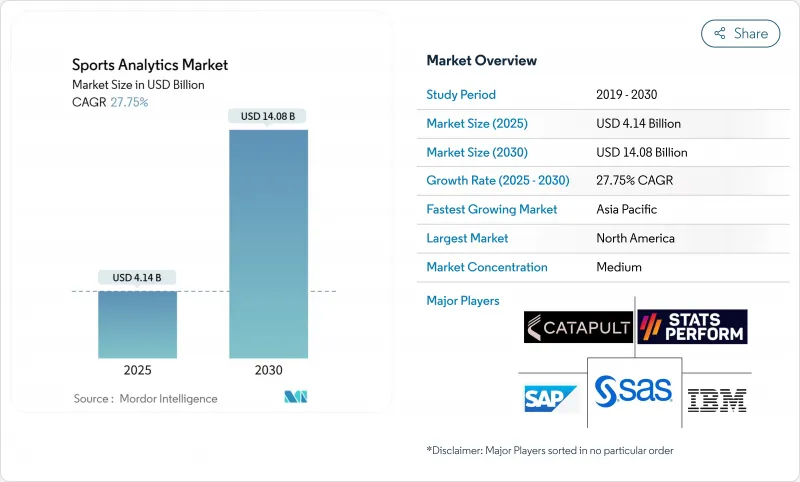
據估計,體育分析市場規模將在 2025 年達到 41.4 億美元,在 2030 年達到 140.8 億美元,2025 年至 2030 年的複合年成長率為 27.75%。
體育博彩的擴張需要三大支撐因素:更經濟的感測器、彈性雲容量以及不斷完善的體育博彩法律體制。如今,特許經營商將基於數據的決策視為日常風險管理的一部分,因此分析預算已成為銷售預測中的累計項目,而非實驗性計劃。隨著俱樂部傾向於選擇擁有成熟隱私控制機制的合作夥伴以降低未來合規風險,供應商整合正在加速。更長的合約期限提高了對經常性收入的可見性,表明分析已成為更廣泛的體育技術體系中不可或缺的一部分。
全球運動分析市場趨勢與洞察
物聯網感測器可實現即時追蹤
全場射頻追蹤技術在國家美式足球聯盟(NFL)的場館中,能夠捕捉每位球員每次進攻回合超過200個位置數據點,使教練團能夠將即時壓力指標轉化為傷病預防策略。同樣的數據流還能為球迷提供擴增實境互動體驗,並創造新的贊助機會,而無需額外的硬體投入。隨著標籤價格的下降,美國各地的大學計畫都在部署同樣的基礎設施,將體育分析市場從精英擴展到更廣泛的範圍。准入門檻的降低表明,遙測技術很快就會成為整個體育體系的基本需求。廣播合作夥伴正在購買相同直播串流的授權,用於疊加圖形,這證明單一資料集可以支援多種收入來源。
用於轉讓評估的集中式資料倉儲
歐洲足球俱樂部正將球探數據、運動科學數據、門票銷售數據和商業數據整合到一個統一的資料庫中,以規範球員評估模型。奧盧足球俱樂部於2024年實施的TransferLab系統,使規模較小的俱樂部能夠將自身球員與全球18萬家同行進行比較,從而增強自身在轉會談判中的地位。學術網路科學研究表明,在轉會網路中佔據中心位置的俱樂部,其營運績效往往優於其工資支出。因此,數據獲取正在縮小歷史遺留的實力差距,並擴大競爭範圍。嚴謹的估值邏輯正在取代直覺,投資人也將資料倉儲計劃視為股權結構資產,而非可自由支配的IT升級專案。
GDPR/CCPA 對生物辨識資料的限制
歐洲和加州的隱私法規強調知情同意、最小化處理和目的限制,這促使供應商重新設計工作流程,圍繞邊緣處理技術,在將原始生物特徵數據傳輸到雲端之前,將其轉換為匿名風險評分。那些首次通過審核的俱樂部現在會在爭取贊助時強調其合規性,使法律要求成為品牌差異化優勢。然而,額外的工程時間會減緩技術的普及,並在短期內減緩體育分析市場的成長。那些迅速採用「隱私設計」的供應商將獲得價格優勢,隨著規避風險的俱樂部轉向成熟的供應商,這將加速產業整合。
細分市場分析
預計到2030年,板球細分市場規模將以25%的複合年成長率成長,這主要得益於能夠將競標上限與球員表現差異相匹配的競標,以及能夠最佳化投球手輪換的精細化球路追蹤技術。相較之下,到2024年,足球仍將佔據體育分析市場規模的最大佔有率。板球協會的數據應用已將用戶群擴展到主要特許經營球隊之外,使供應商能夠將獲客成本分攤到龐大的客戶群中。儘管足球仍然是定價標桿,但板球的成長表明,多運動供應商將優先考慮跨領域藍圖,以抓住新興細分市場的成長潛力。
到2024年,軟體授權將佔體育分析市場佔有率的65%。然而,隨著俱樂部聘請整合服務商將傳統賽事系統與即時資料湖融合,專業服務預計將以24%的複合年成長率成長。基於結果的定價模式(根據勝場數、門票銷售量和贊助成長情況調整費用)將風險轉移給供應商,並激勵他們進行更深入的諮詢工作。經常性管理服務收入可以緩解領先許可費的周期性波動,從而為高效協調資料科學人員的供應商創造利潤空間。這種轉變表明,在預測期內,體育分析產業的產品與服務之間的界線將變得模糊。
體育分析市場按運動項目(足球、板球、籃球等)、組件(軟體、服務)、部署方式(本地部署、雲端部署)、最終用戶(運動隊/俱樂部、聯賽/聯合會、運動員、體育博彩營運商等)和地區進行細分。市場預測以美元計價。
區域分析
到2024年,北美將佔總收入的33.21%,這將推動對低延遲數據的持續需求,而成熟的特許經營估值模型和各州逐步放寬的博彩監管政策也為此提供了支持。所有美國國家美式足球聯盟(NFL)場館都安裝了覆蓋整個體育場的接收器陣列,由此催生了校準、維護和生命週期更換等配套服務市場。諸如「數位運動員舉措」等以數據主導的傷病預防項目,展現了官民合作關係如何加速科技的普及應用。
亞太地區預計將以26%的成長速度成為成長最快的地區,這主要得益於板球運動的商業性實力和行動優先的消費模式。電訊正將零流量的體育賽事直播捆綁到資料方案中,有效地補貼了用於數據分析回程傳輸的頻寬。印度、日本和澳洲政府正在資助運動員健康津貼,用於購買穿戴式裝置以備戰奧運會,從而提高消費者和專業運動員對運動表現指標的認知。 OTT平台正利用媒體端的分析技術,透過高度個人化的觀眾數據來增加觀看時間並降低用戶流失率,從而推動區域體育分析市場的擴張。
歐洲依然是創新的熔爐。足球五大聯賽的架構正在率先採用聯合數據架構,在更接近數據源的位置處理敏感數據,這是為了應對GDPR(通用數據保護規範),該條例已在全球範圍內推廣了增強隱私的分析技術。源自英格蘭、西班牙和德國的轉會費估值模型正透過參考資料倉儲基準的租借費條款,傳播到新興的南美聯賽。同時,拉丁美洲和中東及非洲地區的發展軌跡呈現出雙軌制:旗艦品牌部署企業級技術棧以最大化轉播權收益,而規模較小的公司則採用模組化訂閱模式,以確保收入的確定性。
其他福利:
- Excel格式的市場預測(ME)表
- 3個月的分析師支持
目錄
第1章 引言
- 研究假設和市場定義
- 調查範圍
第2章調查方法
第3章執行摘要
第4章 市場情勢
- 市場概覽
- 市場促進因素
- 利用物聯網感測器進行即時追蹤,推動了北美職業聯賽的需求。
- 歐洲足球俱樂部強制要求建立集中式資料倉儲,用於轉會評估。
- 美國合法化後的體育博彩數據夥伴關係
- 印度和澳洲板球聯賽中特許經營主導的分析方法應用
- 市場限制
- 南美洲和非洲二線俱樂部的技術預算有限
- GDPR/CCPA對生物辨識資料收集的限制
- 技術展望
- 監理展望
- 波特五力分析
- 供應商的議價能力
- 消費者議價能力
- 新進入者的威脅
- 競爭對手之間的競爭
- 替代品的威脅
第5章 市場規模與成長預測
- 體育運動
- 足球
- 蟋蟀
- 籃球
- 曲棍球
- 美國美式足球
- 棒球
- 橄欖球
- 其他運動
- 按組件
- 軟體
- 服務
- 透過部署
- 本地部署
- 雲
- 最終用戶
- 運動隊伍/俱樂部
- 聯盟和聯合會
- 個人運動員
- 體育博彩營運商
- 其他
- 按地區
- 北美洲
- 美國
- 加拿大
- 墨西哥
- 南美洲
- 巴西
- 阿根廷
- 其他南美洲國家
- 歐洲
- 德國
- 英國
- 法國
- 義大利
- 西班牙
- 其他歐洲地區
- 亞太地區
- 中國
- 日本
- 韓國
- 印度
- 亞太其他地區
- 中東和非洲
- 阿拉伯聯合大公國
- 沙烏地阿拉伯
- 南非
- 其他中東和非洲地區
- 北美洲
第6章 競爭情勢
- 策略趨勢
- Vendor Positioning Analysis
- 公司簡介
- IBM Corporation
- SAP SE
- SAS Institute Inc.
- Oracle Corporation
- Microsoft Corporation
- Stats Perform(Opta)
- Catapult Group International Ltd
- Sportradar AG
- Genius Sports Group
- Zebra Technologies Corp.
- Kinexon GmbH
- Second Spectrum Inc.
- Hudl(Agile Sports)
- Wyscout Srl
- Zelus Analytics
- ChyronHego Corp.
- Hawk-Eye Innovations Ltd
- Tableau Software LLC
- Sportlogiq
- Strivr Labs Inc.
- Zone7 AI Ltd
- Synergy Sports Technology
- Kitman Labs
- Orreco Ltd
第7章 市場機會與未來展望
The Sports Analytics market size is estimated at USD 4.14 billion in 2025, and is on course to reach USD 14.08 billion by 2030, delivering a 27.75% CAGR between 2025 and 2030.
Expansion rests on three reinforcing forces: cheaper sensors, elastic cloud capacity, and widening legal sports-betting frameworks. Franchise owners now view evidence-based decision making as routine risk management, so analytics budgets appear as line items in operating forecasts rather than as experimental projects. Vendor consolidation is gathering pace because clubs prefer partners with mature privacy controls that reduce future compliance exposure. Lengthening contract terms are lifting recurring revenue visibility, indicating that analytics has become an indispensable layer in the broader sports technology stack.
Global Sports Analytics Market Trends and Insights
Real-time Tracking Enabled by IoT Sensors
Full-field radio-frequency tracking now captures more than 200 positional data points per player on every down in National Football League venues, allowing coaching staff to translate real-time load indicators into injury-mitigation strategies . The same feeds power augmented-reality activations for fans, creating new sponsorship inventory without extra hardware outlay. As tag prices fall, collegiate programs across the United States are rolling out identical infrastructure, expanding the Sports Analytics market beyond elite tiers. Falling barriers suggest that telemetry will soon be a baseline requirement across the organised sports pyramid. Broadcast partners license identical raw streams for overlay graphics, proving that a single dataset can underpin multiple revenue chains.
Centralised Data Warehousing for Transfer Valuation
European football clubs consolidate scouting, sports science, ticketing, and commercial data in unified repositories to standardise player valuation models. AC Oulu's 2024 deployment of TransferLab lets a small-market side benchmark talent against 180,000 global peers, strengthening its position in transfer negotiations. Academic network-science work shows that clubs holding central positions in the transfer network consistently outperform wage-bill . The result is a broadening of competitive participation, as data access narrows historical power gaps. Rigorous valuation logic is replacing intuition, and investors view warehouse projects as cap-table assets rather than discretionary IT upgrades.
GDPR/CCPA Constraints on Biometric Data
European and Californian privacy regulations insist on consent, minimisation, and purpose limitation, driving suppliers to redesign workflows around edge processing that converts raw biometrics into anonymised risk scores before cloud transit. Clubs that achieve an audit pass on first attempt now reference compliance in sponsorship pitches, turning a legal requirement into a brand differentiator. However, extra engineering time slows deployment, trimming aggregate Sports Analytics market growth in the near term. Vendors that embedded privacy-by-design early have a pricing advantage that accelerates industry consolidation, as risk-averse clubs converge on proven providers.
Other drivers and restraints analyzed in the detailed report include:
- Sports-Betting Data Partnerships
- Franchise-Driven Analytics in Cricket
- Limited Tech Budgets of Tier-2 Clubs
For complete list of drivers and restraints, kindly check the Table Of Contents.
Segment Analysis
Cricket's segment market size is projected to log a 25% CAGR to 2030, powered by auction simulators that align bid ceilings with performance variance and by granular ball-tracking that optimises bowler rotation. In contrast, football retained the largest share of the Sports Analytics market size in 2024 because every top-tier club already embeds analytics teams in transfer, medical, and commercial units. Data adoption by associate cricket boards now widens penetration beyond marquee franchises, letting providers amortise acquisition costs over a long-tail customer base. Football still sets pricing benchmarks, yet cricket's growth suggests that multi-sport vendors will prioritise cross-disciplinary roadmaps to capture upside in emerging segments.
Software licenses contributed 65% of the Sports Analytics market share in 2024, reflecting entrenched platform fees. Professional services, however, are forecast to grow at a 24% CAGR as clubs ask for integration work that melds legacy tournament systems with real-time data lakes. Outcome-based pricing models that scale fees to wins, ticket yield, or sponsorship lift transfer risk to vendors, motivating them to deepen consulting practices. As recurring managed-service revenue smooths the cyclical nature of up-front licenses, margin accrues to providers that coordinate data-science staffing efficiently. The shift suggests that the Sports Analytics industry will blur product and service lines over the forecast period.
Sports Analytics Market is Segmented by Sport (Football, Cricket, Basketball, and More), Component (Software, Services), Deployment (On-Premise, Cloud), End User (Sports Teams/Clubs, Leagues and Federations, Individual Athletes, Sports Betting Operators, Others), Geography. The Market Forecasts are Provided in Terms of Value (USD).
Geography Analysis
North America controlled 33.21% revenue in 2024, underpinned by mature franchise valuation models and state-by-state betting liberalisation that fuels continuous demand for low-latency data. Stadium-wide receiver arrays in every National Football League venue have created ancillary service markets for calibration, maintenance, and lifecycle replacement. Data-driven injury-mitigation programs such as the Digital Athlete initiative illustrate how public-private partnerships accelerate adoption.
Asia-Pacific posts the fastest forecast growth at 26%, buoyed by cricket's commercial heft and mobile-first consumption patterns. Telecom operators bundle zero-rated live sport into data plans, effectively subsidising bandwidth for analytics backhaul. Governments in India, Japan, and Australia fund athlete-wellness grants that underwrite wearable purchases for Olympic preparation, lifting awareness of performance metrics across consumer and professional tiers. OTT platforms use hyper-personalised viewer data to increase watch-time and reduce churn, making media-side analytics a driver of regional Sports Analytics market expansion.
Europe remains an innovation crucible. Clubs in the top five football leagues pioneer federated data architectures that process sensitive material closer to source, a response to GDPR that has broadened privacy-enhanced analytics techniques worldwide. Transfer valuation models created in England, Spain, and Germany spread to emerging South American leagues via loan-fee clauses that reference warehouse benchmarks. Meanwhile, Latin America and the Middle East & Africa follow a dual-track trajectory: flagship brands install enterprise-grade stacks to maximise broadcast rights, while smaller organisations adopt modular subscriptions priced for revenue certainty.
- IBM Corporation
- SAP SE
- SAS Institute Inc.
- Oracle Corporation
- Microsoft Corporation
- Stats Perform (Opta)
- Catapult Group International Ltd
- Sportradar AG
- Genius Sports Group
- Zebra Technologies Corp.
- Kinexon GmbH
- Second Spectrum Inc.
- Hudl (Agile Sports)
- Wyscout Srl
- Zelus Analytics
- ChyronHego Corp.
- Hawk-Eye Innovations Ltd
- Tableau Software LLC
- Sportlogiq
- Strivr Labs Inc.
- Zone7 AI Ltd
- Synergy Sports Technology
- Kitman Labs
- Orreco Ltd
Additional Benefits:
- The market estimate (ME) sheet in Excel format
- 3 months of analyst support
TABLE OF CONTENTS
1 INTRODUCTION
- 1.1 Study Assumptions and Market Definition
- 1.2 Scope of the Study
2 RESEARCH METHODOLOGY
3 EXECUTIVE SUMMARY
4 MARKET LANDSCAPE
- 4.1 Market Overview
- 4.2 Market Drivers
- 4.2.1 Real-time Tracking Enabled by IoT Sensors Driving Demand in North-American Professional Leagues
- 4.2.2 Centralised Data Warehousing Mandates from European Football Clubs for Transfer Valuation
- 4.2.3 Sports-Betting Data Partnerships Post-Legalisation in the United States
- 4.2.4 Franchise-Driven Analytics Adoption in Indian and Australian Cricket Leagues
- 4.3 Market Restraints
- 4.3.1 Limited Tech Budgets of Tier-2 Clubs in South America and Africa
- 4.3.2 GDPR/CCPA Constraints on Biometric Data Collection
- 4.4 Technology Outlook
- 4.5 Regulatory Outlook
- 4.6 Porter's Five Forces Analysis
- 4.6.1 Bargaining Power of Suppliers
- 4.6.2 Bargaining Power of Consumers
- 4.6.3 Threat of New Entrants
- 4.6.4 Intensity of Competitive Rivalry
- 4.6.5 Threat of Substitutes
5 MARKET SIZE AND GROWTH FORECASTS (VALUE)
- 5.1 By Sport
- 5.1.1 Football (Soccer)
- 5.1.2 Cricket
- 5.1.3 Basketball
- 5.1.4 Hockey
- 5.1.5 American Football
- 5.1.6 Baseball
- 5.1.7 Rugby
- 5.1.8 Other Sports
- 5.2 By Component
- 5.2.1 Software
- 5.2.2 Services
- 5.3 By Deployment
- 5.3.1 On-Premise
- 5.3.2 Cloud
- 5.4 By End User
- 5.4.1 Sports Teams/Clubs
- 5.4.2 Leagues and Federations
- 5.4.3 Individual Athletes
- 5.4.4 Sports Betting Operators
- 5.4.5 Others
- 5.5 By Geography
- 5.5.1 North America
- 5.5.1.1 United States
- 5.5.1.2 Canada
- 5.5.1.3 Mexico
- 5.5.2 South America
- 5.5.2.1 Brazil
- 5.5.2.2 Argentina
- 5.5.2.3 Rest of South America
- 5.5.3 Europe
- 5.5.3.1 Germany
- 5.5.3.2 United Kingdom
- 5.5.3.3 France
- 5.5.3.4 Italy
- 5.5.3.5 Spain
- 5.5.3.6 Rest of Europe
- 5.5.4 Asia-Pacific
- 5.5.4.1 China
- 5.5.4.2 Japan
- 5.5.4.3 South Korea
- 5.5.4.4 India
- 5.5.4.5 Rest of Asia-Pacific
- 5.5.5 Middle East and Africa
- 5.5.5.1 United Arab Emirates
- 5.5.5.2 Saudi Arabia
- 5.5.5.3 South Africa
- 5.5.5.4 Rest of Middle East and Africa
- 5.5.1 North America
6 COMPETITIVE LANDSCAPE
- 6.1 Strategic Moves
- 6.2 Vendor Positioning Analysis
- 6.3 Company Profiles (includes Global level Overview, Market level overview, Core Segments, Financials as available, Strategic Information, Products and Services, and Recent Developments)
- 6.3.1 IBM Corporation
- 6.3.2 SAP SE
- 6.3.3 SAS Institute Inc.
- 6.3.4 Oracle Corporation
- 6.3.5 Microsoft Corporation
- 6.3.6 Stats Perform (Opta)
- 6.3.7 Catapult Group International Ltd
- 6.3.8 Sportradar AG
- 6.3.9 Genius Sports Group
- 6.3.10 Zebra Technologies Corp.
- 6.3.11 Kinexon GmbH
- 6.3.12 Second Spectrum Inc.
- 6.3.13 Hudl (Agile Sports)
- 6.3.14 Wyscout Srl
- 6.3.15 Zelus Analytics
- 6.3.16 ChyronHego Corp.
- 6.3.17 Hawk-Eye Innovations Ltd
- 6.3.18 Tableau Software LLC
- 6.3.19 Sportlogiq
- 6.3.20 Strivr Labs Inc.
- 6.3.21 Zone7 AI Ltd
- 6.3.22 Synergy Sports Technology
- 6.3.23 Kitman Labs
- 6.3.24 Orreco Ltd
7 MARKET OPPORTUNITIES AND FUTURE OUTLOOK
- 7.1 White-Space and Unmet-Need Assessment
 體育分析市場:按組件、運動項目、資料類型、部署模式、應用和最終用戶分類-2026年至2032年全球市場預測
 2026年全球體育分析市場報告
 2026-2030年全球運動分析市場
 體育分析市場規模、佔有率和趨勢分析報告:按組件、分析方法、運動項目、最終用途、地區和細分市場預測(2026-2033 年)
 體育分析市場分析及預測(至2035年):按類型、產品、技術、組件、應用、設備、流程、最終用戶、解決方案和部署類型分類
 全球體育分析市場規模、佔有率、趨勢和成長分析報告(2026-2034)
 體育分析市場報告:按組件、分析類型、運動項目和地區分類(2026-2034 年)體育分析工具市場:按交付方式、運動項目、應用和最終用戶分類,全球預測(2026-2032)運動分析市場規模、佔有率、成長及全球產業分析:依類型、應用和地區劃分的洞察與預測(2026-2034)
 體育分析市場-全球產業規模、佔有率、趨勢、機會和預測(按類型、解決方案、解決方案類型、最終用戶、地區和競爭格局分類,2021-2031年預測)