


 |
市場調查報告書
商品編碼
1852006
歐洲零售業分析:市場佔有率分析、產業趨勢、統計數據和成長預測(2025-2030 年)Europe Retail Analytics - Market Share Analysis, Industry Trends & Statistics, Growth Forecasts (2025 - 2030) |
||||||
※ 本網頁內容可能與最新版本有所差異。詳細情況請與我們聯繫。
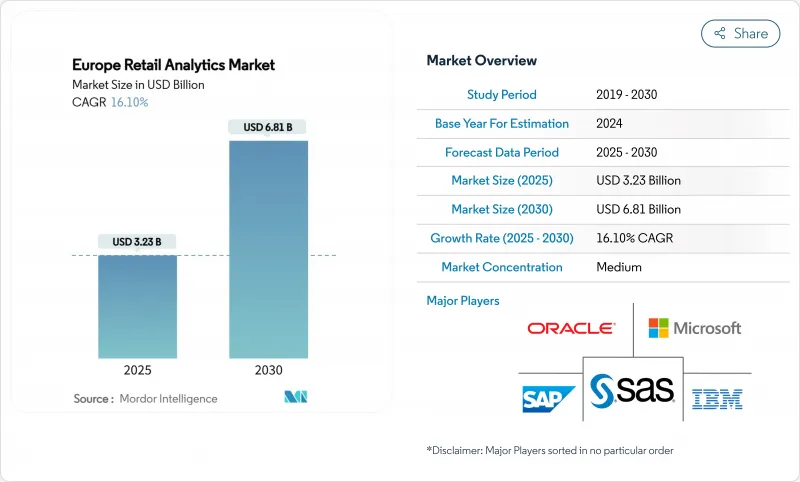
預計到 2025 年,歐洲零售分析市場規模將達到 32.3 億美元,到 2030 年將達到 68.1 億美元,預測期內複合年成長率將達到 16.1%。
持續的數位市場改革、不斷上漲的能源價格以及歐盟《數位市場法案》正推動零售商轉向先進的數據平台,以提高營運利潤率並確保合規性。雲端平台透過實現按需擴展、整合分散數據和降低資本支出,為此轉型提供了支援。隨著零售商大力推動即時貨架監控,邊緣分析技術正逐漸擴展到大賣場,而人工智慧驅動的動態定價則有助於在通膨環境下保障毛利率。各國趨勢仍存在差異:德國目前在支出方面領先,但義大利、西班牙以及中東歐國家也正在快速成長。資料科學人才缺口的擴大和日益嚴格的隱私保護可能會限制部分營運商採用雲端平台的速度。
歐洲零售分析市場趨勢與洞察
數據主導的個人化行銷可提高店內轉換率
部署雲端基礎建議引擎的零售商將店內行為數據輸入到與分析網路購物路徑相同的決策中心,從而實現貨架和收銀台的即時提案。早期採用者報告轉換率提升了 15% 至 25%,使他們能夠將預算從全面促銷轉向精準激勵。成功的專案依賴以獎勵為核心的設計架構,該架構會標記使用者同意、匯總使用者畫像並居住本地資料。需求主要集中在德國、法國和英國,這些國家擁有高密度的消費者和成熟的會員集點卡,提供了豐富的資料流。供應商簡化了傳統 POS 資料和電商日誌的身份解析流程,推動了大部分成長。由此產生的個人化循環支持企業從價格戰轉向體驗主導型差異化。
人工智慧定價引擎最佳化通膨環境下的歐洲利潤率
2024年初,歐元區食品通膨率飆升至15%,食品和一般商品的利潤空間受到擠壓。即使投入成本持續波動,採用演算法每小時調整SKU價格的零售財務部門也面臨3%至5%的利潤率下降。歐洲中央銀行觀察到,企業在高通膨時期會更頻繁地調整價格,這強化了能夠自動進行彈性建模的分析平台的商業性邏輯。動態引擎整合了競爭對手數據、能源額外費用和即時需求,以提案最佳貨架價格和降價時機。由於來自折扣店的激烈競爭,德國和義大利的零售商率先採取行動,其他零售商也紛紛效法。促銷活動期間,推理工作負載激增,需要擴展且不出現硬體瓶頸,促使雲端技術成為主流。
零售資料科學人才短缺
四分之三的德國零售商表示,2024年數據職位的招募將會延遲,法國和英國的情況也類似。金融科技和深度科技垂直領域的競爭推高了薪資水平,超出了許多零售商的承受能力。供應商正在透過整合自動化模型建置和自然語言查詢層來應對這項挑戰,使品類經理無需編寫程式碼即可進行預測。託管服務也在興起,供應商以訂閱模式提供資料科學家服務。中期來看,歐盟資助的技能再培訓舉措或許能夠緩解這項限制,但在此之前,平台易用性仍是歐洲零售分析市場的關鍵採購標準。
細分市場分析
到2024年,雲端選項將佔零售支出的58.1%,證實了大多數零售商傾向於將分析工作負載的運算和儲存層外包。隨著企業將大量報告、人工智慧訓練和即時事件流管道遷移到外部部署,預計到2030年,以雲端驅動的歐洲零售分析市場規模將以18.2%的複合年成長率成長。這一成長勢頭很大程度上是由週期性促銷活動推動的,例如黑色星期五、雙十一和自有品牌忠誠度計劃,這些活動給傳統資料中心帶來了壓力。 SAP 2025年第一季的歐洲、中東和非洲地區雲端收入年增30%,反映了這一轉變。雖然在擁有嚴格智慧財產權控制的時尚和奢侈品行業,本地叢集仍在運作,但隨著機密運算晶片增強公共雲端的安全態勢,其佔有率將會下降。混合架構彌合了這一差距,它允許店內攝影機在本地處理影像,同時將聚合指標上傳到中央資料湖,從而支援GDPR本地化和低延遲決策。
可擴展性是一項短期優勢,但成本控制是其根本。面臨能源價格上漲風險的零售商發現,將運算資源遷移異地可以有效抵消電力波動的影響,因為超大規模資料中心營運商會對其電力合約進行長期對沖。這種財務可預測性引起了財務主管的共鳴,他們既要保護息稅折舊攤提前利潤 (EBITDA),又要將資金再投資於業務成長。供應商之間的競爭正在轉向附加價值服務(垂直化資料模型、預訓練定價演算法、面向商品銷售人員的一鍵式儀錶板)。未來五年,這些差異化因素將影響歐洲零售分析市場雲端部分的收入格局。
在激烈的市場競爭中,零售商將重點放在客戶忠誠度維繫和個人化促銷上,而競爭考察將確保2024年銷售額成長29.6%。該模組的預測性細分引擎和購買路徑歸因模型仍將是全通路策略的基礎。然而,預計到2030年,供應履約將以17.3%的複合年成長率實現最快成長。漢高透過數據主導的能源最佳化,在2024年實現了400萬歐元的成本節約,展現了切實可見的投資報酬率。
策略與規劃儀錶板將商品行銷、財務和營運的關鍵績效指標 (KPI) 匯總成董事會層級的記分卡,構成變革管理的核心。商品行銷和品類最佳化模組利用人工智慧模擬購物籃親和性,並推薦季節性商品組合更新。隨著工會零售商尋求自動化重複性審核,門市營運分析(尤其是用於損耗控制的電腦視覺技術)正蓬勃發展。財務管理模組(包括即時毛利率追蹤)仍然至關重要,尤其是在食品零售領域,每天都會推出數十種新產品。這些細分領域展示了歐洲零售分析產業如何在收入成長和成本控制方面創造價值。
歐洲零售分析市場按部署類型(本地部署、雲端部署、混合部署)、模組類型(策略與規劃、行銷與客戶洞察、其他)、公司規模(中小企業、大型企業)、零售業態(實體店、電商、全通路零售)和國家/地區進行細分。市場預測以美元計價。
其他福利:
- Excel格式的市場預測(ME)表
- 3個月的分析師支持
目錄
第1章 引言
- 研究假設和市場定義
- 調查範圍
第2章調查方法
第3章執行摘要
第4章 市場情勢
- 市場概覽
- 市場促進因素
- 數據主導的個人化提升店內轉換率
- 人工智慧定價引擎最佳化通膨環境下的歐洲利潤率
- 邊緣分析技術在即時貨架監測中的興起
- 統一商務要求對客戶進行單一視圖管理。
- 歐盟數位市場法將使零售商擁有第一方數據
- 採用能源效率分析來遏制不斷上漲的能源費用。
- 市場限制
- 零售資料科學人才短缺
- GDPR 和電子隱私法規提高了資料隱私保護水平
- 傳統POS系統碎片化阻礙了資料整合
- 凍結對中小型零售企業的資本投資
- 價值鏈分析
- 監管環境
- 技術展望
- 波特五力分析
- 新進入者的威脅
- 買方的議價能力
- 供應商的議價能力
- 替代品的威脅
- 競爭對手之間的競爭
- 宏觀經濟因素如何影響市場
第5章 市場規模與成長預測
- 按實現類型
- 本地部署
- 雲
- 混合
- 按模組類型
- 策略與規劃
- 行銷和客戶洞察
- 財務管理
- 門市營運和防損
- 商品行銷及品類最佳化
- 供應鍊和履約
- 按企業規模
- 小型企業
- 主要企業
- 按零售業態
- 實體店面
- 電子商務
- 全通路零售
- 按國家/地區
- 英國
- 德國
- 法國
- 義大利
- 西班牙
- 其他歐洲地區
第6章 競爭情勢
- 市場集中度
- 策略趨勢
- 市佔率分析
- 公司簡介
- SAP SE
- Oracle Corporation
- IBM Corporation
- SAS Institute Inc.
- Microsoft Corporation
- QlikTech International AB
- Tableau Software LLC
- MicroStrategy Incorporated
- Zoho Corporation Pvt. Ltd.
- Alteryx Inc.
- RetailNext Inc.
- Blue Yonder GmbH
- NielsenIQ
- ThoughtSpot Inc.
- Sisense Ltd.
- Domo Inc.
- Looker Data Sciences(Google)
- Snowflake Inc.
- Databricks Inc.
- C3.ai Inc.
第7章 市場機會與未來展望
The Europe retail analytics market size stood at USD 3.23 billion in 2025 and is projected to reach USD 6.81 billion by 2030, registering a 16.1% CAGR during the forecast period.
Ongoing digital-market reforms, elevated energy prices, and the EU Digital Markets Act are steering retailers toward advanced data platforms that improve operating margins and regulatory compliance. Cloud platforms underpin this transition because they scale on demand, integrate disparate data types, and cut capital expenditure. Edge analytics is spreading through hypermarkets as retailers push real-time shelf monitoring, while AI-enabled dynamic pricing helps defend gross margins in an inflationary environment. Country dynamics remain heterogeneous: Germany drives spending today, but Italy, Spain, and several Central and Eastern European countries are expanding faster. A widening gap in data-science talent and stricter privacy enforcement could restrain the pace of deployments for some operators.
Europe Retail Analytics Market Trends and Insights
Data-driven personalization lifts in-store conversion
Retailers deploying cloud-based recommendation engines now feed in-store behavior into the same decision hubs that analyze web journeys, enabling real-time offers at the shelf or check-out. Early adopters report conversion uplifts between 15% and 25%, which in turn drives budget reallocation from blanket promotions to targeted incentives. Successful programs rely on privacy-by-design architectures that tag consent, aggregate profiles, and maintain local data residence. Demand concentrates in Germany, France, and the United Kingdom, where high shopper density and loyalty-card maturity provide rich data streams. Vendors that simplify identity resolution across legacy point-of-sale feeds and e-commerce logs capture most of the growth. The resulting personalization loop supports the broader shift toward experience-led differentiation rather than price competition.
AI-powered pricing engines optimise margins in inflationary Europe
Food and general merchandise margins came under pressure when euro-area food inflation peaked at 15% in early 2024. Retail finance departments that embraced algorithms capable of re-pricing SKUs hourly saw 3-5% margin relief even as input costs remained volatile. The European Central Bank confirms that firms alter prices more frequently during high-inflation periods, reinforcing the commercial logic for analytics platforms that automate elasticity modelling. Dynamic engines ingest competitor crawls, energy surcharges, and real-time demand to suggest optimal shelf prices and markdown cadences. Retailers in Germany and Italy moved fastest because of intense discounter competition, setting a regional template others now follow. Cloud deployment dominates because inference workloads spike during promotion events and must scale without hardware bottlenecks.
Shortage of retail data-science talent pool
Three-quarters of German retailers reported hiring delays for data roles in 2024, and similar patterns surfaced in France and the United Kingdom. Competition from fintech and deep-tech verticals raises salary benchmarks beyond what many retailers can absorb. Vendors respond by embedding automated model-building and natural-language query layers so that category managers can run forecasts without writing code. Managed-service engagements gain traction as well, with providers offering fractional data scientists on subscription. Over the medium term, EU-funded reskilling initiatives could ease constraints, but until then, platform usability remains a key purchase criterion inside the European retail analytics market.
Other drivers and restraints analyzed in the detailed report include:
- Proliferation of edge analytics for real-time shelf monitoring
- Unified commerce mandates single view of customer
- Data-privacy tightening under GDPR and forthcoming ePrivacy Regulation
For complete list of drivers and restraints, kindly check the Table Of Contents.
Segment Analysis
Cloud options drew 58.1% of spending in 2024, confirming that most retailers prefer outsourcing compute and storage layers for analytics workloads. The Europe retail analytics market size attributed to cloud is forecast to climb at an 18.2% CAGR until 2030 as enterprises migrate batch reporting, AI training and real-time event streaming pipelines off-premise. Much of the momentum comes from periodic promotional surges-Black Friday, Singles' Day, or private-label loyalty drives-that stress legacy data centers. SAP's EMEA cloud revenue jumped 30% year-over-year in Q1 2025, mirroring this migration trend. On-premise clusters still run in fashion and luxury houses with stringent intellectual-property controls, yet their share will shrink as confidential-computing chips harden public-cloud security postures. Hybrid architectures bridge the gap where in-store cameras process images locally but upload aggregated metrics to central lakes, supporting GDPR locality and low-latency decisions.
Scalability explains the near-term advantage, but cost discipline sustains it. Retailers exposed to energy spikes discovered that moving compute off-site neutralizes power volatility, because hyperscalers hedge electricity contracts longer term. That financial predictability resonates with finance chiefs tasked to safeguard EBITDA while reinvesting in growth. Vendor competition now shifts to value-added services-verticalized data models, pre-trained pricing algorithms, and one-click dashboards for merchandisers. These differentiators will shape revenue capture inside the cloud portion of the Europe retail analytics market over the next five years.
Marketing and Customer Insights secured 29.6% revenue in 2024 because retailers target loyalty retention and individualized promotions amid relentless competition. The module's predictive-segmentation engines and path-to-purchase attribution models remain foundational for omnichannel strategies. Yet, Supply-Chain and Fulfilment is expected to clock a 17.3% CAGR to 2030, the fastest among all modules, as retailers reengineer networks for resilience. Henkel's EUR 4 million saving through data-driven energy optimization in 2024 showcase tangible ROI.
Strategy and Planning dashboards knit KPIs from merchandising, finance, and operations into board-level scorecards, creating a change-management backbone. Merchandising and Category Optimization modules use AI to simulate basket affinities and recommend assortment refreshes every season. Store-operations analytics-especially computer vision for shrinkage-is picking up speed as unionized retailers look to automate repetitive audits. Financial Management modules, including real-time gross-margin tracking, remain essential, particularly in food retail, where dozens of commodity inputs move daily. Together, these sub-segments illustrate how the Europe retail analytics industry delivers value across both revenue growth and cost-containment objectives.
Europe Retail Analytics Market is Segmented by Mode of Deployment (On-Premise, Cloud, and Hybrid), Module Type (Strategy and Planning, Marketing and Customer Insights, and More), Business Size (Small and Medium Enterprises and Large Enterprises), Retail Format (Brick-And-Mortar, E-Commerce, and Omnichannel Retail), and Country. The Market Forecasts are Provided in Terms of Value (USD).
List of Companies Covered in this Report:
- SAP SE
- Oracle Corporation
- IBM Corporation
- SAS Institute Inc.
- Microsoft Corporation
- QlikTech International AB
- Tableau Software LLC
- MicroStrategy Incorporated
- Zoho Corporation Pvt. Ltd.
- Alteryx Inc.
- RetailNext Inc.
- Blue Yonder GmbH
- NielsenIQ
- ThoughtSpot Inc.
- Sisense Ltd.
- Domo Inc.
- Looker Data Sciences (Google)
- Snowflake Inc.
- Databricks Inc.
- C3.ai Inc.
Additional Benefits:
- The market estimate (ME) sheet in Excel format
- 3 months of analyst support
TABLE OF CONTENTS
1 INTRODUCTION
- 1.1 Study Assumptions and Market Definition
- 1.2 Scope of the Study
2 RESEARCH METHODOLOGY
3 EXECUTIVE SUMMARY
4 MARKET LANDSCAPE
- 4.1 Market Overview
- 4.2 Market Drivers
- 4.2.1 Data-driven personalization lifts in-store conversion
- 4.2.2 AI-powered pricing engines optimise margin in inflationary Europe
- 4.2.3 Proliferation of edge analytics for real-time shelf monitoring
- 4.2.4 Unified commerce mandates single view of customer
- 4.2.5 EU Digital Markets Act pushing retailers to own first-party data
- 4.2.6 Energy-efficiency analytics adopted to curb soaring utility bills
- 4.3 Market Restraints
- 4.3.1 Shortage of retail data-science talent pool
- 4.3.2 Data-privacy tightening under GDPR and ePrivacy Regulation
- 4.3.3 Legacy POS fragmentation impedes data integration
- 4.3.4 Capital-expenditure freeze among SME retailers
- 4.4 Value Chain Analysis
- 4.5 Regulatory Landscape
- 4.6 Technological Outlook
- 4.7 Porter's Five Forces Analysis
- 4.7.1 Threat of New Entrants
- 4.7.2 Bargaining Power of Buyers
- 4.7.3 Bargaining Power of Suppliers
- 4.7.4 Threat of Substitutes
- 4.7.5 Intensity of Competitive Rivalry
- 4.8 Impact of Macroeconomic Factors on the Market
5 MARKET SIZE AND GROWTH FORECASTS (VALUES)
- 5.1 By Mode of Deployment
- 5.1.1 On-Premise
- 5.1.2 Cloud
- 5.1.3 Hybrid
- 5.2 By Module Type
- 5.2.1 Strategy and Planning
- 5.2.2 Marketing and Customer Insights
- 5.2.3 Financial Management
- 5.2.4 Store Operations and Loss Prevention
- 5.2.5 Merchandising and Category Optimisation
- 5.2.6 Supply-Chain and Fulfilment
- 5.3 By Business Size
- 5.3.1 Small and Medium Enterprises
- 5.3.2 Large Enterprises
- 5.4 By Retail Format
- 5.4.1 Brick-and-Mortar
- 5.4.2 E-Commerce
- 5.4.3 Omnichannel Retail
- 5.5 By Country
- 5.5.1 United Kingdom
- 5.5.2 Germany
- 5.5.3 France
- 5.5.4 Italy
- 5.5.5 Spain
- 5.5.6 Rest of Europe
6 COMPETITIVE LANDSCAPE
- 6.1 Market Concentration
- 6.2 Strategic Moves
- 6.3 Market Share Analysis
- 6.4 Company Profiles (includes Global level Overview, Market level overview, Core Segments, Financials, Strategic Information, Market Rank/Share, Products and Services, Recent Developments)
- 6.4.1 SAP SE
- 6.4.2 Oracle Corporation
- 6.4.3 IBM Corporation
- 6.4.4 SAS Institute Inc.
- 6.4.5 Microsoft Corporation
- 6.4.6 QlikTech International AB
- 6.4.7 Tableau Software LLC
- 6.4.8 MicroStrategy Incorporated
- 6.4.9 Zoho Corporation Pvt. Ltd.
- 6.4.10 Alteryx Inc.
- 6.4.11 RetailNext Inc.
- 6.4.12 Blue Yonder GmbH
- 6.4.13 NielsenIQ
- 6.4.14 ThoughtSpot Inc.
- 6.4.15 Sisense Ltd.
- 6.4.16 Domo Inc.
- 6.4.17 Looker Data Sciences (Google)
- 6.4.18 Snowflake Inc.
- 6.4.19 Databricks Inc.
- 6.4.20 C3.ai Inc.
7 MARKET OPPORTUNITIES AND FUTURE OUTLOOK
- 7.1 White-space and Unmet-need Assessment
 零售分析市場按組件、組織規模和最終用戶分類 - 2025-2032 年全球預測
 2025 年至 2033 年零售分析市場報告(按功能、組件、部署模式、最終用戶和地區)
 2032 年零售分析市場預測:按解決方案、部署、零售店類型、現場群眾外包、應用程式和地區進行的全球分析
 2025-2029年全球零售分析市場
 零售分析:市場佔有率分析、產業趨勢、統計數據和成長預測(2025-2030)
 2025年全球零售分析軟體與服務市場報告2025 年零售分析全球市場報告
 零售分析市場規模、佔有率和成長分析(按產品、業務功能、應用和地區)- 產業預測 2025-2032
 零售分析市場:全球產業分析、市場規模、佔有率、成長、趨勢與未來預測(2025-2032)亞太零售分析:市場佔有率分析、產業趨勢與成長預測(2025-2030 年)