


 |
市場調查報告書
商品編碼
1850054
零售分析:市場佔有率分析、產業趨勢、統計數據和成長預測(2025-2030)Retail Analytics - Market Share Analysis, Industry Trends & Statistics, Growth Forecasts (2025 - 2030) |
||||||
※ 本網頁內容可能與最新版本有所差異。詳細情況請與我們聯繫。
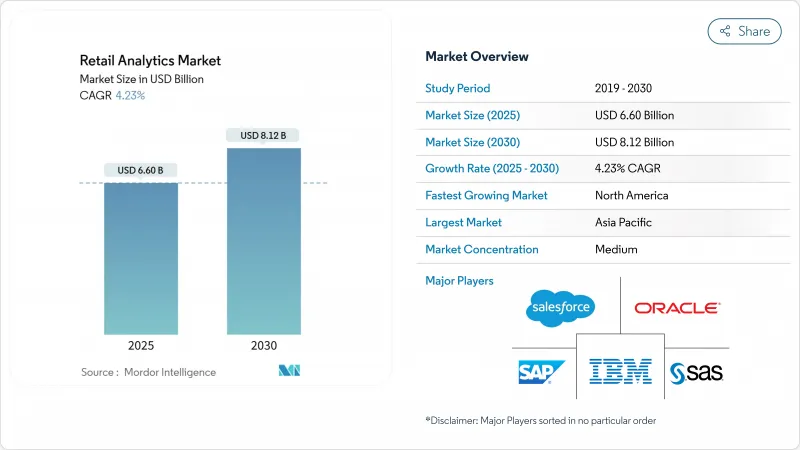
零售分析市場規模預計在 2025 年達到 66 億美元,預計到 2030 年將達到 81.2 億美元,在此期間的複合年成長率為 4.23%。
全通路商務的擴張、數據量的激增以及人工智慧主導決策引擎的快速普及,正推動零售商將分析技術融入日常流程。雲端交付模式降低了擁有成本並縮短了部署週期,使中階連鎖店能夠獲得曾經只有全球領先企業才能獲得的功能。即時個人化、規範庫存工具和高級促銷最佳化正在提高轉換率和訂單盈利,即便淨利率有所下降。競爭優勢正轉向整合預測性、規範性和生成性功能的平台,這標誌著分析技術正從一項可自由支配的支出轉變為基本的零售需求。
全球零售分析市場趨勢與洞察
全通路數據爆炸性成長
零售商如今累積了大量交易、行為和社交訊號。數據成長的步伐推動了對整合數據湖的投資,這些數據湖整合了門市、電商和第三方數據,並支援近乎即時的彙報。擅長快速模式識別的營運商可以提高定價靈活性、精準需求預測並提高存貨周轉,所有這些都能提高毛利率。管理這種激增的數據也刺激了雲端需求,因為彈性基礎設施可以防止尖峰時段出現效能瓶頸。因此,分析成熟度是衡量商業性韌性的晴雨表。
人工智慧/機器學習的進步實現了即時規範性洞察
利用機器學習進行需求感知可以減少供應鏈錯誤和銷售機會的流失,而電腦視覺應用則將智慧技術延伸至銷售現場。零售商將人工智慧融入建議引擎,可以解鎖新的交叉銷售收益流,並提升客戶終身價值,因為產出結果已從解釋性儀錶板轉向自動化決策。融合語言、視覺和結構化資料的多模態模型創造了一個統一的智慧層,打破了功能孤島。這種轉變正在重新定義零售商尋求的人才,並重塑供應商的選擇標準,現在,預先建立的、可解釋的模型變得尤為重要。
資料隱私法規和合規成本
GDPR 和 CCPA 等日益嚴格的隱私權法正迫使零售商重組其資料管道,以遵守知情同意和最小化規則。現代化預算擴大被分配給用於加密和管理敏感資訊的安全工具,從而分散了原本用於分析創新的資金。跨境零售商面臨複雜的合規矩陣和更長的全球擴張部署週期。隱私設計框架有助於減輕法規的影響,但它們可能會限制資料粒度,從而可能限制高階分析在高要求市場中的應用範圍。因此,保護義務與分析目標之間的相互作用仍然是一項至關重要的策略平衡。
細分分析
到2024年,雲端部署將占到計劃的62.00%,到2030年,複合年成長率將達到9.60%。訂閱定價可最大限度地減少資本投入,彈性計算則使零售商能夠在不降低性能的情況下應對促銷高峰。雖然一些連鎖店會將敏感資料保存在店內以滿足主權和延遲要求,但將本地資料儲存與雲端處理相結合的混合架構正在成為一種戰略中間地帶。這些混合設計可以減少詐欺偵測等關鍵任務工作負載的往返時間,同時利用雲端的經濟性來訓練分析模型。因此,針對特定工作負載的部署選擇變得越來越重要,而不是一刀切地採用雲端優先或本地部署。
純電商零售商將繼續超越其他業態,到 2024 年,其採用率將達到 60.00%,複合年成長率為 9.20%。其數位原民架構能夠快速部署預測模型,擺脫傳統整合障礙,提升每次點擊的體驗。實體店業者正在透過添加感測器、RFID 和電腦視覺技術,將店內行為轉化為可操作的數據,從而縮小數據缺口。全通路連鎖店正在採用統一的商業分析技術,整合線上和店內洞察,以改善跨通路庫存分配和履約路線。這些不同的優先事項表明,經營模式如何決定藍圖,但所有業態都認同需要更快、更細緻的洞察。
零售分析市場按解決方案(軟體和服務)、部署(雲端、內部部署、混合)、功能(客戶管理、供應鏈管理、行銷和商品行銷- 定價/產量比率、其他功能 - 訂單管理)、零售形式(實體店、純電子商務、全通路零售)和地區(北美、南美、歐洲、亞太、中東和非洲)細分。
區域分析
由於強大的雲端基礎設施、深度電商滲透以及與主要分析供應商的接近性,北美將在2024年以38.20%的收入佔有率引領零售分析市場。美國零售商計劃在2025年增加技術預算,其中最大一部分將用於客戶資料平台和基於人工智慧的決策引擎。加拿大正在大力投資客戶分析,以在成熟市場中脫穎而出,而墨西哥則優先考慮供應鏈最佳化,以解決物流不穩定的問題。
受電商爆炸式成長、智慧型手機普及率上升以及雄心勃勃的數位轉型計畫的推動,到2030年,亞太地區的複合年成長率將達到6.30%,位居全球最快。中國正率先應用社交商務分析,整合支付、配送和社區參與數據,建構端到端的洞察閉迴路。印度正在採用預測模型,根據多樣化的消費趨勢,根據都市區地區客製化產品組合。日本和韓國則優先考慮以門市為中心的分析,例如使用電腦視覺進行客流量測量,以振興實體店。
歐洲市場佔有重要地位,其中英國、德國和法國的零售系統最為先進。嚴格的隱私法規正在推動混合部署,以平衡資料駐留和雲端的擴充性。隨著零售商使用環境指標來指導採購和包裝決策,永續性分析正日益普及。拉丁美洲的成長集中在巴西和阿根廷,分析技術正在幫助這兩個國家管理外匯波動並最佳化區域促銷活動。中東和非洲市場規模仍然較小,但在以色列和阿拉伯聯合大公國等市場較為活躍,奢侈品零售商和旅遊業正加速採用顧客體驗分析技術。
其他福利:
- Excel 格式的市場預測 (ME) 表
- 3個月的分析師支持
目錄
第1章 引言
- 研究假設和市場定義
- 調查範圍
第2章調查方法
第3章執行摘要
第4章 市場狀況
- 市場概況
- 市場促進因素
- 全通路數據爆炸性成長
- 人工智慧/機器學習的進步實現了即時預測洞察
- 雲端分析降低了擁有成本
- 對超個人化購物體驗的需求
- 市場限制
- 資料隱私法規和合規成本
- 傳統 IT 堆疊與分析技能差距
- 供應鏈分析
- 監管格局
- 技術展望
- 波特五力分析
- 新進入者的威脅
- 買方的議價能力
- 供應商的議價能力
- 替代品的威脅
- 競爭對手之間的競爭
- 評估宏觀經濟趨勢對市場的影響
第5章市場規模及成長預測
- 按解決方案
- 軟體
- 服務
- 按部署模型
- 雲
- 本地部署
- 混合
- 按功能
- 客戶管理
- 商店營運-庫存管理
- 店鋪營運 - 績效管理
- 供應鏈管理
- 行銷與商品行銷- 定價/收益
- 其他功能 - 運輸管理
- 其他功能 - 訂單管理
- 按零售形式
- 實體店面
- 純電商
- 全通路零售商
- 按地區
- 北美洲
- 美國
- 加拿大
- 墨西哥
- 歐洲
- 英國
- 德國
- 法國
- 義大利
- 其他歐洲地區
- 亞太地區
- 中國
- 日本
- 印度
- 韓國
- 其他亞太地區
- 中東
- 以色列
- 沙烏地阿拉伯
- 阿拉伯聯合大公國
- 土耳其
- 其他中東地區
- 非洲
- 南非
- 埃及
- 其他非洲國家
- 南美洲
- 巴西
- 阿根廷
- 南美洲其他地區
- 北美洲
第6章 競爭態勢
- 市場集中度
- 策略趨勢
- 市佔率分析
- 公司簡介
- SAP SE
- IBM Corporation
- Oracle Corporation
- Salesforce Inc.(Tableau)
- SAS Institute Inc.
- QlikTech International AB
- Microsoft Corp.(Power BI, Dynamics 365)
- Amazon Web Services Inc.(QuickSight)
- Google LLC(Looker)
- Blue Yonder Inc.
- Dunnhumby Ltd.
- Teradata Corp.
- RetailNext Inc.
- Zebra Technologies Corp.
- Altair Engineering Inc.
- Alteryx Inc.
- MicroStrategy Inc.
- ThoughtSpot Inc.
- Fujitsu Ltd.
- Infor Inc.
第7章 市場機會與未來展望
The retail analytics market size is estimated at USD 6.60 billion in 2025 and is projected to reach USD 8.12 billion by 2030, registering a 4.23% CAGR across the period.
Broader omnichannel commerce, surging data volumes, and rapid adoption of AI-driven decision engines are encouraging retailers to embed analytics into day-to-day processes. Cloud delivery models are cutting ownership costs and trimming deployment cycles, which allows mid-tier chains to access capabilities once limited to global leaders. Real-time personalization, prescriptive inventory tools, and advanced promotion optimisation are lifting conversion rates and order profitability even as margins tighten. Competitive advantage is shifting toward platforms that integrate predictive, prescriptive, and generative capabilities, signaling that analytics has moved from a discretionary spend to a fundamental retail requirement.
Global Retail Analytics Market Trends and Insights
Omnichannel data-volume explosion
Retailers now ingest vast pools of transaction, behavioural, and social signals that dwarf prior years and mandate scalable analytics platforms. The pace of data growth is prompting investments in unified data lakes that consolidate store, e-commerce, and third-party feeds to support near real-time reporting. Operators that master rapid pattern recognition improve pricing agility, sharpen demand forecasts, and raise inventory turns, which collectively push gross-margin lift. Managing this surge also accelerates cloud demand because elastic infrastructure prevents performance bottlenecks during peak events. Consequently, analytic maturity becomes a barometer for commercial resilience.
AI/ML advances enabling real-time prescriptive insights
Machine-learning-powered demand sensing is reducing supply-chain errors and missed sales opportunities, while computer vision applications extend intelligence to the sales floor. Retailers that embed AI into recommendation engines capture new cross-sell revenue streams and improve lifetime customer value as output moves from descriptive dashboards to automated decisions. Multimodal models that blend language, vision, and structured data produce unified intelligence layers that break down functional silos. These shifts are redefining the talent profiles retailers seek and are reshaping vendor selection criteria, with emphasis now on pre-built, explainable models.
Data-privacy regulation and compliance costs
Tightening privacy laws such as GDPR and CCPA compel retailers to re-engineer data pipelines to uphold consent and minimisation rules. Modernisation budgets now allocate growing shares to security tooling that encrypts and governs sensitive information, diverting funds from analytics innovation. Cross-border retailers face complex compliance matrices that elongate deployment cycles for global rollouts. Privacy-by-design frameworks help reduce regulatory exposure but also limit data granularity, which may curb the scope of advanced analytics in high-stringency markets. The interplay between protection mandates and analytics ambitions, therefore, remains a key strategic balancing act.
Other drivers and restraints analyzed in the detailed report include:
- Uptake of cloud analytics lowering TCO
- Demand for hyper-personalised shopping journeys
- Legacy IT stacks and analytics skills gap
For complete list of drivers and restraints, kindly check the Table Of Contents.
Segment Analysis
Cloud deployments captured 62.00% of projects in 2024 and will grow at a 9.60% CAGR to 2030. Subscription pricing minimises capital commitments, and elastic compute equips retailers to handle promotional peaks without performance dips. Although some chains retain sensitive data on-site to satisfy sovereignty and latency requirements, hybrid architectures that blend local data storage with cloud compute are emerging as a strategic middle ground. These hybrid designs reduce round-trip times for mission-critical workloads such as fraud detection while leveraging cloud economics for analytics model training. As a result, deployment choices increasingly hinge on workload characteristics rather than a blanket cloud-first or on-premises stance.
Pure-play e-commerce retailers captured 60.00% of deployments in 2024 and will continue to outgrow other formats at a 9.20% CAGR. Their digital-native architectures enable rapid adoption of predictive models without legacy integration hurdles, allowing them to refine experiences at every click. Brick-and-mortar operators are bridging the data gap by adding sensors, RFID, and computer vision to convert in-store behaviour into actionable data. Omnichannel chains adopt unified commerce analytics that merge online and store insights to improve cross-channel stock allocation and fulfilment routing. These varied priorities illustrate that business model dictates analytics roadmaps, yet all formats converge on the need for faster, more granular insights.
Retail Analytics Market is Segmented by Solutions (Software and Services), Deployment (Cloud, On-Premises, Hybrid), Function (Customer Management, Supply Chain Management, Marketing and Merchandising - Pricing/Yield, Other Functions - Order Management), Retail Format (Brick-And-Mortar Stores, Pure-Play E-Commerce, Omnichannel Retailers), Geography (North America, South America, Europe, Asia-Pacific, Middle East and Africa).
Geography Analysis
North America led the retail analytics market with 38.20% revenue share in 2024, supported by robust cloud infrastructure, deep e-commerce penetration, and proximity to leading analytics vendors. United States retailers plan to raise technology budgets in 2025, directing the largest allocations to customer-data platforms and AI-based decision engines. Canada trails slightly yet invests heavily in customer analytics to differentiate in a mature market, while Mexico emphasises supply-chain optimisation to address logistics volatility.
Asia-Pacific is set to post the fastest CAGR at 6.30% through 2030, propelled by explosive e-commerce growth, increasing smartphone adoption, and ambitious digital transformation programs. China pioneers social-commerce analytics that integrate payment, delivery, and community engagement data, producing end-to-end insight loops. India's diverse consumer landscape encourages retailers to deploy predictive models that tailor assortments across urban and rural zones. Japan and South Korea emphasise store-centric analytics such as computer-vision footfall measurement to revitalise physical outlets.
Europe retains a meaningful footprint anchored by sophisticated retail systems in the United Kingdom, Germany, and France. Stringent privacy rules drive adoption of hybrid deployments that balance data residency with cloud scalability. Sustainability analytics is gaining traction as retailers use environmental metrics to guide sourcing and packaging decisions. Latin American growth concentrates in Brazil and Argentina, where analytics helps manage currency volatility and optimise localised promotions. Middle East and Africa remain smaller but active in markets such as Israel and the United Arab Emirates, where luxury retail and tourism accelerate the adoption of customer experience analytics.
- SAP SE
- IBM Corporation
- Oracle Corporation
- Salesforce Inc. (Tableau)
- SAS Institute Inc.
- QlikTech International AB
- Microsoft Corp. (Power BI, Dynamics 365)
- Amazon Web Services Inc. (QuickSight)
- Google LLC (Looker)
- Blue Yonder Inc.
- Dunnhumby Ltd.
- Teradata Corp.
- RetailNext Inc.
- Zebra Technologies Corp.
- Altair Engineering Inc.
- Alteryx Inc.
- MicroStrategy Inc.
- ThoughtSpot Inc.
- Fujitsu Ltd.
- Infor Inc.
Additional Benefits:
- The market estimate (ME) sheet in Excel format
- 3 months of analyst support
TABLE OF CONTENTS
1 INTRODUCTION
- 1.1 Study Assumptions and Market Definition
- 1.2 Scope of the Study
2 RESEARCH METHODOLOGY
3 EXECUTIVE SUMMARY
4 MARKET LANDSCAPE
- 4.1 Market Overview
- 4.2 Market Drivers
- 4.2.1 Omnichannel data-volume explosion
- 4.2.2 AI/ML advances for real-time prescriptive insights
- 4.2.3 Uptake of cloud analytics lowering ownership costs
- 4.2.4 Demand for hyper-personalised shopping journeys
- 4.3 Market Restraints
- 4.3.1 Data-privacy regulation and compliance costs
- 4.3.2 Legacy IT stacks and analytics skills gap
- 4.4 Supply Chain Analysis
- 4.5 Regulatory Landscape
- 4.6 Technological Outlook
- 4.7 Porter's Five Forces Analysis
- 4.7.1 Threat of New Entrants
- 4.7.2 Bargaining Power of Buyers
- 4.7.3 Bargaining Power of Suppliers
- 4.7.4 Threat of Substitute Products
- 4.7.5 Intensity of Competitive Rivalry
- 4.8 Assessment of the Impact of Macroeconomic Trends on the Market
5 MARKET SIZE AND GROWTH FORECASTS (VALUE)
- 5.1 By Solution
- 5.1.1 Software
- 5.1.2 Services
- 5.2 By Deployment Model
- 5.2.1 Cloud
- 5.2.2 On-premise
- 5.2.3 Hybrid
- 5.3 By Function
- 5.3.1 Customer Management
- 5.3.2 In-store Operation - Inventory Management
- 5.3.3 In-store Operation - Performance Management
- 5.3.4 Supply Chain Management
- 5.3.5 Marketing and Merchandising - Pricing/Yield
- 5.3.6 Other Functions - Transportation Management
- 5.3.7 Other Functions - Order Management
- 5.4 By Retail Format
- 5.4.1 Brick-and-Mortar Stores
- 5.4.2 Pure-play E-commerce
- 5.4.3 Omnichannel Retailers
- 5.5 By Geography
- 5.5.1 North America
- 5.5.1.1 United States
- 5.5.1.2 Canada
- 5.5.1.3 Mexico
- 5.5.2 Europe
- 5.5.2.1 United Kingdom
- 5.5.2.2 Germany
- 5.5.2.3 France
- 5.5.2.4 Italy
- 5.5.2.5 Rest of Europe
- 5.5.3 Asia-Pacific
- 5.5.3.1 China
- 5.5.3.2 Japan
- 5.5.3.3 India
- 5.5.3.4 South Korea
- 5.5.3.5 Rest of Asia-Pacific
- 5.5.4 Middle East
- 5.5.4.1 Israel
- 5.5.4.2 Saudi Arabia
- 5.5.4.3 United Arab Emirates
- 5.5.4.4 Turkey
- 5.5.4.5 Rest of Middle East
- 5.5.5 Africa
- 5.5.5.1 South Africa
- 5.5.5.2 Egypt
- 5.5.5.3 Rest of Africa
- 5.5.6 South America
- 5.5.6.1 Brazil
- 5.5.6.2 Argentina
- 5.5.6.3 Rest of South America
- 5.5.1 North America
6 COMPETITIVE LANDSCAPE
- 6.1 Market Concentration
- 6.2 Strategic Moves
- 6.3 Market Share Analysis
- 6.4 Company Profiles (includes Global level Overview, Market level overview, Core Segments, Financials as available, Strategic Information, Market Rank/Share for key companies, Products & Services, and Recent Developments)
- 6.4.1 SAP SE
- 6.4.2 IBM Corporation
- 6.4.3 Oracle Corporation
- 6.4.4 Salesforce Inc. (Tableau)
- 6.4.5 SAS Institute Inc.
- 6.4.6 QlikTech International AB
- 6.4.7 Microsoft Corp. (Power BI, Dynamics 365)
- 6.4.8 Amazon Web Services Inc. (QuickSight)
- 6.4.9 Google LLC (Looker)
- 6.4.10 Blue Yonder Inc.
- 6.4.11 Dunnhumby Ltd.
- 6.4.12 Teradata Corp.
- 6.4.13 RetailNext Inc.
- 6.4.14 Zebra Technologies Corp.
- 6.4.15 Altair Engineering Inc.
- 6.4.16 Alteryx Inc.
- 6.4.17 MicroStrategy Inc.
- 6.4.18 ThoughtSpot Inc.
- 6.4.19 Fujitsu Ltd.
- 6.4.20 Infor Inc.
7 MARKET OPPORTUNITIES AND FUTURE OUTLOOK
- 7.1 White-space and Unmet-Need Assessment
 零售分析市場:按組件、組織規模和最終用戶分類-2026年至2032年全球預測
 2026年全球零售分析軟體與服務市場報告2026年全球零售分析市場報告
 零售分析市場規模、佔有率、成長率和全球行業分析:按類型、應用和地區分類的洞察,2026-2034 年預測
 零售分析市場分析及預測(至 2035 年):按類型、產品類型、服務、技術、組件、應用、最終用戶、部署類型、功能和解決方案分類
 零售分析市場 - 全球產業規模、佔有率、趨勢、機會、預測(按組件、部署模式、應用、地區和競爭格局分類),2021-2031年
 2026-2030年全球零售分析市場
 日本零售分析市場報告(按組件、功能、部署模式、企業規模和地區分類,2026-2034 年)
 零售分析市場規模、佔有率和成長分析(按部署類型、零售店類型、功能和地區分類)-2026-2033年產業預測零售分析市場-2025-2030 年預測