


 |
市場調查報告書
商品編碼
1851978
亞太地區矽砂:市場佔有率分析、產業趨勢、統計數據和成長預測(2025-2030 年)Asia-Pacific Silica Sand - Market Share Analysis, Industry Trends & Statistics, Growth Forecasts (2025 - 2030) |
||||||
※ 本網頁內容可能與最新版本有所差異。詳細情況請與我們聯繫。
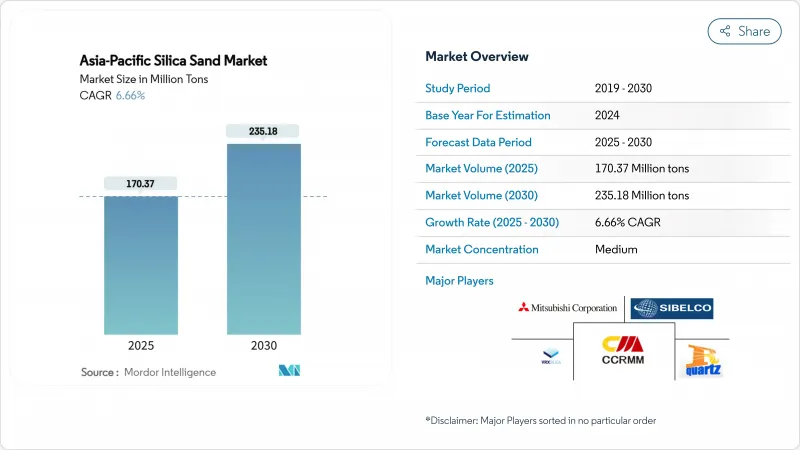
亞太地區矽砂市場規模預計到 2025 年將達到 1.7037 億噸,預計到 2030 年將達到 2.3518 億噸,在預測期(2025-2030 年)內複合年成長率為 6.66%。
包括玻璃製造、電子產品、鑄造應用和建築材料在內的多個需求中心正在匯聚,共同支撐著這項擴張。隨著該地區快速的都市化和汽車生產的推進,平板玻璃和玻璃容器的產量不斷成長,玻璃砂仍然是關鍵產品。同時,隨著半導體製造商推進3奈米以下的設計規範,超高純度石英(HPQ)正從利基市場走向主流市場。大型綜合礦業公司為了獲得高額契約,正在加速自動化和環境合規進程,而小型礦業公司則在努力應對日益嚴格的監管,這使得競爭愈發激烈。中期商業機會主要集中在太陽能玻璃、先進電子產品以及與東南亞地區簽訂遠距供應協議的跨國計劃項目。
亞太地區矽砂市場趨勢及洞察
建築用平板玻璃和玻璃容器的需求激增
預計到2026年,泰國東部經濟走廊將推動建築業每年成長3-4%,從而提振公共工程、商業建築和住宅大樓對平板玻璃和玻璃容器的需求。玻璃製造商將矽砂視為關鍵成本,佔其原料成本的60%以上,因此計劃訂單的增加會直接導致矽砂價格上漲。去庫存化曾導致2024年淨利率下降,但目前已逆轉,多數東協製造商表示,2025年之前的交貨量強勁。東協互聯互通願景下的跨境基礎設施走廊正在促進從馬來西亞和澳洲到中國內陸浮法玻璃生產線的遠距運輸,加劇了有利航線的運力緊張。鑑於玻璃生產對經濟活動的滯後性為6-12個月,此次復甦至少在2027年之前都顯示出明顯的成長潛力。節能型低鐵玻璃可以透過滿足綠建築法規中更薄的嵌裝玻璃標準,從而獲得更高的溢價。
電動車和風力發電的復興
電動車鑄造技術對熱膨脹頻寬的要求越來越窄,這促使鑄造廠尋求粒徑分佈窄的校準矽砂混合物。中國的清潔能源主導(預計到2024年將佔全球產量的70%)推動了鋁和球墨鑄鐵鑄造業的發展,去年全部區域消耗了約910萬噸鑄砂。日本和韓國憑藉其先進的鑄造設備,正向泰國和越南出口承包鑄造生產線,從而帶動了當地對優質砂的需求。這種影響波及到集中在福建省、濟州島和宿霧島的風力發電機輪轂,這些輪轂的最終加工鑄件需要吸收大量的二氧化矽用於機艙殼體和輪轂組件。預計到2024年,清潔能源製造業將獲得2,350億美元的投資,預示著2030年,砂的需求將持續成長。能夠展現出優異抗熱衝擊性能和尺寸精度的生產商正在贏得電池和渦輪機原始設備製造商的多年供應合約。
遏制非法和無序採砂
尤其是在印度,估計有5,200萬工人暴露於二氧化矽粉塵中,促使該國進行了全面的健康和安全改革。新的可吸入結晶二氧化矽暴露限值(50微克/立方米)已設定,並要求進行濕式洗滌和封閉式輸送機等基礎設施改造。在中國,相關部門已經吊銷了數千個小型許可證,並透過集中配額將預計到2025年的供不應求從63%降低到4%。雖然此類打擊行動消除了低成本競爭,但也加強了本地供應,進一步加劇了市場競爭,並導致對高成本產品的依賴。非正規現貨貨物和合約級供應之間的價格波動已經擴大。
細分市場分析
至2024年,玻璃級石英砂將佔亞太地區石英砂出貨量的64.36%,凸顯其作為亞太地區石英砂市場支柱的地位。目前市佔率較小的超高純石英砂(Hyper HPQ)預計將以11.29%的複合年成長率成長,並從2025年起在亞太地區石英砂市場佔據更大的佔有率。
供應安全取決於向自動化選礦生產線、光學分選和符合環保標準的清潔能源窯爐的轉型。能夠證明產品純度達到核能級水平的生產商正在進入半導體產業鏈,而中型供應商則將目光投向了太陽能和光學領域。混合策略正在興起,例如利用日本的化學浸出技術來提升印尼中等純度原料的純度,這表明合作無需新建待開發區即可獲取利潤。
亞太地區矽砂市場報告按等級(鑄造/煉鋼級、玻璃級、光學玻璃級及其他)、終端用戶產業(玻璃製造、鑄造、化學生產、建築及其他)和地區(中國、印度、日本、韓國、印尼、泰國、馬來西亞、新加坡、菲律賓、越南及亞太其他地區)進行細分。市場預測以數量(百萬噸)為單位。
其他福利:
- Excel格式的市場預測(ME)表
- 3個月的分析師支持
目錄
第1章 引言
- 研究假設和市場定義
- 調查範圍
第2章調查方法
第3章執行摘要
第4章 市場情勢
- 市場概覽
- 市場促進因素
- 建築業主導平板玻璃和玻璃容器需求激增
- 電動車和風力發電鑄件的復興
- 東協各地基礎建設投資迅速成長
- 改用節能型低鐵太陽能玻璃
- 印尼半導體二氧化矽下游業務
- 市場限制
- 遏制非法和無序採砂
- 無沙人造建築材料
- 政府對小型礦山進行整合和關閉(吊銷許可證)
- 價值鏈分析
- 波特五力分析
- 供應商的議價能力
- 買方的議價能力
- 新進入者的威脅
- 替代品的威脅
- 競爭程度
第5章 市場規模與成長預測
- 按年級
- 鑄造/煉鋼級
- 玻璃級砂
- 光學玻璃級
- 中級 HPQ
- 超高純度 HPQ
- Hyper HPQ
- 按最終用戶行業分類
- 玻璃製造
- 晶圓代工廠
- 化學品生產
- 建造
- 油漆和塗料
- 陶瓷和耐火材料
- 過濾
- 石油和天然氣
- 其他終端用戶產業
- 按地區
- 中國
- 印度
- 日本
- 韓國
- 印尼
- 泰國
- 馬來西亞
- 新加坡
- 菲律賓
- 越南
- 亞太其他地區
第6章 競爭情勢
- 市場集中度
- 策略性舉措(併購、合資、產能擴張)
- 市佔率(%)/排名分析
- 公司簡介
- Chongqing Changjiang River Moulding Material Group Co., Ltd.
- Covia Holdings LLC
- Diatreme Resources Limited
- Imerys
- JFE Mineral & Alloy Company,Ltd
- Mangal Minerals
- Mitsubishi Corporation
- Raghav Productivity Enhancers Limited
- Sibelco
- Tochu Corporation
- Tosoh Silica Corporation
- VRX Silica
- Xinyi Golden Ruite Quartz Materials Co., Ltd
- Xinyi Solar Holdings Limited
第7章 市場機會與未來展望
The Asia-Pacific Silica Sand Market size is estimated at 170.37 million tons in 2025, and is expected to reach 235.18 million tons by 2030, at a CAGR of 6.66% during the forecast period (2025-2030).
Multiple demand centers, including glass manufacturing, electronics, foundry applications, and construction materials, are converging to sustain this expansion. Glass grade sand remains the workhorse because flat and container glass output tracks the region's rapid urbanization and vehicle production. At the same time, hyper-purity quartz (HPQ) grades are transitioning from a niche toward mainstream status as semiconductor manufacturers push below the 3-nanometer design rule. Competitive intensity is rising as large, integrated miners accelerate automation and environmental compliance to lock in premium contracts while smaller operators struggle to meet tightening regulations. Mid-term opportunities cluster around solar glass, advanced electronics, and cross-border infrastructure projects that lock in long-haul supply contracts across Southeast Asia.
Asia-Pacific Silica Sand Market Trends and Insights
Construction-Led Flat and Container Glass Demand Surge
Thailand's Eastern Economic Corridor is driving 3-4% annual construction growth through 2026, lifting demand for flat and container glass across public works, commercial complexes, and residential towers. Glass manufactures treat silica sand as an essential cost component, often exceeding 60% of raw-material expenses, so rising project backlogs translate directly into higher sand uplift. Inventory corrections that hurt 2024 margins have already reversed, with most ASEAN producers reporting fuller order books for 2025 delivery. Cross-border infrastructure corridors under the ASEAN Connectivity vision are boosting long-distance shipments from Malaysia and Australia to inland Chinese float-glass lines, tightening freight capacity on favored routes. Given that glass output trails economic activity with a 6- to 12-month lag, the rebound indicates a clear volume runway through at least 2027. Energy-efficient low-iron variants secure additional premiums because they enable thinner glazing standards in green-building codes.
Foundry Revival for EV and Wind-Power Castings
Electric-vehicle casting technology increasingly specifies narrow thermal-expansion bands, pushing foundries toward calibrated silica sand blends with tighter grain-size distributions. China's clean-energy leadership, 70% of global output in 2024, created a lift in aluminum and ductile-iron casting that consumed roughly 9.1 million tons of foundry sand region-wide last year. Japan and South Korea, home to advanced molding machinery, are exporting turnkey foundry lines into Thailand and Vietnam, prompting localized demand for premium sand grades. The effect cascades through wind-turbine hubs clustered in Fujian, Jeju, and Cebu, where final-machined castings absorb high silica volumes for nacelle housings and hub assemblies. Investment pipelines worth USD 235 billion in 2024 targeted clean-energy manufacturing, signalling durable sand flows into 2030. Producers that certify thermal-shock performance and dimensional accuracy are capturing multiyear supply contracts from battery and turbine OEMs.
Illegal and Unregulated Sand Mining Curbs
Rising enforcement is shrinking unregistered output across riverine deposits, especially in India, where the estimated 52 million-worker cohort exposed to silica dust has spurred sweeping health-and-safety reforms. New exposure limits - 50 µg/m3 for respirable crystalline silica mandate capital upgrades like wet-scrubbing and enclosed conveyors, adding 4-6% to mining opex for compliant operators. In China, authorities canceled thousands of small-scale licenses, reducing projected 2025 supply gaps from 63% to 4% through centrally managed quotas. Such crackdowns eliminate low-cost competition but tighten local availability, reinforcing the Asia-Pacific silica sand market's reliance on compliant, higher-cost output. Price volatility has already widened between informal spot cargoes and contract-grade supplies.
Other drivers and restraints analyzed in the detailed report include:
- Rapid Infrastructure Spending Across ASEAN
- Indonesia's Silica Downstreaming for Semiconductors
- Substitution by Engineered, Sand-Free Building Materials
For complete list of drivers and restraints, kindly check the Table Of Contents.
Segment Analysis
The glass grade segment captured 64.36% of 2024 shipments, underscoring its role as the backbone of the Asia-Pacific silica sand market. Hyper HPQ, though only a sliver of volume today, is projected to post an 11.29% CAGR, raising its stake in the Asia-Pacific silica sand market size from 2025 onward.
Supply security hinges on automated beneficiation lines, optical sorting, and clean-energy kiln conversions that meet environmental benchmarks. Producers able to certify nuclear-level purity enter the semiconductor chain, while mid-tier suppliers target solar and optics. Blending strategies are emerging, where moderate-purity Indonesian feedstock is upgraded via Japanese chemical leaching, showing how collaboration can capture margin without greenfield development.
The Asia-Pacific Silica Sand Report is Segmented by Grade (Foundry/Smelter Grade, Glass Grade Sand, Optical Glass Grade, and More), End-User Industry (Glass Manufacturing, Foundry, Chemical Production, Construction, and More), and Geography (China, India, Japan, South Korea, Indonesia, Thailand, Malaysia, Singapore, Philippines, Vietnam, and Rest of Asia-Pacific). The Market Forecasts are Provided in Terms of Volume (Million Tons).
List of Companies Covered in this Report:
- Chongqing Changjiang River Moulding Material Group Co., Ltd.
- Covia Holdings LLC
- Diatreme Resources Limited
- Imerys
- JFE Mineral & Alloy Company,Ltd
- Mangal Minerals
- Mitsubishi Corporation
- Raghav Productivity Enhancers Limited
- Sibelco
- Tochu Corporation
- Tosoh Silica Corporation
- VRX Silica
- Xinyi Golden Ruite Quartz Materials Co., Ltd
- Xinyi Solar Holdings Limited
Additional Benefits:
- The market estimate (ME) sheet in Excel format
- 3 months of analyst support
TABLE OF CONTENTS
1 Introduction
- 1.1 Study Assumptions and Market Definition
- 1.2 Scope of the Study
2 Research Methodology
3 Executive Summary
4 Market Landscape
- 4.1 Market Overview
- 4.2 Market Drivers
- 4.2.1 Construction-led flat and container glass demand surge
- 4.2.2 Foundry revival for EV and wind-power castings
- 4.2.3 Rapid infrastructure spending across ASEAN
- 4.2.4 Shift to energy-efficient low-iron solar glass
- 4.2.5 Indonesia's silica downstreaming for semiconductors
- 4.3 Market Restraints
- 4.3.1 Illegal and unregulated sand mining curbs
- 4.3.2 Substitution by engineered, sand-free building materials
- 4.3.3 Government drive to consolidate small mines (license cancellations)
- 4.4 Value Chain Analysis
- 4.5 Porter's Five Forces Analysis
- 4.5.1 Bargaining Power of Suppliers
- 4.5.2 Bargaining Power of Buyers
- 4.5.3 Threat of New Entrants
- 4.5.4 Threat of Substitutes
- 4.5.5 Degree of Competition
5 Market Size and Growth Forecasts (Volume)
- 5.1 By Grade
- 5.1.1 Foundry/Smelter Grade
- 5.1.2 Glass Grade Sand
- 5.1.3 Optical Glass Grade
- 5.1.4 Intermediate HPQ
- 5.1.5 Ultra High HPQ
- 5.1.6 Hyper HPQ
- 5.2 By End-user Industry
- 5.2.1 Glass Manufacturing
- 5.2.2 Foundry
- 5.2.3 Chemical Production
- 5.2.4 Construction
- 5.2.5 Paints and Coatings
- 5.2.6 Ceramics and Refractories
- 5.2.7 Filtration
- 5.2.8 Oil and Gas
- 5.2.9 Other End-user Industries
- 5.3 By Geography
- 5.3.1 China
- 5.3.2 India
- 5.3.3 Japan
- 5.3.4 South Korea
- 5.3.5 Indonesia
- 5.3.6 Thailand
- 5.3.7 Malaysia
- 5.3.8 Singapore
- 5.3.9 Philippines
- 5.3.10 Vietnam
- 5.3.11 Rest of Asia-Pacific
6 Competitive Landscape
- 6.1 Market Concentration
- 6.2 Strategic Moves (Mergers and Acquisitions, JVs, Capacity Expansions)
- 6.3 Market Share (%)**/Ranking Analysis
- 6.4 Company Profiles (includes Global level Overview, Market level overview, Core Segments, Financials as available, Strategic Information, Market Rank/Share for key companies, Products and Services, and Recent Developments)
- 6.4.1 Chongqing Changjiang River Moulding Material Group Co., Ltd.
- 6.4.2 Covia Holdings LLC
- 6.4.3 Diatreme Resources Limited
- 6.4.4 Imerys
- 6.4.5 JFE Mineral & Alloy Company,Ltd
- 6.4.6 Mangal Minerals
- 6.4.7 Mitsubishi Corporation
- 6.4.8 Raghav Productivity Enhancers Limited
- 6.4.9 Sibelco
- 6.4.10 Tochu Corporation
- 6.4.11 Tosoh Silica Corporation
- 6.4.12 VRX Silica
- 6.4.13 Xinyi Golden Ruite Quartz Materials Co., Ltd
- 6.4.14 Xinyi Solar Holdings Limited
7 Market Opportunities and Future Outlook
- 7.1 White-space and Unmet-need Assessment
 工業矽砂:全球市佔率及排名、總收入及需求預測(2025-2031年)
 清洗矽砂的全球市場:鐵分含有量,用途,流通管道,產業,各地區 - 市場規模,產業趨勢,機會分析,預測(2025年~2033年)
 按類型、形式和應用分類的洗淨矽砂市場—2025-2032 年全球預測
 矽砂市場-全球產業規模、佔有率、趨勢、機會及預測(按等級、應用、區域及競爭細分,2020-2030 年)
 全球清洗矽砂市場
 全球矽砂市場:預測(2025-2030)
 2025年全球矽砂市場報告
 清洗矽砂市場規模、佔有率、成長分析(按粒度、鐵含量、應用和地區)- 產業預測,2025 年至 2032 年
 日本矽砂市場報告(依最終用途(玻璃工業、鑄造、水力壓裂、過濾、磨料等)及地區)2025-2033
 2032 年清洗矽砂市場預測:按類型、等級、分銷管道、應用和地區進行的全球分析