


 |
市場調查報告書
商品編碼
1851822
智慧建築:市場佔有率分析、產業趨勢、統計數據和成長預測(2025-2030 年)Smart Building - Market Share Analysis, Industry Trends & Statistics, Growth Forecasts (2025 - 2030) |
||||||
※ 本網頁內容可能與最新版本有所差異。詳細情況請與我們聯繫。
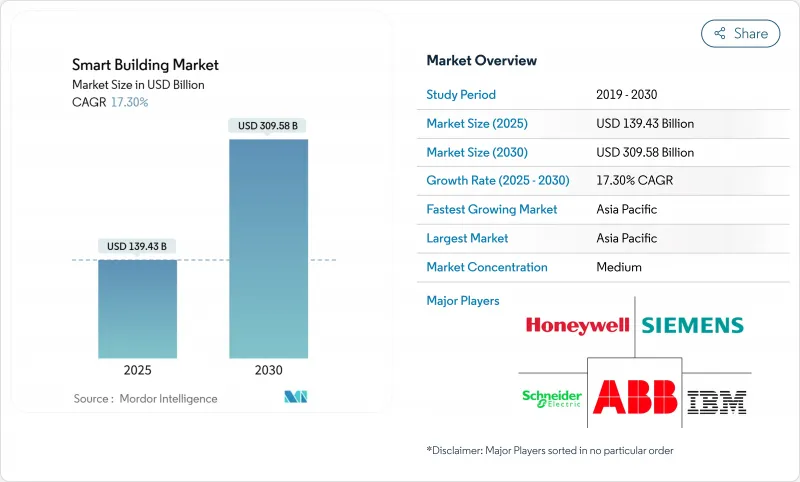
預計到 2025 年,智慧建築市場規模將達到 1,394.3 億美元,到 2030 年將達到 3,095.8 億美元,年複合成長率為 17.30%。
操作技術和資訊科技的日益融合,以及即時分析的運用,正將建築從被動資產轉變為主動能源節點。業主希望將照明、暖通空調、安防和能源管理整合到單一平台上,因此網路安全和開放式架構比專有系統更受青睞。為了使商業房地產組合符合淨零排放路徑,維修;同時,公用事業公司透過新的收費系統,鼓勵建築採用需量反應。在亞太地區,中國和印度正在大力推動國家智慧城市計劃,強制要求建造互聯互通的建築基礎設施,從而推動了相關技術的普及。
全球智慧建築市場趨勢與洞察
日益嚴格的淨零碳排放法規推動了全面的建築維修
淨零排放法規要求進行大規模的節能維修,因為建築排放排放全球排放的40%。針對整個建築群的強制性要求正促使業主安裝高效節能的暖通空調系統、實現暖氣電氣化,並採用分析技術來檢驗性能。 ABB 估計,隨著脫碳期限的臨近,到2050年,維修機會可能達到3.9兆美元。各地對節能定義的差異正在推動地方創新,許多城市的節能標準都超過了國家目標。
物聯網感測器的普及將實現即時建築智慧。
不斷擴展的感測器網路使營運商能夠精細地了解人員居住情況、設備運作狀況和室內空氣品質。到2025年,中國將擁有3,100萬棟智慧建築,美國將擁有1,600萬棟。江森自控的OpenBlue等平台將原始資料轉化為預測性控制,已證實可達到10%至12%的節能效果。隨著工業感測器銷售額在2025年接近299億美元,對低功耗無線感測器的需求正在不斷成長。
傳統電池管理系統通訊協定的碎片化阻礙了系統整合。
老舊的建築管理系統採用專有通訊協定,這使得維修變得複雜。 2024 年 MDPI 的評估報告指出,這種分散是最大的障礙,常常迫使業主部署中間件或更換整個子系統。整合延遲會增加計劃成本,並可能削弱進階分析的商業價值。
細分市場分析
到2024年,解決方案將佔總收入的68%,這反映出它們在照明控制、安防整合和能源管理方面的核心作用。雲端原生建築管理系統正在取代本地伺服器,從而減少升級停機時間並實現功能快速部署。服務業務佔比雖小,但正以17.68%的複合年成長率成長,因為業主將分析、網路安全監控和生命週期維護等業務外包。這種轉變緩解了企業內部技能短缺的問題,同時也為供應商提供了持續的收入來源。
開放API的普及促進了解決方案提供者與專業服務公司之間的夥伴關係。智慧建築市場正在出現將託管服務協議與基於結果的保證捆綁在一起的現象,供應商承諾達到節能閾值。隨著人工智慧模組的整合,對持續調整和模型重新訓練的需求將會增加,從而進一步推動服務的成長。
有線乙太網路、BACnet MS/TP 和乙太網路供電 (PoE) 仍連接 55.2% 的智慧型設備,但無線設備的安裝正以 18.8% 的複合年成長率成長。無線通訊協定為傳統建築中不便進行鑽孔佈線的場所提供了靈活的安裝方式。 Wi-Fi 6/6E 為視訊分析提供了更高的頻寬,而 Zigbee 和 Thread 則適用於低功耗感測器。 DECT NR+ 為密集設備叢集提供Sub-GHz頻段覆蓋,並且是目前西門子和Schneider Electric認可的標準。
設備密集化正推動設計轉向多重通訊協定網路基地台,將藍牙信標、LoRaWAN 計量器和 5G 閘道連接到統一的主幹網路。網路安全加固的網狀架構使邊緣設備能夠自主協商憑證,從而縮短試運行時間。
區域分析
亞太地區將在2024年以31.7%的市佔率引領智慧建築市場,並在2030年之前維持20.4%的最快複合年成長率。中國、韓國和新加坡的國家智慧城市計畫正在強制推行互聯建築系統,以提供全市範圍的數位雙胞胎數據。在印度,甲級商業房地產正在擴展應用智慧照明、空氣品質感測器和可再生微電網。
在公用事業需量反應計畫和強制性碳舉措揭露的推動下,北美地區也紛紛效法。美國的「更佳建築計劃」已記錄了220億美元的節能效益,並透過分析證明了維修的經濟合理性。加拿大國家建築規範現已提及與智慧電錶相容的控制系統,鼓勵在當地廣泛採用。
在歐洲,歐盟分類體系、建築能源性能指令和翻新浪潮戰略都體現了高度的政策一致性。資料主權規則鼓勵邊緣運算,因此供應商正在提供結合雲端儀錶板的現場人工智慧推理引擎。斯堪地那維亞在區域供熱整合方面處於領先地位,而德國正在推廣智慧電錶閘道器,以便將安全的載入資料通訊給電網營運商。
其他福利:
- Excel格式的市場預測(ME)表
- 3個月的分析師支持
目錄
第1章 引言
- 研究假設和市場定義
- 調查範圍
第2章調查方法
第3章執行摘要
第4章 市場情勢
- 市場概覽
- 市場促進因素
- 經合組織商業不動產淨零碳排放要求日益提高
- 物聯網感測器的普及將推動即時分析的發展。
- 融合的OT-IT網路安全框架支援整合平台
- 北美公用事業需量反應獎勵加速智慧維修
- 亞洲的城市校園正在迅速採用數位雙胞胎來加強其營運。
- 歐盟稅收要求促進綠建築投資
- 市場限制
- 碎片化的傳統電池管理系統通訊協定阻礙了現有庫存的互通性
- 2024年起半導體密集型設備的資本支出通膨狀況
- 資料隱私問題限制了歐洲雲端基礎的建築分析應用。
- 新興市場人工智慧賦能設施管理技能缺口
- 價值鏈分析
- 監理與技術展望
- 波特五力分析
- 新進入者的威脅
- 買方的議價能力
- 供應商的議價能力
- 替代品的威脅
- 競爭對手之間的競爭
- 投資分析
- 宏觀經濟因素如何影響市場
第5章 市場規模與成長預測
- 按組件
- 解決方案
- 建築能源管理系統
- 基礎設施管理系統
- 智慧安防系統
- 照明控制系統
- 暖通空調控制系統
- 其他解決方案
- 服務
- 專業服務
- 託管服務
- 解決方案
- 透過連接技術
- 有線
- 無線的
- Wi-Fi
- ZigBee/Z-Wave
- Bluetooth Low Energy
- 6LoWPAN 和其他
- 透過建構生命週期
- 新建設
- 改裝
- 依建築類型
- 住房
- 商業
- 辦公室
- 零售
- 飯店業
- 機場和交通樞紐
- 工業與物流
- 設施(醫療保健、教育、政府)
- 按地區
- 北美洲
- 美國
- 加拿大
- 墨西哥
- 南美洲
- 巴西
- 阿根廷
- 其他南美洲國家
- 歐洲
- 德國
- 英國
- 法國
- 義大利
- 西班牙
- 其他歐洲地區
- 中東
- 沙烏地阿拉伯
- 阿拉伯聯合大公國
- 土耳其
- 其他中東地區
- 非洲
- 南非
- 奈及利亞
- 肯亞
- 其他非洲地區
- 亞太地區
- 中國
- 印度
- 日本
- 韓國
- ASEAN
- 亞太其他地區
- 北美洲
第6章 競爭情勢
- 市場集中度
- 策略趨勢
- 市佔率分析
- 公司簡介
- Honeywell International Inc.
- Siemens AG
- Schneider Electric SE
- Johnson Controls International plc
- ABB Ltd.
- Cisco Systems Inc.
- IBM Corporation
- Huawei Technologies Co., Ltd.
- Legrand SA
- Emerson Electric Co.
- Delta Electronics, Inc.
- Robert Bosch GmbH
- Hitachi, Ltd.
- United Technologies Corp.(Carrier)
- Trane Technologies plc
- Avnet, Inc.(IoTConnect)
- Softdel(UNIDEL Group)
- Verdigris Technologies, Inc.
- KMC Controls, Inc.
- BuildingIQ, Inc.
第7章 市場機會與未來展望
The smart building market is valued at USD 139.43 billion in 2025 and is forecast to reach USD 309.58 billion by 2030, advancing at a 17.30% CAGR.
Enhanced integration of operational technology and information technology, combined with real-time analytics, is converting buildings from passive assets into active energy nodes. Cyber-secure, open architectures are being selected ahead of proprietary systems as owners seek to unify lighting, HVAC, security, and energy management on a single platform. Retrofit demand is climbing because commercial real-estate portfolios must align with net-zero pathways, while utilities are rewarding buildings that automate demand response with new tariff structures. Asia Pacific leads adoption as China and India scale national smart-city programs that mandate connected building infrastructure.
Global Smart Building Market Trends and Insights
Escalating Net-Zero Carbon Mandates Driving Comprehensive Building Retrofits
Net-zero regulations require deep energy refurbishment because buildings generate 40% of global emissions. Mandates covering whole portfolios are pushing owners to install high-efficiency HVAC, electrify heat, and layer analytics that verify performance. ABB estimates the retrofit opportunity could reach USD 3.9 trillion by 2050 as decarbonization deadlines shorten. Regional differences in definitions are accelerating local innovation, with many city codes surpassing national targets.
IoT Sensor Proliferation Enabling Real-Time Building Intelligence
An expanding sensor base is giving operators granular visibility into occupancy, equipment health, and indoor-air quality. China hosts 31 million smart buildings, while the United States has 16 million as of 2025. Platforms such as Johnson Controls' OpenBlue have documented 10%-12% energy savings by turning raw data into prescriptive controls. Demand for low-power wireless sensors is rising as industrial sensor revenue approaches USD 29.9 billion in 2025.
Legacy BMS Protocol Fragmentation Impeding System Integration
Older Building Management Systems use proprietary protocols that complicate retrofits. A 2024 MDPI review identified this fragmentation as a top barrier, often forcing owners to deploy middleware or replace entire subsystems. Integration delays raise project costs and can erode the business case for advanced analytics.
Other drivers and restraints analyzed in the detailed report include:
- OT-IT Cybersecurity Convergence Enabling Integrated Building Platforms
- Utility Demand-Response Programs Accelerating Smart Building Adoption
- Semiconductor Supply-Chain Volatility Impacting Device Availability
For complete list of drivers and restraints, kindly check the Table Of Contents.
Segment Analysis
Solutions generated 68% of 2024 revenue, reflecting their central role in lighting control, security integration, and energy management. Cloud-native Building Management Systems are replacing on-premise servers, cutting upgrade downtime and enabling faster feature deployment. Services hold a smaller share but are growing at 17.68% CAGR as owners outsource analytics, cybersecurity monitoring, and lifecycle maintenance. This shift is easing internal skill shortages while creating recurring revenue streams for vendors.
Wider availability of open APIs is driving partnerships between solution providers and specialist service firms. The smart building market is seeing managed-service contracts bundled with outcome-based guarantees that commit vendors to energy-saving thresholds. As artificial-intelligence modules become embedded, demand for continuous tuning and model retraining rises, reinforcing service growth.
Wired Ethernet, BACnet MS/TP, and power-over-Ethernet still connect 55.2% of smart devices, but wireless installations are expanding at an 18.8% CAGR. Radio protocols offer install flexibility for heritage buildings where core drilling is impractical. Wi-Fi 6/6E enhances bandwidth for video analytics, while Zigbee and Thread handle low-power sensors. DECT NR+ introduces sub-GHz coverage for dense device clusters, a standard now backed by Siemens and Schneider Electric.
Growing device density is shifting designs toward multi-protocol access points that coordinate Bluetooth beacons, LoRaWAN meters, and 5G gateways on a converged backbone. Cyber-hardened mesh architectures allow edge devices to negotiate credentials autonomously, cutting commissioning time.
The Smart Building Market Report is Segmented by Component (Solutions and Services), Connectivity Technology (Wired and Wireless), Building Lifecycle (New Construction and Retrofit), Building Type (Residential, Commercial, Industrial and Logistics, and More), and Geography
Geography Analysis
Asia Pacific led the smart building market with a 31.7% share in 2024 and will maintain the fastest 20.4% CAGR through 2030. National smart-city programs in China, South Korea, and Singapore mandate connected building systems that feed city-wide digital twins. India's Grade-A commercial real estate expansion is also embedding intelligent lighting, air-quality sensors, and renewable microgrids.
North America follows closely, propelled by utility demand-response programs and mandatory carbon-performance disclosure. The U.S. Better Buildings Initiative has already logged USD 22 billion in savings, validating the financial case for analytics retrofits. Canada's national building code now references smart-meter-compatible controls, nudging regional adoption.
Europe shows strong policy alignment via the EU Taxonomy, Energy Performance of Buildings Directive, and Renovation Wave strategy. Data-sovereignty rules encourage edge computing, so vendors supply on-site AI inference engines coupled with cloud dashboards. Scandinavia is pioneering district heating integration, while Germany expands smart-meter gateways that communicate secure load data to grid operators.
- Honeywell International Inc.
- Siemens AG
- Schneider Electric SE
- Johnson Controls International plc
- ABB Ltd.
- Cisco Systems Inc.
- IBM Corporation
- Huawei Technologies Co., Ltd.
- Legrand SA
- Emerson Electric Co.
- Delta Electronics, Inc.
- Robert Bosch GmbH
- Hitachi, Ltd.
- United Technologies Corp. (Carrier)
- Trane Technologies plc
- Avnet, Inc. (IoTConnect)
- Softdel (UNIDEL Group)
- Verdigris Technologies, Inc.
- KMC Controls, Inc.
- BuildingIQ, Inc.
Additional Benefits:
- The market estimate (ME) sheet in Excel format
- 3 months of analyst support
TABLE OF CONTENTS
1 INTRODUCTION
- 1.1 Study Assumptions and Market Definition
- 1.2 Scope of the Study
2 RESEARCH METHODOLOGY
3 EXECUTIVE SUMMARY
4 MARKET LANDSCAPE
- 4.1 Market Overview
- 4.2 Market Drivers
- 4.2.1 Escalating Net-Zero Carbon Mandates in OECD Commercial Real Estate
- 4.2.2 Proliferation of Building IoT Sensor Deployments Driving Real-time Analytics
- 4.2.3 Convergence of OT-IT Cyber-security Frameworks Enabling Integrated Platforms
- 4.2.4 Utility Demand-Response Incentives Accelerating Smart Retrofits in North America
- 4.2.5 Rapid Urban Campus Digital-Twin Deployments in Asia for Operational Resilience
- 4.2.6 EU Taxonomy Requirements Boosting Green Building Investments
- 4.3 Market Restraints
- 4.3.1 Fragmented Legacy BMS Protocols Hindering Interoperability in Existing Stock
- 4.3.2 Capex Inflation for Semiconductor-Intensive Devices Post-2024 Shortage
- 4.3.3 Data-privacy Concerns Limiting Cloud-based Building Analytics in Europe
- 4.3.4 Skills Gap in AI-enabled Facility Management across Emerging Markets
- 4.4 Value Chain Analysis
- 4.5 Regulatory and Technological Outlook
- 4.6 Porter's Five Forces Analysis
- 4.6.1 Threat of New Entrants
- 4.6.2 Bargaining Power of Buyers
- 4.6.3 Bargaining Power of Suppliers
- 4.6.4 Threat of Substitutes
- 4.6.5 Intensity of Competitive Rivalry
- 4.7 Investment Analysis
- 4.8 Impact of Macroeconomic Factors on the Market
5 MARKET SIZE AND GROWTH FORECASTS (VALUE)
- 5.1 By Component
- 5.1.1 Solutions
- 5.1.1.1 Building Energy Management Systems
- 5.1.1.2 Infrastructure Management Systems
- 5.1.1.3 Intelligent Security Systems
- 5.1.1.4 Lighting Control Systems
- 5.1.1.5 HVAC Control Systems
- 5.1.1.6 Other Solutions
- 5.1.2 Services
- 5.1.2.1 Professional Services
- 5.1.2.2 Managed Services
- 5.1.1 Solutions
- 5.2 By Connectivity Technology
- 5.2.1 Wired
- 5.2.2 Wireless
- 5.2.2.1 Wi-Fi
- 5.2.2.2 ZigBee / Z-Wave
- 5.2.2.3 Bluetooth Low Energy
- 5.2.2.4 6LoWPAN and Others
- 5.3 By Building Lifecycle
- 5.3.1 New Construction
- 5.3.2 Retrofit
- 5.4 By Building Type
- 5.4.1 Residential
- 5.4.2 Commercial
- 5.4.2.1 Office
- 5.4.2.2 Retail
- 5.4.2.3 Hospitality
- 5.4.2.4 Airports and Transportation Hubs
- 5.4.3 Industrial and Logistics
- 5.4.4 Institutional (Healthcare, Education, Government)
- 5.5 By Geography
- 5.5.1 North America
- 5.5.1.1 United States
- 5.5.1.2 Canada
- 5.5.1.3 Mexico
- 5.5.2 South America
- 5.5.2.1 Brazil
- 5.5.2.2 Argentina
- 5.5.2.3 Rest of South America
- 5.5.3 Europe
- 5.5.3.1 Germany
- 5.5.3.2 United Kingdom
- 5.5.3.3 France
- 5.5.3.4 Italy
- 5.5.3.5 Spain
- 5.5.3.6 Rest of Europe
- 5.5.4 Middle East
- 5.5.4.1 Saudi Arabia
- 5.5.4.2 United Arab Emirates
- 5.5.4.3 Turkey
- 5.5.4.4 Rest of Middle East
- 5.5.5 Africa
- 5.5.5.1 South Africa
- 5.5.5.2 Nigeria
- 5.5.5.3 Kenya
- 5.5.5.4 Rest of Africa
- 5.5.6 Asia Pacific
- 5.5.6.1 China
- 5.5.6.2 India
- 5.5.6.3 Japan
- 5.5.6.4 South Korea
- 5.5.6.5 ASEAN
- 5.5.6.6 Rest of Asia Pacific
- 5.5.1 North America
6 COMPETITIVE LANDSCAPE
- 6.1 Market Concentration
- 6.2 Strategic Moves
- 6.3 Market Share Analysis
- 6.4 Company Profiles (includes Global level Overview, Market level overview, Core Segments, Financials as available, Strategic Information, Market Rank/Share for key companies, Products and Services, and Recent Developments)
- 6.4.1 Honeywell International Inc.
- 6.4.2 Siemens AG
- 6.4.3 Schneider Electric SE
- 6.4.4 Johnson Controls International plc
- 6.4.5 ABB Ltd.
- 6.4.6 Cisco Systems Inc.
- 6.4.7 IBM Corporation
- 6.4.8 Huawei Technologies Co., Ltd.
- 6.4.9 Legrand SA
- 6.4.10 Emerson Electric Co.
- 6.4.11 Delta Electronics, Inc.
- 6.4.12 Robert Bosch GmbH
- 6.4.13 Hitachi, Ltd.
- 6.4.14 United Technologies Corp. (Carrier)
- 6.4.15 Trane Technologies plc
- 6.4.16 Avnet, Inc. (IoTConnect)
- 6.4.17 Softdel (UNIDEL Group)
- 6.4.18 Verdigris Technologies, Inc.
- 6.4.19 KMC Controls, Inc.
- 6.4.20 BuildingIQ, Inc.
7 MARKET OPPORTUNITIES AND FUTURE OUTLOOK
- 7.1 White-space and Unmet-need Assessment
 智慧建築市場-全球產業規模、佔有率、趨勢、機會與預測:按服務、解決方案類型、建築類型、地區和競爭格局分類,2021-2031年
 智慧建築市場:按組件、連接方式、部署模式、建築類型、應用和最終用戶分類-2026-2032年全球市場預測
 2026年全球智慧建築(非住宅建築)市場報告2026年全球辦公大樓市場報告
 全球智慧建築市場規模、佔有率、趨勢和成長分析報告(2026-2034年)
 建築能源模擬軟體市場分析與預測(至2035年):類型、產品類型、服務、技術、組件、應用、部署、最終用戶、功能、解決方案2026年全球建築能源模擬軟體市場報告2026年智慧建築與基礎設施人工智慧全球市場報告2026年智慧建築領域五大成長機遇智慧建築市場分析及預測(至2035年):依類型、產品類型、服務、技術、組件、應用、設備、部署類型及最終用戶分類