


 |
市場調查報告書
商品編碼
1788492
智慧建築市場:2025-2030年Smart Buildings Market: 2025-2030 |
||||||
工業智慧建築:到 2030 年,能源浪費減少和專業垂直解決方案將推動採用率提升 525%
| 主要統計 | ||
|---|---|---|
| 到2030 年部署的智慧建築感測器總數: | 4萬8,670 | |
| 到 2030 年智慧建築總收入: | 147億 | |
| 到2030年為止的智慧大樓總收益: | 1,706億美元 | |
| 預測期間: | 2025-2030年 | |
本研究套件深入分析和評估了硬體和軟體服務供應商如何利用物聯網和人工智慧。
本報告涵蓋 61 個國家/地區,涵蓋商業、工業和住宅三大細分市場的市場規模和預測。此外,報告還包含一份市場格局和策略文件,對主要趨勢、挑戰和利害關係人建議進行了全面評估。
本報告完全以英文撰寫。
主要的特徵
- 關鍵要點和策略建議:本報告深入分析了智慧建築市場的關鍵發展機會和洞察,並為利害關係人提供了重要的策略建議。
- 市場動態:深入分析市場中的關鍵趨勢和市場擴張挑戰、智慧樓宇系統高度技術性所帶來的挑戰、消費者和樓宇管理者對安全性、隱私性和工業 5.0 未來影響的持續擔憂,並分析市場中的經濟驅動因素(按能源消耗和碳足跡驅動計算的能源成本、促進能源成本的零目標)和技術和技術驅動因素(跟踪能源化)。此外,報告還包含 61 個國家的市場成長分析,並提供未來展望。
- 基準產業預測:智慧建築服務供應商的業務概覽,包括商業、工業和住宅領域的智慧建築技術總收入預測。
- Juniper Research 競爭力排行榜:評估 18 家領先網路營運商的能力。
樣品view
市場資料·預測PDF報告
樣品
市場趨勢·策略報告
市場數據與預測
此研究套件包含 48 個表格和超過 33,000 個資料點的完整預測資料。此研究套件包含以下指標:
- 智慧建築部署數量
- 智慧建築感測器採用數量
- 智慧建築感測器硬體收入
- 智慧建築平台收入
- 智慧建築市場價值
這些指標涵蓋以下主要市場:
- 商業用
- 產業用
- 住宅用
Juniper Research 互動式預測 Excel 包含以下功能:
- 統計分析:顯示資料期間所有地區和國家的統計分析。圖表易於編輯,並可匯出至剪貼簿。
- 國家/地區資料工具:此工具可讓您查看預測期間內所有地區和國家的指標。您可以使用搜尋欄縮小查看指標的範圍。
- 國家比較工具:您可以選擇要比較的國家。此工具包含匯出圖表的功能。
- 假設分析:透過五個互動式場景,使用者可以比較不同的預測假設。
競爭排行榜報告
競爭力排行榜包括以下主要公司:
|
|
目錄
市場趨勢與策略
第1章 重要點和策略性建議
- 重要點
- 策略性建議
第2章 市場概要與未來形勢
- 市場概要
- 傳統大樓 vs 智慧建築
- 推動市場要素
- 科技加速發展
- MBSaaS(樓宇管理軟體即服務,即系統即服務)
- 政府法規與舉措
- 智慧工作環境的需求趨勢
- 課題
- 安全與網路安全威脅
- 隱私
- 高技術與基礎架構部署成本
- 可靠的網路連接
- 複雜性與技術整合
第3章 與市場趨勢經營模式分析
- 智慧建築市場趨勢
- 5G
- 高資料吞吐量和低延遲
- 可靠性
- 安全性
- 6G 對智慧建築的影響
- 工業 4.0 和 5.0
- 安全
- 物理的保全
- 網路安全
- 其他技術領域
- 經營模式分析
競爭排行榜
第1章 Juniper Research的競爭的排行榜
- 智慧建築-業者簡介
- ABB
- Avnet
- Bosch
- Carrier Global Corporation
- Cisco
- Delta Controls
- Hitachi
- Honeywell
- Huawei
- IBM
- Intel
- Johnson Controls
- Legrand
- Schneider Electric
- Siemens
- Telit Cinterion
- Verdigris Technologies
- Boldyn Networks
- 評估手法
- 限制與解釋
- 相關調查
資料·預測
第1章 市場資料·預測
- 智慧建築市場概要
- 智慧建築預測
- 智慧大樓總數
- 智慧建築總收益
- 商業用智慧建築總數
- 產業用智慧建築總數
- 住宅用智慧建築總數
'Industrial Smart Buildings: Energy Wastage and Bespoke Vertical Solutions to Drive 525% Surge in Deployments by 2030'
| KEY STATISTICS | |
|---|---|
| Total smart building deployments by 2030: | 486.7m |
| Total smart building sensor deployments by 2030: | 14.7bn |
| Total smart building revenue by 2030: | $170.6bn |
| Forecast period: | 2025-2030 |
Overview
Our "Smart Buildings" research suite provides in-depth analysis and evaluation of how hardware and software service providers are reimagining smart building solutions as living ecosystems, using Internet of Things (IoT) and AI.
The suite includes a data deliverable; sizing the market and providing key forecast data across 61 countries and three market segments - Commercial, Industrial, and Residential. It also includes a Market Trends and Strategies document, which gives a complete assessment of the key trends, challenges, and recommendations for stakeholders. Collectively, they provide a critical tool for understanding this rapidly emerging market; allowing building automation vendors, IoT vendors, energy consumption management vendors, and smart building vendors to shape their future strategy.
All report content is delivered in the English language.
Key Features
- Key Takeaways & Strategic Recommendations: In-depth analysis of key development opportunities and findings within the smart buildings market; accompanied by key strategic recommendations for stakeholders.
- Market Dynamics: Insights into key trends and market expansion challenges within the market; addressing challenges posed by the highly technical nature of smart building systems, as well as ongoing consumer and building manager fears regarding security, privacy and the future impacts of industry 5.0. It analyses economical drivers (energy costs from energy consumption and carbon emission tracking, and net zero goals driving energy efficiency) as well as technological drivers (smart technology such as IoT technologies and digital transformation) within the market. Our Smart Buildings market research also includes a regional market growth analysis on the current development and segment growth of the smart building market in 61 countries; providing a future outlook.
- Benchmark Industry Forecasts: The business overview of smart building service providers includes forecasts for total revenue for smart building technologies, split by commercial, industrial, and residential sectors.
- Juniper Research Competitor Leaderboard: Key player capability and capacity assessment for 18 network operators, via the Juniper Research Competitor Leaderboard.
SAMPLE VIEW
Market Data & Forecasts PDF Report
The numbers tell you what's happening, but our written report details why, alongside the methodologies.
SAMPLE VIEW
Market Trends & Strategies Report
A comprehensive analysis of the current market landscape, alongside strategic recommendations.
Market Data & Forecasts
The market-leading research suite for the "Smart Buildings" market includes access to the full set of forecast data of 48 tables and over 33,000 datapoints. Metrics in the research suite include:
- Smart Building Deployments
- Smart Building Sensors Deployed
- Smart Building Sensor Hardware Revenue
- Smart Building Platform Revenue
- Smart Building Market Value
These metrics are provided for the following key market verticals:
- Commercial
- Industrial
- Residential
Juniper Research Interactive Forecast Excel contains the following functionality:
- Statistics Analysis: Users benefit from the ability to search for specific metrics; displayed for all regions and countries across the data period. Graphs are easily modified and can be exported to the clipboard.
- Country Data Tool: This tool allows users to look at metrics for all regions and countries in the forecast period. Users can refine the metrics displayed via a search bar.
- Country Comparison Tool: Users can select and compare countries. The ability to export graphs is included in this tool.
- What-if Analysis: Here, users can compare forecast metrics against their own assumptions, via five interactive scenarios.
Market Trends & Strategies Report
This report evaluates the global market for smart buildings. It considers the key technical differences between legacy and smart technology, and the challenges in bridging the gap between them going forwards. It also analyses different business models for deploying smart buildings and their pros and cons. Furthermore, it includes Juniper Research's ultimate Key Takeaways and Strategic Recommendations for the smart buildings market; summarising all its analysis.
Competitor Leaderboard Report
This market study includes a Competitor Leaderboard report, which provides detailed evaluation and market positioning of 18 smart buildings vendors. The vendors are positioned as established leaders, leading challengers, or disruptors and challengers, based on product and capability assessments.
Juniper Research's Competitor Leaderboard for Smart Buildings includes the following key players:
|
|
This report is centred around the Juniper Research Competitor Leaderboard; a vendor positioning tool that provides an at-a-glance view of the competitive landscape in a market, backed by a robust methodology.
Table of Contents
Market Trends & Strategies
1. Key Takeaways & Strategic Recommendations
- 1.1. Key Takeaways
- 1.2. Strategic Recommendations
2. Market Overview & Future Landscape
- 2.1.1. Market Overview
- Figure 2.1: Smart Building Technology
- 2.1.2. Traditional vs Smart
- i. Smart Building Sectors
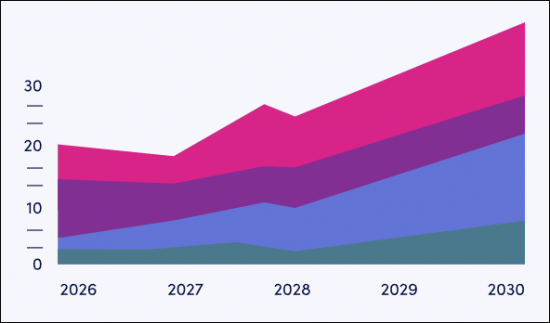
- Figure 2.2: Total Smart Building Deployments, Split by Segment (m), 2025-2030
- i. Smart Building Sectors
- 2.1.3. Market Drivers
- i. Technological Acceleration
- ii. Building Management Systems-as-a-Service (MBSaaS)
- iii. Government Regulation and Initiatives
- iv. Demand Trends for Smart Working Environments
- 2.1.4. Challenges
- i. Security and Cyber Security Threats
- ii. Privacy
- iii. High Cost of Technological and Infrastructural Implementation
- iv. Reliable Network Connection
- v. Complexity and Technological Integration
3. Market Trends & Business Model Analysis
- 3.1. Smart Buildings Market Trends
- Figure 3.1: Smart Buildings Market Revenue ($m) Split by 8 Key Regions, 2021-2030
- 3.1.1 5G
- i. High Data Throughput and Lower Latency
- ii. Reliability
- iii. Security
- Figure 3.1: Proportion of SIMs That Are 5G, Split by 8 Key Regions, 2025-2030
- iv. How 6G Will Impact Smart Buildings
- Figure 3.2: Average Number of Sensors per Residential Smart Building Deployment (m), Split by 8 Key Regions, 2025-2030
- 3.1.2. Industry 4.0 and 5.0
- 3.1.3. Security
- i. Physical Security
- ii. Cyber Security
- 3.1.4. Other Technical Areas
- 3.2. Business Model Analysis
- i. Buying
- ii. Leasing
- iii. Smart Financing
- iv. As-a-Service
- v. Summary
Competitor Leaderboard
1. Juniper Research Competitor Leaderboard
- 1.1. Why Read this Report
- Table 1.1: Juniper Research Competitor Leaderboard: Smart Buildings Market - Vendors Products & Portfolio
- Figure 1.2: Juniper Research Competitor Leaderboard: Smart Buildings Vendors
- Source: Juniper ResearchTable 1.3: Juniper Research Competitor Leaderboard: Smart Buildings Market -18 Vendors
- Table 1.4: Juniper Research Competitor Leaderboard Heatmap - Smart Buildings Vendors (1 of 2)
- Table 1.5: Juniper Research Competitor Leaderboard Heatmap - Smart Buildings Vendors (2 of 2)
- 1.2. Smart Buildings - Vendor Profiles
- 1.2.1. ABB
- i. Corporate
- Table 1.6: ABB's Financial Snapshot ($m), 2022-2025
- ii. Geographical Spread
- iii. Key Clients & Strategic Partnerships
- iv. High-level View of Offerings
- v. Juniper Research's View: Key Strengths & Strategic Opportunities
- i. Corporate
- 1.2.2. Avnet
- i. Corporate
- Table 1.7: Avnet's Financial Snapshot ($m), 2022-2024
- ii. Geographical Spread
- iii. Key Clients & Strategic Partnerships
- iv. High-level View of Offerings
- v. Juniper Research's View: Key Strengths & Strategic Development Opportunities
- i. Corporate
- 1.2.3. Bosch
- i. Corporate
- Table 1.8: Bosch's Financial Snapshot ($m), 2021-2024
- ii. Geographical Spread
- iii. Key Clients & Strategic Partnerships
- iv. High-level View of Offerings
- v. Juniper Research's View: Key Strengths & Strategic Development Opportunities
- i. Corporate
- 1.2.4. Carrier Global Corporation
- i. Corporate
- Table 1.9: Carrier's Financial Snapshot ($m), 2022-2024
- ii. Geographical Spread
- iii. Key Clients & Strategic Partnerships
- iv. High-level View of Offerings
- v. Juniper Research's View: Key Strengths & Strategic Development Opportunities
- i. Corporate
- 1.2.5. Cisco
- i. Corporate
- Table 1.10: Cisco's Financial Snapshot ($m), 2022-2024
- ii. Geographical Spread
- iii. Key Clients & Strategic Partnerships
- iv. High-level View of Offerings
- v. Juniper Research's View: Key Strengths & Strategic Development Opportunities
- i. Corporate
- 1.2.6. Delta Controls
- i. Corporate
- ii. Geographical Spread
- iii. Key Clients & Strategic Partnerships
- iv. High-level View of Offerings
- v. Juniper Research's View: Key Strengths & Strategic Development Opportunities
- 1.2.7. Hitachi
- i. Corporate
- Table 1.11: Hitachi's Financial Snapshot ($m), 2021-2024
- ii. Geographical Spread
- iii. Key Clients & Strategic Partnerships
- iv. High-level View of Offerings
- v. Juniper Research's View: Key Strengths & Strategic Development Opportunities
- i. Corporate
- 1.2.8. Honeywell
- i. Corporate
- Table 1.12: Honeywell's Financial Snapshot ($m), 2021-2024
- ii. Geographical Spread
- iii. Key Clients & Strategic Partnerships
- iv. High-level View of Offerings
- v. Juniper Research's View: Key Strengths & Strategic Development Opportunities
- i. Corporate
- 1.2.9. Huawei
- i. Corporate
- Table 1.13: Huawei's Financial Summary ($m), 2021-2024
- ii. Geographical Spread
- iii. Key Clients & Strategic Partnerships
- iv. High-level View of Offerings
- v. Juniper Research's View: Key Strengths & Strategic Development Opportunities
- i. Corporate
- 1.2.10. IBM
- i. Corporate
- Table 1.14: IBM's Financial Summary ($m), 2022-2024
- ii. Geographical Spread
- iii. Key Clients & Strategic Partnerships
- iv. High-level View of Offerings
- v. Juniper Research's View: Key Strengths & Strategic Development Opportunities
- i. Corporate
- 1.2.11. Intel
- i. Corporate
- Table 1.15: Intel's Financial Summary ($m), 2022-2024
- ii. Geographical Spread
- iii. Key Clients & Strategic Partnerships
- iv. High-level View of Offerings
- v. Juniper Research's View: Key Strengths & Strategic Development Opportunities
- i. Corporate
- 1.2.12. Johnson Controls
- i. Corporate
- Table 1.16: Johnson Controls' Financial Summary ($m), 2022-2024
- ii. Geographical Spread
- iii. Key Clients & Strategic Partnerships
- iv. High-level View of Offerings
- v. Juniper Research's View: Key Strengths & Strategic Development Opportunities
- i. Corporate
- 1.2.13. Legrand
- i. Corporate
- Table 1.17: Legrand's Financial Summary ($m) 2022-2024
- ii. Geographical Spread
- iii. Key Clients & Strategic Partnerships
- iv. High-level View of Offerings
- v. Juniper Research's View: Key Strengths & Strategic Development Opportunities
- i. Corporate
- 1.2.14. Schneider Electric
- i. Corporate
- Table 1.18: Schneider Electric's Financial Summary, 2022-2024
- ii. Geographical Spread
- iii. Key Clients & Strategic Partnerships
- iv. High-level View of Offerings
- v. Juniper Research's View: Key Strengths & Strategic Development Opportunities
- i. Corporate
- 1.2.15. Siemens
- i. Corporate
- Table 1.19: Siemens' Financial Summary 2022-2024
- ii. Geographical Spread
- iii. Key Clients & Strategic Partnerships
- iv. High-level View of Offerings
- v. Juniper Research's View: Key Strengths & Strategic Development Opportunities
- i. Corporate
- 1.2.16. Telit Cinterion
- i. Corporate
- ii. Geographical Spread
- iii. Key Clients & Strategic Partnerships
- iv. High-level View of Offerings
- v. Juniper Research's View: Key Strengths & Strategic Development Opportunities
- 1.2.17. Verdigris Technologies
- i. Corporate
- ii. Geographical Spread
- iii. Key Clients & Strategic Partnerships
- iv. High-level View of Offerings
- v. Juniper Research's View: Key Strengths & Strategic Development Opportunities
- 1.2.18. Boldyn Networks
- i. Corporate
- ii. Geographical Spread
- iii. Key Clients & Strategic Partnerships
- iv. High-level View of Offerings
- v. Juniper Research's View: Key Strengths & Strategic Development Opportunities
- 1.2.1. ABB
- 1.3. Juniper Research Leaderboard Assessment Methodology
- 1.4. Limitation & Interpretations
- Table 1.20: Juniper Research Competitor Leaderboard Scoring Criteria
- 1.5. Related Research
Data & Forecasting
1. Market Data & Forecasting
- 1.1. Smart Buildings Market Overview
- 1.1.1. Methodology
- Figure 1.1: Smart Buildings Forecast Methodology: Commercial Buildings
- Figure 1.2: Smart Buildings Forecast Methodology: Industrial Buildings
- Figure 1.3: Smart Buildings Forecast Methodology: Residential Buildings
- 1.1.1. Methodology
- 1.2. Smart Building Forecasts
- 1.2.1. Total Number of Smart Buildings
- Figure & Table 1.4: Number of Buildings Deploying Smart Building Technologies (m), Split by 8 Key Regions, 2025-2030
- Table 1.5: Number of Buildings Deploying Smart Features, Split by Segment, 2025-2030
- 1.2.2. Total Smart Buildings Revenue
- Figure & Table 1.6: Smart Buildings Revenue ($m), Split by 8 Key Regions, 2025-2030
- Table 1.7: Smart Buildings Revenue, Split by Segment, 2025-2030
- 1.2.3. Total Commercial Smart Buildings
- Figure & Table 1.8: Number of Commercial Buildings Deploying Smart Building Technologies (m), Split by 8 Key Regions, 2025-2030
- 1.2.4. Total Industrial Smart Buildings
- Figure & Table 1.9: Number of Industrial Buildings Deploying Smart Building Technologies (m), Split by 8 Key Regions, 2025-2030
- 1.2.5. Total Residential Smart Buildings
- Figure & Table 1.10: Number of Industrial Buildings Deploying Smart Building Technologies (m), Split by 8 Key Regions, 2025-2030
- 1.2.1. Total Number of Smart Buildings
 2026-2030年全球智慧建築市場
 智慧幕牆市場-全球產業規模、佔有率、趨勢、機會、預測:依材料類型、技術、應用、地區和競爭格局分類,2021-2031年
 全面薪酬平台:市佔率分析、產業趨勢與統計、成長預測(2026-2031)智慧建築市場-全球產業規模、佔有率、趨勢、機會與預測:按服務、解決方案類型、建築類型、地區和競爭格局分類,2021-2031年
 智慧建築市場:按組件、連接方式、部署模式、建築類型、應用和最終用戶分類-2026-2032年全球市場預測
 2026年全球智慧建築(非住宅建築)市場報告2026年全球辦公大樓市場報告
 2026-2034年全球建築能源模擬軟體市場規模、佔有率、趨勢和成長分析報告
 智慧建築市場:按組件、應用和地區分類全球智慧建築市場規模、佔有率、趨勢和成長分析報告(2026-2034年)