


 |
市場調查報告書
商品編碼
1851800
數位地圖:市場佔有率分析、行業趨勢、統計數據和成長預測(2025-2030 年)Digital Map - Market Share Analysis, Industry Trends & Statistics, Growth Forecasts (2025 - 2030) |
||||||
※ 本網頁內容可能與最新版本有所差異。詳細情況請與我們聯繫。
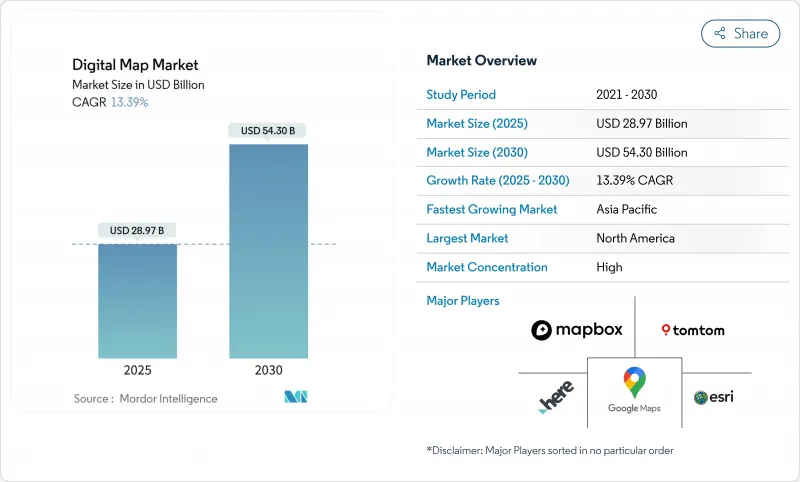
數位地圖市場預計將從 2025 年的 289.7 億美元成長到 2030 年的 543 億美元,複合年成長率為 13.39%。
成長的驅動力來自向雲端原生、人工智慧驅動平台的轉型,這些平台支援自動駕駛汽車、智慧城市數位雙胞胎和即時地理資訊系統。歐盟eCall等監管指令以及新興企業的Scope 3碳排放測繪規則正在推動其應用範圍超越傳統導航。
全球數位地圖市場趨勢與洞察
高清地圖在ADAS和自動駕駛車輛中的快速應用
BMW於2024年推出了德國首個L3級自動駕駛系統,該系統採用HERE高清即時地圖,在定位、路線規劃和營運設計區域檢驗實現了17公分以內的車道級精度。 HERE的高精度地圖目前支援5300萬輛車,比2023年成長了40%,顯示汽車製造商對承包高清數據的依賴程度很高。 TomTom的Orbis Maps 3D覆蓋了8,600萬公里的道路,並整合了基於車道的導航和電動車充電層。日本的動態地圖平台將於2025年獲得政府支持,以服務L4級自動駕駛卡車,並將高清地圖擴展到機場和港口。基於人工智慧的特徵提取降低了更新成本,縮短了地圖製作週期,並為能夠近乎即時更新網路的供應商提供了競爭優勢。
聯網汽車OTA地圖更新生態系的爆炸性成長
聯網汽車正在將地圖更新從靜態授權模式轉向定期OTA服務。哈曼的Smart Delta技術可將地圖更新檔案壓縮高達97%,在降低資料傳輸成本的同時,確保軟體定義車輛的安全性。全球十分之九的OEM廠商已採用HERE的智慧速度輔助地圖,以滿足歐盟通用安全法規的要求,並為全車更新創建標準化的OTA路徑。賓士將於2025年1月透過OTA更新整合電動智慧與越野追蹤功能,展示地圖資料如何協助售後功能變現。
厘米級地圖持續更新的成本不斷上升
在都市區,道路建設和交通變化需要對地圖進行車道級更新,這顯著增加了營運成本。 TomTom 現在融合了包括衛星、雷射雷達和行車記錄器在內的多感測器數據,以實現特徵提取的自動化並縮短測繪週期。 GetNexar 的人工智慧視覺技術利用群眾外包方式獲取行車記錄器影像,從而降低了地圖製作成本。成本壓力促使各公司透過合作和選擇性外包來維持地圖更新速度,同時又不犧牲地圖精度。
細分市場分析
到2024年,軟體解決方案將佔據數位地圖市場61.40%的佔有率,這反映出企業對可配置、API驅動的平台的需求,這些平台能夠跨行業整合空間分析功能。功能豐富的SDK使開發人員能夠將地圖、路線規劃和地理編碼整合到出行、物流和零售應用程式中。隨著企業將傳統GIS遷移到雲端環境,並需要託管整合、資料品質調優和使用者賦能計劃,複雜性也隨之增加。現代平台中的AI模組可自動偵測線路標記、識別標誌和評估資產狀況,進而提高營運效率。
使用專業服務也體現了合規要求,即對位置資料管道進行專家審核。實施計劃中內建了文件、授權管理工具和地理圍欄策略引擎,以確保跨境合法部署。隨著企業資料量的成長,供應商營運的託管服務擴大負責資料攝取、標準化和近即時串流傳輸,從而確保持續收入,而不僅僅是一次性授權費用。
預計到2024年,雲端部署將佔數位地圖市場規模的65.70%,並在2030年之前以15.70%的複合查詢成長。彈性運算和儲存可實現亞秒的查詢效能,每天處理數十億次路線請求,而自動擴展功能則可應對惡劣天氣和假期季節期間的交通高峰。邊緣資料收集節點將最新的探測資料推送至集中式儲存庫,確保叫車、物流和緊急應變等應用場景的地圖資料始終保持最新。
儘管國防、航空和監管嚴格的金融業仍在繼續採用本地部署,但隨著主權雲端區域、專用託管選項和機密運算飛地等安全反對意見的緩解,本地部署正在減少。成本模式正從資本支出 (capex) 轉向計量收費(opex),從而釋放資金用於人工智慧實驗和跨域資料整合。企業越來越傾向於將地圖繪製視為更廣泛的資料平台策略中的微服務,而不是獨立的地理資訊系統 (GIS) 功能。
數位地圖市場按解決方案(軟體、服務)、配置(本地部署、雲端部署)、地圖類型(導航地圖、高清即時地圖、地形圖和專題地圖)、最終用戶產業(汽車、工程建設、通訊等)以及地區進行細分。市場預測以美元計價。
區域分析
到2024年,北美將佔據數位地圖市場29.6%的佔有率,這主要得益於軟體定義車輛、雲端地理資訊系統(GIS)和國防地理空間專案的早期應用。聯邦機構正在推動開放空間框架的構建,汽車製造商也積極開發自動化研發項目。大型基礎設施計劃正在採用數位地形模型和全球導航衛星系統(GNSS)機器控制技術,以縮短施工週期並提高資產生命週期的可視性。像車輛遠端資訊處理供應商這樣的數據貨幣化領導企業,正在持續提供匿名化的探測數據,從而確保區域地圖的精度。
到2030年,亞太地區將以15.4%的複合年成長率領跑,主要得益於5G用戶成長、智慧運輸資金投入以及政府對數位雙胞胎技術的推動。日本工業界將收集高清走廊數據,用於大都會圈的卡車編隊行駛和無人駕駛計程車試點項目,這將加速對高清地圖的需求。中國雲端服務供應商將開放大規模位置API,以提升電子商務物流;印度的5G網路將促進公共和農業領域的地理資訊系統(GIS)現代化。對區域超大規模資料中心的投資也將有助於落實資料主權規則,使全球供應商能夠透過國內終端服務本地客戶。
其他福利:
- Excel格式的市場預測(ME)表
- 3個月的分析師支持
目錄
第1章 引言
- 研究假設和市場定義
- 調查範圍
第2章調查方法
第3章執行摘要
第4章 市場情勢
- 市場概覽
- 市場促進因素
- 高清地圖在ADAS和自動駕駛車輛中的快速應用
- 聯網汽車OTA地圖更新生態系的爆炸性成長
- 雲端原生GIS平台的主流應用
- 智慧城市數位雙胞胎位孿生計畫在全球擴展
- 歐盟電子呼叫強制令及下一代道路安全法規
- 企業範圍 3 碳排放測繪要求
- 市場限制
- 地圖逐公分更新成本不斷上升
- 加強資料隱私和在地化法律(GDPR、PIPL)
- 數據提供者與原始設備製造商之間的知識產權許可糾紛
- 人們對人工智慧生成地圖的演算法偏見和責任問題感到擔憂
- 價值/供應鏈分析
- 監管環境
- 技術展望
- 波特五力模型
- 新進入者的威脅
- 買方的議價能力
- 供應商的議價能力
- 替代品的威脅
- 競爭對手之間的競爭
第5章 市場規模與成長預測
- 透過解決方案
- 軟體
- 服務
- 透過部署
- 本地部署
- 雲
- 按地圖類型
- 導航地圖
- 高清即時地圖
- 地形圖和專題地圖
- 按最終用途行業分類
- 車
- 工程與施工
- 通訊領域
- 公共部門和國防部門
- 零售和地理行銷
- 其他最終用戶
- 按地區
- 北美洲
- 美國
- 加拿大
- 墨西哥
- 南美洲
- 巴西
- 阿根廷
- 其他南美洲
- 歐洲
- 德國
- 英國
- 法國
- 荷蘭
- 其他歐洲地區
- 亞太地區
- 中國
- 日本
- 印度
- 韓國
- 澳洲和紐西蘭
- 亞太其他地區
- 中東和非洲
- 中東
- 阿拉伯聯合大公國
- 沙烏地阿拉伯
- 土耳其
- 其他中東地區
- 非洲
- 南非
- 奈及利亞
- 其他非洲地區
- 北美洲
第6章 競爭情勢
- 市場集中度
- 策略趨勢
- 市佔率分析
- 公司簡介
- Alphabet(Google Maps, Waze)
- HERE Technologies
- TomTom International BV
- Esri
- Mapbox
- Apple Inc.(Apple Maps)
- Maxar Technologies(DigitalGlobe)
- Collins Bartholomew
- Digital Map Products
- Digital Mapping Solutions
- DMTI Spatial
- Lepton Software
- ThinkGeo
- MapData Services
- NavInfo Co. Ltd.
- AutoNavi(Gaode, Alibaba)
- Baidu Maps
- Nearmap Ltd
- Zenrin Co. Ltd.
- Trimble Inc.
- CARTO
- OpenStreetMap Foundation
- MapQuest(Verizon)
第7章 市場機會與未來展望
The digital map market is valued at USD 28.97 billion in 2025 and is projected to reach USD 54.30 billion by 2030, advancing at a 13.39% CAGR.
Growth stems from the transition toward AI-powered, cloud-native platforms that support autonomous vehicles, smart-city digital twins, and real-time geographic information systems. Regulatory mandates such as EU eCall and emerging corporate Scope 3 carbon-mapping rules broaden adoption beyond conventional navigation.
Global Digital Map Market Trends and Insights
Rapid Uptake of HD Maps for ADAS and Autonomous Vehicles
BMW launched Germany's first Level 3 system in 2024 using HERE HD Live Map that delivers lane-level accuracy within 17 cm for localization, path planning, and operational-design-domain validation. HERE's high-precision coverage now supports 53 million vehicles, a 40% rise over 2023, indicating OEM reliance on turnkey HD data. TomTom's Orbis Maps 3D spans 86 million km of roads and integrates lane-based navigation with electric-vehicle charging layers. Japan's Dynamic Map Platform received government backing in 2025 to expand HD maps to airports and ports, targeting Level 4 autonomous trucks. AI-based feature extraction lowers refresh costs and shortens map-creation cycles, delivering competitive advantage to providers able to update networks in near-real time.
Explosive Growth of Connected-Car OTA Map-Update Ecosystems
Connected vehicles are shifting maps from static licenses to recurring over-the-air services. HARMAN's Smart Delta technology compresses map-update files by up to 97%, cutting data-transfer costs while maintaining software-defined-vehicle safety integrity. Nine of ten global OEMs deploy HERE's Intelligent Speed Assistance Map to address EU General Safety Regulation compliance, creating standardized OTA pathways for fleet-wide updates. Mercedes-Benz integrated electric-intelligence and off-road tracking features via its January 2025 OTA release, illustrating how map data enables post-sale feature monetization.
Escalating Costs of Continuous, Centimeter-Level Map Refresh
Lane-level refresh requirements drive substantial operational costs as construction and traffic changes intensify in urban zones. TomTom now fuses multi-sensor data-satellite, LiDAR, onboard cameras-to automate feature extraction and cut survey cycles. GetNexar's AI vision reduces cartography expense by crowd-sourcing dash-cam imagery, yet capital requirements remain onerous for smaller vendors. Cost pressures encourage alliances and selective outsourcing to maintain update cadence without sacrificing map accuracy.
Other drivers and restraints analyzed in the detailed report include:
- Mainstream Adoption of Cloud-Native GIS Platforms
- Smart-City Digital-Twin Programs Scaling Globally
- Heightened Data-Privacy and Localization Statutes (GDPR, PIPL)
For complete list of drivers and restraints, kindly check the Table Of Contents.
Segment Analysis
Software solutions captured 61.40% of the digital map market in 2024, reflecting enterprise demand for configurable, API-driven platforms that consolidate spatial analytics across departments. Feature-rich SDKs allow developers to embed maps, routing, and geocoding into mobility, logistics, and retail applications. Services revenue, growing at 13.50% CAGR, mirrors rising complexity as organizations migrate legacy GIS to cloud environments and seek managed integration, data-quality tuning, and user-enablement programs. AI modules within modern platforms automate line-mark detection, sign recognition, and asset-condition scoring, catalyzing operational efficiencies.
Professional-services uptake also reflects compliance mandates that require expert audits of location-data pipelines. Documentation, consent-management tools, and geo-fencing policy engines are bundled into implementation projects to ensure lawful deployment across borders. As enterprise data volumes scale, vendor-operated managed services increasingly handle ingestion, normalization, and near-real-time streaming, locking in recurring revenue beyond one-time license fees.
Cloud deployment held 65.70% share of the digital map market size in 2024 and is forecast to expand at 15.70% CAGR through 2030. Elastic compute and storage enable sub-second query performance for billions of daily route requests while auto-scaling manages traffic peaks during severe-weather or holiday seasons. Edge ingestion nodes push fresh probe data into centralized repositories, ensuring map freshness for ride-hailing, logistics, and emergency response.
On-premise installations persist in defense, aviation, and highly regulated finance but trend downward as sovereign-cloud regions, dedicated host options, and confidential-computing enclaves mitigate security objections. Cost models shift from capex to pay-as-you-go opex, freeing capital for AI experimentation and cross-domain data fusion. Enterprises increasingly view mapping as a micro-service consumed within broader data-platform strategies rather than a standalone GIS function.
Digital Map Market is Segmented by Solution (Software, Services), Deployment (On-Premise, Cloud), Map Type (Navigation Maps, HD and Real-Time Maps, Topographic and Thematic Maps), End User Industry (Automotive, Engineering and Construction, Telecommunications and More), and by Geography. The Market Forecasts are Provided in Terms of Value (USD).
Geography Analysis
North America accounted for 29.6% digital map market share in 2024, anchored by early adoption of software-defined vehicles, cloud GIS, and defense geospatial programs. Federal agencies promote open spatial frameworks, and automotive OEMs maintain deep research pipelines for automation. Large-scale infrastructure projects employ digital terrain models and GNSS machine-control to shorten build cycles and enhance asset lifecycle visibility. Data-monetization champions such as fleet telematics providers continuously feed anonymized probe data that sustain regional map accuracy.
Asia-Pacific delivers the highest 15.4% CAGR through 2030, powered by 5G subscriber growth, smart-mobility funding, and government-backed digital-twin mandates. Japan's industry collects HD corridor data for truck platooning and metropolitan robo-taxi pilots, accelerating HD mapping demand. China's cloud providers expose high-volume location APIs to power e-commerce logistics, while India's 5G networks stimulate GIS modernization across utilities and agriculture. Investments in regional hyperscale data centers also address data-sovereignty rules, enabling global vendors to serve local customers via in-country endpoints.
- Alphabet (Google Maps, Waze)
- HERE Technologies
- TomTom International B.V.
- Esri
- Mapbox
- Apple Inc. (Apple Maps)
- Maxar Technologies (DigitalGlobe)
- Collins Bartholomew
- Digital Map Products
- Digital Mapping Solutions
- DMTI Spatial
- Lepton Software
- ThinkGeo
- MapData Services
- NavInfo Co. Ltd.
- AutoNavi (Gaode, Alibaba)
- Baidu Maps
- Nearmap Ltd
- Zenrin Co. Ltd.
- Trimble Inc.
- CARTO
- OpenStreetMap Foundation
- MapQuest (Verizon)
Additional Benefits:
- The market estimate (ME) sheet in Excel format
- 3 months of analyst support
TABLE OF CONTENTS
1 INTRODUCTION
- 1.1 Study Assumptions and Market Definition
- 1.2 Scope of the Study
2 RESEARCH METHODOLOGY
3 EXECUTIVE SUMMARY
4 MARKET LANDSCAPE
- 4.1 Market Overview
- 4.2 Market Drivers
- 4.2.1 Rapid uptake of HD maps for ADAS and autonomous vehicles
- 4.2.2 Explosive growth of connected-car OTA map-update ecosystems
- 4.2.3 Mainstream adoption of cloud-native GIS platforms
- 4.2.4 Smart-city digital-twin programs scaling globally
- 4.2.5 Mandatory EU eCall and next-gen road-safety regulations
- 4.2.6 Corporate Scope-3 carbon mapping requirements
- 4.3 Market Restraints
- 4.3.1 Escalating costs of continuous, centimetre-level map refresh
- 4.3.2 Heightened data-privacy and localization statutes (GDPR, PIPL)
- 4.3.3 IP-licensing disputes among data providers and OEMs
- 4.3.4 Algorithmic bias and liability concerns in AI-generated maps
- 4.4 Value / Supply-Chain Analysis
- 4.5 Regulatory Landscape
- 4.6 Technological Outlook
- 4.7 Porter's Five Forces
- 4.7.1 Threat of New Entrants
- 4.7.2 Bargaining Power of Buyers
- 4.7.3 Bargaining Power of Suppliers
- 4.7.4 Threat of Substitutes
- 4.7.5 Intensity of Competitive Rivalry
5 MARKET SIZE AND GROWTH FORECASTS (VALUE)
- 5.1 By Solution
- 5.1.1 Software
- 5.1.2 Services
- 5.2 By Deployment
- 5.2.1 On-Premise
- 5.2.2 Cloud
- 5.3 By Map Type
- 5.3.1 Navigation Maps
- 5.3.2 HD and Real-time Maps
- 5.3.3 Topographic and Thematic Maps
- 5.4 By End-use Industry
- 5.4.1 Automotive
- 5.4.2 Engineering and Construction
- 5.4.3 Telecommunications
- 5.4.4 Public Sector and Defense
- 5.4.5 Retail and Geomarketing
- 5.4.6 Other End User
- 5.5 By Geography
- 5.5.1 North America
- 5.5.1.1 United States
- 5.5.1.2 Canada
- 5.5.1.3 Mexico
- 5.5.2 South America
- 5.5.2.1 Brazil
- 5.5.2.2 Argentina
- 5.5.2.3 Rest of South America
- 5.5.3 Europe
- 5.5.3.1 Germany
- 5.5.3.2 United Kingdom
- 5.5.3.3 France
- 5.5.3.4 Netherlands
- 5.5.3.5 Rest of Europe
- 5.5.4 Asia-Pacific
- 5.5.4.1 China
- 5.5.4.2 Japan
- 5.5.4.3 India
- 5.5.4.4 South Korea
- 5.5.4.5 Australia and New Zealand
- 5.5.4.6 Rest of Asia-Pacific
- 5.5.5 Middle East and Africa
- 5.5.5.1 Middle East
- 5.5.5.1.1 United Arab Emirates
- 5.5.5.1.2 Saudi Arabia
- 5.5.5.1.3 Turkey
- 5.5.5.1.4 Rest of Middle East
- 5.5.5.2 Africa
- 5.5.5.2.1 South Africa
- 5.5.5.2.2 Nigeria
- 5.5.5.2.3 Rest of Africa
- 5.5.1 North America
6 COMPETITIVE LANDSCAPE
- 6.1 Market Concentration
- 6.2 Strategic Moves
- 6.3 Market Share Analysis
- 6.4 Company Profiles (includes Global level Overview, Market level overview, Core Segments, Financials as available, Strategic Information, Market Rank/Share for key companies, Products and Services, and Recent Developments)
- 6.4.1 Alphabet (Google Maps, Waze)
- 6.4.2 HERE Technologies
- 6.4.3 TomTom International B.V.
- 6.4.4 Esri
- 6.4.5 Mapbox
- 6.4.6 Apple Inc. (Apple Maps)
- 6.4.7 Maxar Technologies (DigitalGlobe)
- 6.4.8 Collins Bartholomew
- 6.4.9 Digital Map Products
- 6.4.10 Digital Mapping Solutions
- 6.4.11 DMTI Spatial
- 6.4.12 Lepton Software
- 6.4.13 ThinkGeo
- 6.4.14 MapData Services
- 6.4.15 NavInfo Co. Ltd.
- 6.4.16 AutoNavi (Gaode, Alibaba)
- 6.4.17 Baidu Maps
- 6.4.18 Nearmap Ltd
- 6.4.19 Zenrin Co. Ltd.
- 6.4.20 Trimble Inc.
- 6.4.21 CARTO
- 6.4.22 OpenStreetMap Foundation
- 6.4.23 MapQuest (Verizon)
7 MARKET OPPORTUNITIES AND FUTURE OUTLOOK
- 7.1 White-space and Unmet-need Assessment
 數位地圖市場按產品類型、技術、資料來源、最終用戶、應用、用戶設備和垂直產業分類-2025-2032年全球預測
 全球數位地圖市場(按解決方案和用例)預測(至 2030 年)
 2025年全球數位地圖市場報告
 2025 年至 2033 年數位地圖市場報告(按類型、用途、解決方案、部署模式、應用、最終用途產業和地區)
 2025-2029年全球數位地圖市場
 全球數位地圖市場研究報告 - 產業分析、規模、佔有率、成長、趨勢及 2025 年至 2033 年預測
 數位地圖市場分析及預測(至 2034 年):類型、產品、服務、技術、組件、應用、最終用戶、功能、部署
 數位地圖市場:各零件,各部署模式,各用途,各業界,各地區,機會,預測,2017年~2031年
 數位地圖市場規模、佔有率、成長分析、按產品、按地圖類型、按目的、按縮尺、按地區 - 產業預測,2024-2031年全球數位地圖市場規模:地區、範圍和預測