


 |
市場調查報告書
商品編碼
1851751
房車租賃:市場佔有率分析、行業趨勢、統計數據和成長預測(2025-2030 年)Recreational Vehicle Rental - Market Share Analysis, Industry Trends & Statistics, Growth Forecasts (2025 - 2030) |
||||||
※ 本網頁內容可能與最新版本有所差異。詳細情況請與我們聯繫。
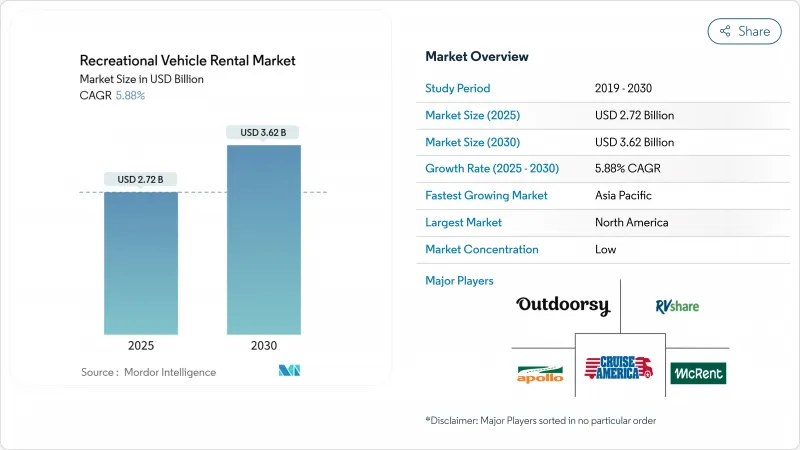
預計到 2025 年,房車租賃市場規模將達到 27.2 億美元,到 2030 年將達到 36.2 億美元,年複合成長率為 5.88%。
儘管燃油價格上漲和區域規劃限制推高了營運成本,但市場仍保持持續成長。出行方式向公路旅行的結構性轉變推動了需求成長,P2P預訂平台日益普及,現代車輛也在進行設計升級,以提升駕駛和維護的便利性。營運商正在加速推廣遠端資訊處理技術,以提高車輛的運作,而一些州和歐盟國家的政策制定者則尋求將零排放獎勵與車輛周轉率掛鉤。由於整合嘗試面臨反壟斷審查,競爭動態仍在不斷變化,但大型車隊所有者在採購和保險方面的規模優勢仍然顯著。
全球房車租賃市場趨勢與洞察
國內公路旅行激增
國內公路旅行已從疫情期間的權宜之計轉變為主流休閒選擇。調查顯示,70%的美國旅客計劃在2025年至少進行一次公路旅行,高於2023年的57%。富裕家庭也加入了這一趨勢,推高了平均每日租金,但並未減少旅客的數量。隨著公路旅客尋求自足式的出行方式,越來越多的家庭開始使用配備車載淋浴設備和Wi-Fi的電動房車。旅行社報告稱,2025年中期預訂的度假套餐中,約有一半將包含自駕遊行程,是前一年的兩倍。這種持續成長的趨勢表明,人們的出行方式正在永久轉向獨立旅行,這將直接惠及房車租賃市場。
P2P(P2P)租賃平台的成長
P2P網路挖掘出了尚未開發的市場潛力。光是Outdoorsy一家公司預計到2024年其終身預訂額就將超過30億美元,並力爭在2029年達到80億美元。房東數量的成長速度超過了專業車隊的擴張速度,這有助於房車租賃市場在無需大量資產負債表投資的情況下,擴大車輛選擇範圍和地理涵蓋範圍。 P2P平台的平均行程時間已增至7天,這主要得益於配送服務解決了都市區租客的「最後一公里」難題。平台提供的保險計劃和全天候道路救援服務降低了新用戶的風險感知。極具吸引力的單次租賃經濟效益使得價格漲幅低於飯店通膨率,從而擴大了價值差距,推動了重複預訂。
高昂的維護和保險成本
現代休閒車配備複雜的電池、拓展艙和資訊娛樂系統,維修成本高昂,熟練技師供不應求,在熱門市場,研討會的人事費用超過每小時160美元。大型車隊能夠協商多車保險,而小型車主則無法與之匹敵,這進一步拉大了房車租賃市場的成本差距。預防性維護計畫和延長保固期固然有所幫助,但需要資金投入,這無疑會加重現金流緊張的營運商的負擔。
細分市場分析
儘管車隊營運商在2024年佔銷售額的70.37%,但私人車主的成長速度最快。企業車隊的規模優勢使其能夠獲得批量採購折扣、集中維護和全面的保險。整合商透過收購來擴大地域覆蓋範圍,而競爭監管機構則阻止了諸如澳洲阿波羅旅遊公司和旅遊控股公司提案的反競爭措施。零排放法規帶來的合規成本有利於資金雄厚的車隊,因為它們能夠承擔充電樁建設和技術人員再培訓的費用。
個人車主透過P2P平台獲得了成功,這些平台提供承包預訂、確認和保險服務。許多車主透過瞄準細分市場,例如本地活動或寵物友善露營車,實現了更高的年度使用率。平台提供的維護網路使小型車主無需自行建造基礎設施即可完成安全檢查。這些動態使得個人車主成為一種靈活的補充,而非直接替代,最終豐富了整個房車租賃市場。
2024年,線上通路將佔61.55%的租賃市場佔有率,年複合成長率達8.01%。即時庫存、動態定價和整合支付將把預訂週期從數週縮短至數天。年輕的租車者將使用行動應用程式進行行程規劃,而營運商將提供360度全景車輛展示和人工智慧聊天支援。
對於行程複雜的客戶而言,線下預訂仍然十分重要,因為許多初次租車的用戶會尋求關於車型、營地選擇和路線安全的建議。營運商正擴大採用線上線下相結合的預訂模式。這種混合模式既擴大了房車租賃市場的規模,也保留了個人化服務帶來的信任優勢。
區域分析
2024年,北美市場維持了46.78%的市佔率。美國擁有完善的露營地網路、成熟的保險產品以及較高的可支配收入,這些都支撐著蓬勃發展的房車租賃市場。加州的「先進清潔卡車」法規已被九個州採納,該法規將從2025年起強制要求增加零排放車輛的銷售量。加拿大受益於其廣闊的荒野路線和國內旅遊稅收優惠政策,而墨西哥則是一個潛在的新興市場,隨著公路的改善和中階的壯大,其潛在需求正在不斷成長。
亞太地區預計到2030年將以11.35%的複合年成長率快速成長。日本位居榜首,預計到2024年將擁有16.5萬輛註冊露營車和超過500個認證露營地。中國的汽車租賃生態系統將受惠於國內電動車供應鏈和新建高速公路走廊的蓬勃發展。澳洲仍然是背包客的主要旅遊目的地,但競爭監管機構反對可能推高價格的車隊合併。印度擁有大量首次旅行者,各邦旅遊局正在資助路邊設施建設,以降低進入露營車租賃市場的門檻。
隨著跨境旅行規則的統一和低排放氣體區的擴大,歐洲房車市場正經歷穩定成長。 Erwin Hymer集團預測,到2024年,其在歐洲的市佔率將達到23.6%,銷售額將達到33.6億美元(erwinhymergroup.com)。德國的高速公路網路和高密度的經銷商推動了強勁的更換需求,而法國和西班牙則依靠其沿海景點和成熟的露營文化。由於歐盟凝聚基金資助的道路改善項目,東歐成員國的房車普及率正逐漸提高。從挪威到義大利的電動車充電走廊正在增強人們對電池驅動旅居車的信心,並將歐洲打造成為零排放車隊的試驗場。
其他福利:
- Excel格式的市場預測(ME)表
- 3個月的分析師支持
目錄
第1章 引言
第2章調查方法
第3章執行摘要
第4章 市場情勢
- 市場概覽
- 市場促進因素
- 國內自駕遊旅遊業蓬勃發展
- P2P(P2P)租賃平台的成長
- 千禧世代和Z世代擁有更多可支配收入
- 遠端資訊處理技術可最佳化車隊運作
- 企業利用休閒車輛作為移動式臨時空間
- 零排放房車獎勵將加速車輛電氣化。
- 市場限制
- 高昂的維護和保險成本
- 資產運轉率的季節性下降
- 地方政府關於休閒車輛過夜停車的規定
- 零件供應瓶頸導致周轉速度減慢
- 價值/供應鏈分析
- 監管環境
- 技術展望
- 波特五力模型
- 供應商的議價能力
- 消費者議價能力
- 新進入者的威脅
- 替代品的威脅
- 競爭對手之間的競爭
第5章 市場規模與成長預測
- 按租賃公司類型
- 個人和私人業主
- 車隊營運商
- 按預訂類型
- 線下預訂
- 線上預訂
- 依產品類型
- 電動休閒車
- A級旅居車
- B級旅居車
- C級旅居車
- 拖曳式房車
- 第五輪拖車
- 旅行拖車
- 卡車露營車
- 運動型多用途拖車
- 電動休閒車
- 按租賃期限
- 短期(1-7天)
- 期中(8-30天)
- 長期(超過30天)
- 按地區
- 北美洲
- 美國
- 加拿大
- 北美其他地區
- 南美洲
- 巴西
- 阿根廷
- 其他南美洲
- 歐洲
- 德國
- 英國
- 法國
- 西班牙
- 義大利
- 俄羅斯
- 其他歐洲地區
- 亞太地區
- 中國
- 印度
- 日本
- 韓國
- 澳洲
- 亞太其他地區
- 中東和非洲
- 阿拉伯聯合大公國
- 沙烏地阿拉伯
- 土耳其
- 南非
- 其他中東和非洲地區
- 北美洲
第6章 競爭情勢
- 市場集中度
- 策略趨勢
- 市佔率分析
- 公司簡介
- Cruise America
- Apollo Tourism & Leisure Ltd
- Outdoorsy, Inc.
- RVshare
- McRent
- Indie Campers
- RoadSurfer GmbH
- Camplify
- Yescapa
- El Monte RV
- Just Go Motorhome Hire
- Escape Campervans
- JUCY Rentals
- Spaceships Rentals
- Bunk Campers
第7章 市場機會與未來展望
The RV Rental Market is valued at USD 2.72 billion in 2025 and is forecast to reach USD 3.62 billion by 2030, advancing at a 5.88% CAGR.
Consistent growth is visible even as fuel inflation and zoning constraints raise operating costs. A structural pivot toward road-trip vacations lifts demand, the spread of peer-to-peer booking platforms, and design upgrades that make modern vehicles easier to drive and maintain. Operators are accelerating telematics roll-outs to improve vehicle uptime, while policymakers in several states and EU countries are linking zero-emission incentives to fleet turnover. Competitive dynamics remain fluid as consolidation attempts meet antitrust scrutiny, yet scale advantages in procurement and insurance continue to favor large fleet owners.
Global Recreational Vehicle Rental Market Trends and Insights
Surge in Domestic Road-Trip Tourism
Domestic road-trip travel has moved from pandemic workaround to mainstream leisure choice. Surveys show 70% of U.S. travelers plan at least one road trip during 2025, up from 57% in 2023. Affluent households are joining the trend, lifting average daily rental rates without dampening volume. Road travelers seek self-contained mobility, which pushes more families toward motorized units equipped with onboard showers and Wi-Fi. Travel agencies report that nearly half of packaged vacations booked in mid-2025 revolve around drive-in itineraries, double the prior year. This continued adoption confirms a lasting shift toward independent travel that directly benefits the RV rental market.
Expansion of Peer-to-Peer (P2P) Rental Platforms
P2P networks have unlocked underused inventory. Outdoorsy alone surpassed USD 3 billion in lifetime bookings in 2024 and targets USD 8 billion by 2029. Host growth outpaces professional fleet additions, helping the RV rental market widen vehicle choice and geographic reach without heavy balance-sheet investment. Average P2P trip length rose to seven days, aided by delivery services that solve last-mile issues for urban renters. Platform insurance programs and 24/7 roadside support lower perceived risk for first-time users. Attractive unit economics keep price increases below hotel inflation, extending the value gap that fuels repeat bookings.
High Maintenance & Insurance Costs
Modern RVs carry complex batteries, slide-outs, and infotainment systems that drive repair bills higher. Skilled technicians remain scarce, pushing workshop labor rates past USD 160 per hour in top markets. Large fleets can negotiate multi-vehicle policies that small owners cannot match, widening cost disparities inside the RV rental market. Preventive programs and extended warranties help, yet they demand capital outlays that weigh on cash-flow-constrained operators.
Other drivers and restraints analyzed in the detailed report include:
- Rising Disposable Income Among Millennials & Gen-Z
- Telematics-Enabled Fleet Uptime Optimization
- Municipal Restrictions on Overnight RV Parking
For complete list of drivers and restraints, kindly check the Table Of Contents.
Segment Analysis
Fleet operators controlled 70.37% of 2024 revenue while individual owners delivered the fastest growth. Scale lets corporate fleets secure bulk purchasing discounts, centralized maintenance, and umbrella insurance. Consolidators pursue bolt-on acquisitions to extend regional coverage, yet competition watchdogs have blocked anticompetitive moves such as the Apollo Tourism-Tourism Holdings proposal in Australia. Compliance costs linked to zero-emission mandates favor well-capitalized fleets that can finance depot chargers and technician re-training.
Private owners thrive where P2P platforms provide turnkey booking, verification, and insurance. Many reach higher annual utilization by targeting local events and niche formats such as pet-friendly campervans. Platform-provided maintenance networks allow small owners to meet safety inspections without building infrastructure. These dynamics position individual hosts as agile complements rather than direct substitutes, ultimately enriching choice across the RV rental market.
Online channels captured 61.55% of 2024 rentals and compound at an 8.01% rate, reflecting a decisive digital shift. Real-time inventory, dynamic pricing, and integrated payments shorten the booking window from weeks to days. Younger renters rely on mobile apps for trip planning, pushing operators to offer 360-degree vehicle tours and AI chat support.
Offline bookings remain relevant for complex itineraries where first-time users seek advice on vehicle class, campground selection, and route safety. Operators increasingly integrate chat-to-store models: customers start online, then finalize terms through showroom visits or video calls. This hybrid approach preserves the trust advantage of personal service while scaling the reach of the RV rental market.
The RV Rental Market is Segmented by Rental Supplier Type (Private and Individual Owners and Fleet Operators), Booking Type (Offline Booking and Online Booking), Product Type (Motorized RVs and Towable RVs), Rental Duration (Short-Term, Mid-Term and Long-Term), and Geography (North America, South America, Europe, Asia-Pacific and Middle East and Africa). The Market Forecasts are Provided in Terms of Value (USD).
Geography Analysis
North America retained a 46.78% revenue share in 2024. The United States supplies an extensive campground grid, mature insurance products, and high disposable income that keep the rv rental market buoyant. California's Advanced Clean Trucks rule, already adopted by nine additional states, will require escalating zero-emission sales from 2025, creating upfront costs but long-term operating savings rvia.org. Canada benefits from expansive wilderness routes and tax incentives for domestic tourism, while Mexico shows early promise where highway upgrades and middle-class expansion widen addressable demand.
Asia-Pacific posts the fastest 11.35% CAGR through 2030. Japan leads with 165,000 registered campervans and over 500 certified RV parks as of 2024. China's car-rental ecosystem grows quickly on the back of domestic EV supply chains and new highway corridors. Australia remains a core backpacker circuit, though competition authorities oppose fleet mergers that could raise prices. India supplies a sizable pipeline of first-time travelers; supportive state tourism boards fund roadside amenities that lower entry barriers for the RV rental market.
Europe delivers steady growth as cross-border travel rules harmonize and low-emission zones expand. The Erwin Hymer Group captured 23.6% European market share in 2024 on USD 3.36 billion sales erwinhymergroup.com. Germany's autobahn network and dense dealer footprint foster high replacement demand, while France and Spain rely on coastal draws and established campsite cultures. Eastern EU members receive cohesion-funded road upgrades that gradually raise RV adoption rates. Electric-charging corridors from Norway to Italy enhance confidence in battery-powered motorhomes, positioning Europe as a test bed for zero-emission fleets.
- Cruise America
- Apollo Tourism & Leisure Ltd
- Outdoorsy, Inc.
- RVshare
- McRent
- Indie Campers
- RoadSurfer GmbH
- Camplify
- Yescapa
- El Monte RV
- Just Go Motorhome Hire
- Escape Campervans
- JUCY Rentals
- Spaceships Rentals
- Bunk Campers
Additional Benefits:
- The market estimate (ME) sheet in Excel format
- 3 months of analyst support
TABLE OF CONTENTS
1 Introduction
2 Research Methodology
3 Executive Summary
4 Market Landscape
- 4.1 Market Overview
- 4.2 Market Drivers
- 4.2.1 Surge in Domestic Road-Trip Tourism
- 4.2.2 Expansion of Peer-To-Peer (P2P) Rental Platforms
- 4.2.3 Rising Disposable Income Among Millennials & Gen-Z
- 4.2.4 Telematics-Enabled Fleet Uptime Optimisation
- 4.2.5 Corporate Use of Rvs As Mobile Pop-Up Spaces
- 4.2.6 Zero-Emission RV Incentives Accelerating Electrified Fleets
- 4.3 Market Restraints
- 4.3.1 High Maintenance and Insurance Costs
- 4.3.2 Seasonality-Driven Low Asset Utilisation
- 4.3.3 Municipal Restrictions On Overnight RV Parking
- 4.3.4 Spare-Part Supply Bottlenecks Delaying Turnaround
- 4.4 Value / Supply-Chain Analysis
- 4.5 Regulatory Landscape
- 4.6 Technological Outlook
- 4.7 Porter's Five Forces
- 4.7.1 Bargaining Power of Suppliers
- 4.7.2 Bargaining Power of Consumers
- 4.7.3 Threat of New Entrants
- 4.7.4 Threat of Substitute Products
- 4.7.5 Intensity of Competitive Rivalry
5 Market Size & Growth Forecasts (Value (USD))
- 5.1 By Rental Supplier Type
- 5.1.1 Private and Individual Owners
- 5.1.2 Fleet Operators
- 5.2 By Booking Type
- 5.2.1 Offline Booking
- 5.2.2 Online Booking
- 5.3 By Product Type
- 5.3.1 Motorized RVs
- 5.3.1.1 Class A Motorhomes
- 5.3.1.2 Class B Motorhomes
- 5.3.1.3 Class C Motorhomes
- 5.3.2 Towable RVs
- 5.3.2.1 Fifth-Wheel Trailers
- 5.3.2.2 Travel Trailers
- 5.3.2.3 Truck Campers
- 5.3.2.4 Sports Utility Trailers
- 5.3.1 Motorized RVs
- 5.4 By Rental Duration
- 5.4.1 Short-term (1-7 days)
- 5.4.2 Mid-term (8-30 days)
- 5.4.3 Long-term (More than 30 days)
- 5.5 By Geography
- 5.5.1 North America
- 5.5.1.1 United States
- 5.5.1.2 Canada
- 5.5.1.3 Rest of North America
- 5.5.2 South America
- 5.5.2.1 Brazil
- 5.5.2.2 Argentina
- 5.5.2.3 Rest of South America
- 5.5.3 Europe
- 5.5.3.1 Germany
- 5.5.3.2 United Kingdom
- 5.5.3.3 France
- 5.5.3.4 Spain
- 5.5.3.5 Italy
- 5.5.3.6 Russia
- 5.5.3.7 Rest of Europe
- 5.5.4 Asia-Pacific
- 5.5.4.1 China
- 5.5.4.2 India
- 5.5.4.3 Japan
- 5.5.4.4 South Korea
- 5.5.4.5 Australia
- 5.5.4.6 Rest of Asia-Pacific
- 5.5.5 Middle East and Africa
- 5.5.5.1 United Arab Emirates
- 5.5.5.2 Saudi Arabia
- 5.5.5.3 Turkey
- 5.5.5.4 South Africa
- 5.5.5.5 Rest of Middle East and Africa
- 5.5.1 North America
6 Competitive Landscape
- 6.1 Market Concentration
- 6.2 Strategic Moves
- 6.3 Market Share Analysis
- 6.4 Company Profiles (Includes Global Level Overview, Market Level Overview, Core Segments, Financials as Available, Strategic Information, Market Rank/Share for Key Companies, Products and Services, SWOT Analysis, and Recent Developments)
- 6.4.1 Cruise America
- 6.4.2 Apollo Tourism & Leisure Ltd
- 6.4.3 Outdoorsy, Inc.
- 6.4.4 RVshare
- 6.4.5 McRent
- 6.4.6 Indie Campers
- 6.4.7 RoadSurfer GmbH
- 6.4.8 Camplify
- 6.4.9 Yescapa
- 6.4.10 El Monte RV
- 6.4.11 Just Go Motorhome Hire
- 6.4.12 Escape Campervans
- 6.4.13 JUCY Rentals
- 6.4.14 Spaceships Rentals
- 6.4.15 Bunk Campers
