


 |
市場調查報告書
商品編碼
1851615
氨:市場佔有率分析、產業趨勢、統計數據和成長預測(2025-2030 年)Ammonia - Market Share Analysis, Industry Trends & Statistics, Growth Forecasts (2025 - 2030) |
||||||
※ 本網頁內容可能與最新版本有所差異。詳細情況請與我們聯繫。
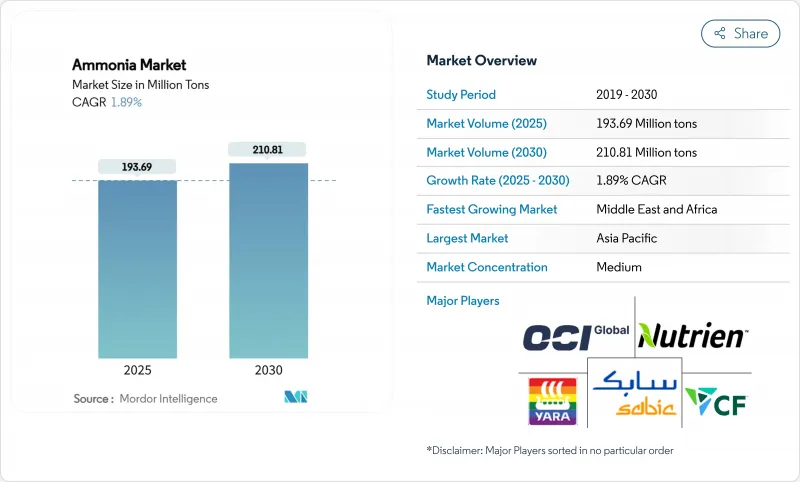
預計到 2025 年氨市場規模將達到 1.9369 億噸,到 2030 年將達到 2.1081 億噸,在預測期(2025-2030 年)內複合年成長率為 1.89%。
強勁的營收成長凸顯了生產技術、原料策略和下游應用領域發生的根本性轉變,而這些轉變的驅動力包括日益嚴格的脫碳目標、天然氣價格持續波動以及低碳船用燃料的廣泛應用。對綠色和藍色設施的戰略投資、中國煤製氣升級改造以及氨作為氫載體的興起,正在重塑供應鏈格局。同時,由於安全要求不斷提高和尿素供應過剩,短期價格仍將波動。能夠獲得低碳原料、再生能源和技術合作的生產商正在提升其成本競爭力,但歐洲的天然氣相關資產仍面臨利潤率壓力。隨著這些結構性因素重塑氨市場,區域成長率、產品組合和貿易流量的差異遠遠超過關鍵噸位資料所顯示的程度。
全球氨市場趨勢與洞察
亞洲各地對低碳肥料的需求激增
亞洲農業向永續性轉型,加速了低碳肥料的普及。中國正在對燃煤設施進行改造,引入可再生能源和碳捕獲系統,從而推動了對可再生混合肥料的需求。印尼的GAIA計劃正在部署首個天然氣和電解氫共供的混合肥料廠,為轉型設施提供了一個可擴展的模板。政策獎勵,例如對永續投入品的優惠融資和對傳統尿素廠更嚴格的排放限制,正在引導農民轉向高級產品。這些影響的連鎖反應已在模組化電解槽設備的訂單以及肥料經銷商與再生能源開發商之間簽訂的長期承購協議中顯現出來。
採用氫氣載體進行海上燃料庫
航運業的脫碳承諾正將氨定位為可行的氫載體。日本和韓國於2024年完成了全球首例卡車到船舶的加註作業,證明了端到端操作的安全性,並增強了港口當局的信心。國際海事組織提出的2050年將航運排放減半的目標,促使航運公司簽訂綠色氨供應合約。船級社對可使用氨燃料引擎的核准以及沿海船舶設計的推廣應用,正在降低技術風險,而碳價格預測則正在改善計劃的經濟效益。
天然氣價格波動推高了歐洲的生產成本。
由於天然氣現貨價格持續高於2022年之前的水平,歐洲生產商面臨長期的成本上漲。 CF Industries和BASF旗下的多家工廠已縮減產量,有效產能損失高達700萬噸。俄羅斯尿素進口填補了這一缺口,使區域政策目標的實現更加複雜。除非能源供應合約能夠確保價格競爭力,或藍氨維修能夠迅速推進,否則歐洲的尿素供應預計將落後於全球需求。
細分市場分析
到2024年,95%的氨市場噸位將以液態形式供應。與壓縮氫氣相比,液態氨具有更高的體積能量密度,便於海上燃料供應商進行經濟高效的儲存,並可用於遠距管道混合。隨著新的港口燃料庫中心、現場冷凍系統和專用沿海運輸船的運作,預計該細分市場將以1.94%的年成長率成長,略高於氨市場的整體成長速度。包括日本大型沿海運輸船原型在內的技術進步,支援更大的小包裹尺寸,從而降低了每噸氨的運輸成本。對低溫隔熱材料和檢測系統的投資減少了蒸發損失,進一步增強了液態氨的流動性優勢。
儘管氣態氨對於某些需要即時氣化的製程(例如某些聚合物和己內醯胺的合成)仍然至關重要,但其市場佔有率受到高昂處理成本的限制。安全法規限制了運輸壓力並要求使用厚壁鋼瓶,與冷藏液體運輸相比,這推高了物流成本。預計到2030年,液態氨產品仍將繼續主導氨市場,儘管在一些特定的石化製程領域,液態氨市場預計會有所成長。
區域分析
到2024年,亞太地區將佔全球氨市場佔有率的51.40%。中國的煤炭氣化維修和印度日產750噸的Hygenco計劃正在擴大低碳產能,而日本和韓國的港口已開始進行燃料庫試驗。提供可再生能源電力轉移和稅收優惠的區域性政策方案將進一步降低供應成本。位於印尼亞齊的混合型工廠為資源豐富但電力短缺的地區提供了一條合適的轉型路徑。
中東和非洲地區是成長最快的地區,預計2025年至2030年的複合年成長率將達到2.67%。埃及價值330億美元的項目儲備、摩洛哥價值10億美元的達赫拉計劃以及卡達價值12億美元的棕地擴建項目,都顯示各國雄心勃勃地希望透過綠色或藍色氨出口,將太陽能和風能資源貨幣化。墨西哥灣沿岸工程公司與一家造船廠的合作,正在提供技術支援並加快建設進度。
北美將充分利用豐富的頁岩氣資源和碳捕獲中心,以維持較低的邊際生產成本。 CF Industries公司1040萬噸的產能以及其在美國提案的37個計劃,如果獲得批准,預計將該地區的年產量從2100萬噸提升至7900萬噸。聯邦清潔氫能稅額扣抵將改善優質設施的經濟效益,而墨西哥灣沿岸港口則提供了通往歐洲和亞洲市場的深水通道。
歐洲正面臨高昂的天然氣價格和不確定的碳關稅。現貨價格波動導致產量持續下降,但技術供應商正在加速維修生產線,採用可捕獲高達99%二氧化碳的藍氨技術。進口依賴度不斷上升,俄羅斯尿素進口量的增加就是一個顯著的例子。儘管歐盟致力於提升國內能源安全,但其資本配置優先考慮的是下游無污染燃料承購契約,而非新建國內產能。
受採礦業和船用燃料需求的推動,拉丁美洲和大洋洲將迎來進一步成長。巴西阿庫港已確定興建一座年產100萬噸綠色氨的工廠,而澳洲鐵礦石開採的擴張將促進炸藥消費。
其他福利:
- Excel格式的市場預測(ME)表
- 3個月的分析師支持
目錄
第1章 引言
- 研究假設和市場定義
- 調查範圍
第2章調查方法
第3章執行摘要
第4章 市場情勢
- 市場概覽
- 市場促進因素
- 亞洲各地對低碳肥料的需求激增
- 日本和韓國採用氨作為海上燃料庫的氫氣載體
- 中國尿素廠煤改氣提振氨產量
- 火藥製造中用量增加
- 對綠色氨的需求不斷成長
- 市場限制
- 天然氣價格波動推高了歐洲的生產成本。
- 安全性和毒性方面的擔憂減緩了其在各行業的應用。
- 尿素供應過剩抑制了現貨氨的需求
- 價值鏈分析
- 技術展望
- 波特五力模型
- 供應商的議價能力
- 買方的議價能力
- 新進入者的威脅
- 替代品的威脅
- 競爭程度
第5章 市場規模與成長預測
- 按類型
- 液體
- 氣體
- 透過使用
- 氮肥中間體
- 冷媒(工業和低溫運輸)
- 用於炸藥和採礦的硝酸鹽
- 醫藥中間體
- 其他(清潔和家用產品、船用燃料和氫氣裝運船隻)
- 按最終用途行業分類
- 農業
- 紡織品
- 礦業
- 製藥
- 參考
- 其他(食品飲料、橡膠、水處理、石油、紙漿和造紙業)
- 按地區
- 亞太地區
- 中國
- 印度
- 日本
- 韓國
- ASEAN
- 澳洲
- 紐西蘭
- 亞太其他地區
- 北美洲
- 美國
- 加拿大
- 墨西哥
- 歐洲
- 德國
- 英國
- 法國
- 義大利
- 西班牙
- 北歐國家
- 其他歐洲地區
- 南美洲
- 巴西
- 阿根廷
- 南美洲其他地區
- 中東和非洲
- 沙烏地阿拉伯
- 阿拉伯聯合大公國
- 卡達
- 土耳其
- 南非
- 埃及
- 奈及利亞
- 其他中東和非洲地區
- 亞太地區
第6章 競爭情勢
- 市場集中度
- 策略趨勢
- 市佔率(%)/排名分析
- 公司簡介
- Acron PJSC
- BASF SE
- CF Industries Holdings Inc.
- CSBP
- Dyno Nobel
- EuroChem Group
- Group DF(Ostchem)
- Grupa Azoty
- IFFCO
- Industries Qatar
- JSC Togliattiazot
- Koch Fertilizer, LLC.
- LSB Industries
- Nutrien
- OCI
- Orica Limited
- PT Pupuk Sriwidjaja Palembang(Pusri)
- Rashtriya Chemicals and Fertilizers Limited
- SABIC
- Yara
第7章 市場機會與未來展望
The Ammonia Market size is estimated at 193.69 Million tons in 2025, and is expected to reach 210.81 Million tons by 2030, at a CAGR of 1.89% during the forecast period (2025-2030).
This steady topline belies a fundamental transition in production technologies, feedstock strategies, and downstream uses as decarbonization targets tighten, natural-gas price volatility persists, and low-carbon maritime fuels gain traction. Strategic investments in green and blue facilities, coal-to-gas upgrades in China, and the emergence of ammonia as a hydrogen carrier are repositioning supply chains, while rising safety requirements and urea oversupply keep short-term prices volatile. Producers able to lock in low-carbon feedstocks, secure renewable power, and form technology alliances are improving cost competitiveness, whereas Europe's gas-exposed assets remain under margin pressure. As these structural forces reshape the ammonia market, regional growth rates, product mixes, and trade flows are diverging more sharply than headline tonnage suggests.
Global Ammonia Market Trends and Insights
Surge in Low-Carbon Fertiliser Demand across Asia
Asia's agricultural pivot toward sustainability is accelerating low-carbon fertilizer uptake. China is upgrading coal-based assets with renewable electricity and carbon-capture systems, lifting demand for renewable ammonia blends. Indonesia's GAIA project introduces the first hybrid plant that co-feeds natural gas and electrolytic hydrogen, providing a scalable template for transition facilities. Policy incentives, such as preferential loan programs for sustainable inputs and tighter emission limits on conventional urea plants, are nudging farmers to premium products. The ripple effect is already evident in equipment orders for modular electrolysers and in long-term offtake contracts between fertilizer distributors and renewable electricity developers.
Adoption as Hydrogen Carrier for Maritime Bunkering
The maritime sector's decarbonization pledge is positioning ammonia as a practical hydrogen vector. Japan and South Korea completed the world's first truck-to-ship bunkering operation in 2024, demonstrating end-to-end handling safety and reinforcing confidence among port authorities. The International Maritime Organization's target to halve shipping emissions by 2050 has motivated carriers to lock in green ammonia supply agreements. Class-society approvals for ammonia-ready engines and the rollout of coastal carrier designs are lowering technical risk, while carbon-price forecasts improve project economics.
Volatile Natural-Gas Prices Inflating European Production Costs
European producers face chronic cost inflation as natural-gas spot prices remain above pre-2022 levels. Several plants operated by CF Industries and BASF have curtailed output, removing up to 7 million tons of effective capacity. Imports of Russian urea are back-filling the gap, complicating regional policy goals. Unless energy-sourcing contracts lock in competitive prices or blue-ammonia retrofits proceed swiftly, European supply is expected to lag global demand.
Other drivers and restraints analyzed in the detailed report include:
- Coal-to-Gas Conversion of Chinese Urea Plants
- Increasing Usage to Produce Explosives
- Safety & Toxicity Concerns
For complete list of drivers and restraints, kindly check the Table Of Contents.
Segment Analysis
Liquid product accounted for 95% of the ammonia market tonnage in 2024. This form benefits from higher volumetric energy density than compressed hydrogen, facilitating cost-effective storage for maritime bunker suppliers and long-distance pipeline blends. The segment is forecast to grow at 1.94% annually, slightly faster than the overall ammonia market, as new port bunkering hubs, on-site refrigeration systems, and specialized coastal carriers come online. Technological advances, including Japan's large-coastal-carrier prototypes, support larger parcel sizes that reduce delivered cost per ton. Investments in cryogenic insulation and detection systems mitigate boil-off losses, further reinforcing liquidity advantages.
The gaseous segment remains essential for processes requiring immediate gasification, such as certain polymer or caprolactam syntheses, yet its share is constrained by higher handling costs. Safety regulations limit transport pressures and demand thicker-walled cylinders, which inflates logistics expenses relative to refrigerated-liquid shipping. Although incremental growth is expected in niche petrochemical processes, liquid product will continue to dominate the ammonia market through 2030.
The Ammonia Market Report Segments the Industry by Type (Liquid and Gas), Application (Nitrogen Fertiliser Intermediate, Refrigerants (Industrial and Cold-Chain), Explosives and Mining Nitrates, and More), End-User Industry (Agriculture, Textiles, Mining, and More), and Geography (Asia-Pacific, North America, Europe, South America, and Middle East and Africa). The Market Forecasts are Provided in Terms of Volume (tons).
Geography Analysis
Asia-Pacific dominated the ammonia market with 51.40% share in 2024. China's coal-to-gas revamps and India's 750-ton-per-day Hygenco project expand low-carbon capacity, while Japanese and South Korean ports pioneer bunkering pilots. Regional policy packages offering renewable-power wheeling and tax rebates further lower delivered costs. Indonesia's hybrid plant in Aceh showcases transition pathways suited to resource-rich, power-constrained locations.
The Middle East and Africa region is the fastest-growing geography with a 2.67% CAGR projected for 2025-2030. Egypt's USD 33 billion deal pipeline, Morocco's billion-dollar Dakhla project, and Qatar's USD 1.2 billion brownfield expansion illustrate sovereign ambitions to monetize solar and wind resources through green or blue ammonia exports. Gulf Coast engineering firms and shipyard alliances provide technical expertise, accelerating construction timelines.
North America leverages abundant shale gas and carbon-capture hubs to keep marginal production costs low. CF Industries' 10.4 million-ton capacity and 37 US project proposals could raise regional output from 21 million to 79 million tons annually if sanctioned. Federal clean-hydrogen tax credits improve economics for blue facilities, and Gulf Coast ports offer deep-water access to European and Asian markets.
Europe wrestles with high gas prices and uncertain carbon-border tariffs. Production curtailments continue as spot prices remain volatile, though technology providers are accelerating blue-ammonia retrofits with up to 99% CO2 capture rates. Import dependence is rising, highlighted by increasing Russian urea inflows. Although the European Union seeks to promote domestic energy security, capital allocation favors downstream clean-fuel offtake agreements more than new indigenous capacity.
Latin America and Oceania add incremental growth through mining and bunker-fuel demand. Brazil's Port of Acu reserves land for a 1 million-ton green-ammonia facility, while Australia's iron-ore expansion drives explosives consumption.
- Acron PJSC
- BASF SE
- CF Industries Holdings Inc.
- CSBP
- Dyno Nobel
- EuroChem Group
- Group DF (Ostchem)
- Grupa Azoty
- IFFCO
- Industries Qatar
- JSC Togliattiazot
- Koch Fertilizer, LLC.
- LSB Industries
- Nutrien
- OCI
- Orica Limited
- PT Pupuk Sriwidjaja Palembang (Pusri)
- Rashtriya Chemicals and Fertilizers Limited
- SABIC
- Yara
Additional Benefits:
- The market estimate (ME) sheet in Excel format
- 3 months of analyst support
TABLE OF CONTENTS
1 Introduction
- 1.1 Study Assumptions and Market Definition
- 1.2 Scope of the Study
2 Research Methodology
3 Executive Summary
4 Market Landscape
- 4.1 Market Overview
- 4.2 Market Drivers
- 4.2.1 Surge in Low-Carbon Fertiliser Demand across Asia
- 4.2.2 Ammonia Adoption as Hydrogen Carrier for Maritime Bunkering in Japan and South Korea
- 4.2.3 Coal-to-Gas Conversion of Chinese Urea Plants Boosting Ammonia Off-take
- 4.2.4 Increasing Usage to Produce Explosives
- 4.2.5 Rising Demand for Green Ammonia
- 4.3 Market Restraints
- 4.3.1 Volatile Natural-Gas Prices Inflating European Production Costs
- 4.3.2 Safety and Toxicity Concerns Slowing its usage across various industries
- 4.3.3 Urea Over-supply Suppressing Spot Ammonia Demand
- 4.4 Value Chain Analysis
- 4.5 Technological Outlook
- 4.6 Porter's Five Forces
- 4.6.1 Bargaining Power of Suppliers
- 4.6.2 Bargaining Power of Buyers
- 4.6.3 Threat of New Entrants
- 4.6.4 Threat of Substitute Products and Services
- 4.6.5 Degree of Competition
5 Market Size and Growth Forecasts (Volume)
- 5.1 By Type
- 5.1.1 Liquid
- 5.1.2 Gas
- 5.2 By Application
- 5.2.1 Nitrogen Fertiliser Intermediate
- 5.2.2 Refrigerants (Industrial and Cold-Chain)
- 5.2.3 Explosives and Mining Nitrates
- 5.2.4 Pharmaceutical Intermediates
- 5.2.5 Others (Cleaning and Household Products and Marine Bunker Fuel / Hydrogen Carrier)
- 5.3 By End-use Industry
- 5.3.1 Agriculture
- 5.3.2 Textiles
- 5.3.3 Mining
- 5.3.4 Pharmaceutical
- 5.3.5 Referigeration
- 5.3.6 Others (Food and Beverage, Rubber, Water Treatment, Petroleum, and Pulp and Paper Industries)
- 5.4 By Geography
- 5.4.1 Asia-Pacific
- 5.4.1.1 China
- 5.4.1.2 India
- 5.4.1.3 Japan
- 5.4.1.4 South Korea
- 5.4.1.5 ASEAN
- 5.4.1.6 Australia
- 5.4.1.7 New Zealand
- 5.4.1.8 Rest of Asia-Pacific
- 5.4.2 North America
- 5.4.2.1 United States
- 5.4.2.2 Canada
- 5.4.2.3 Mexico
- 5.4.3 Europe
- 5.4.3.1 Germany
- 5.4.3.2 United Kingdom
- 5.4.3.3 France
- 5.4.3.4 Italy
- 5.4.3.5 Spain
- 5.4.3.6 Nordics
- 5.4.3.7 Rest of Europe
- 5.4.4 South America
- 5.4.4.1 Brazil
- 5.4.4.2 Argentina
- 5.4.4.3 Rest of South America
- 5.4.5 Middle East and Africa
- 5.4.5.1 Saudi Arabia
- 5.4.5.2 United Arab Emirates
- 5.4.5.3 Qatar
- 5.4.5.4 Turkey
- 5.4.5.5 South Africa
- 5.4.5.6 Egypt
- 5.4.5.7 Nigeria
- 5.4.5.8 Rest of Middle East and Africa
- 5.4.1 Asia-Pacific
6 Competitive Landscape
- 6.1 Market Concentration
- 6.2 Strategic Moves
- 6.3 Market Share (%)/Ranking Analysis
- 6.4 Company Profiles (includes Global level Overview, Market level overview, Core Segments, Financials as available, Strategic Information, Market Rank/Share for key companies, Products and Services, and Recent Developments)
- 6.4.1 Acron PJSC
- 6.4.2 BASF SE
- 6.4.3 CF Industries Holdings Inc.
- 6.4.4 CSBP
- 6.4.5 Dyno Nobel
- 6.4.6 EuroChem Group
- 6.4.7 Group DF (Ostchem)
- 6.4.8 Grupa Azoty
- 6.4.9 IFFCO
- 6.4.10 Industries Qatar
- 6.4.11 JSC Togliattiazot
- 6.4.12 Koch Fertilizer, LLC.
- 6.4.13 LSB Industries
- 6.4.14 Nutrien
- 6.4.15 OCI
- 6.4.16 Orica Limited
- 6.4.17 PT Pupuk Sriwidjaja Palembang (Pusri)
- 6.4.18 Rashtriya Chemicals and Fertilizers Limited
- 6.4.19 SABIC
- 6.4.20 Yara
7 Market Opportunities and Future Outlook
- 7.1 Ammonia Refrigeration Retrofitting in Food Retail
- 7.2 Carbon Capture and Storage (CCS) Integration for Blue Ammonia
- 7.3 White-space and Unmet-need Assessment
 全球氨市場:按類型、銷售管道、終端用戶產業和地區分類-預測(至2031年)
 氨市場:按類型、製造流程、水分含量、物理狀態、純度等級、應用、最終用途和分銷管道分類-2026-2032年全球市場預測
 液態有機氫載體市場預測至2034年-全球分析(按載體類型、製程類型、組成、技術類型、分銷模式、業務規模、經營模式、應用、最終用戶和地區分類)
 氨市場規模、佔有率、趨勢和預測:按物理形態、應用、最終用途行業和地區分類,2026-2034年
 2026年全球液態有機氫載體(LOHC)脫氫裝置裝置市場報告無水氨蒸發器市場:按類型、熱源、容量、終端用戶產業、應用和銷售管道,全球預測,2026-2032年
 氨市場分析及預測(至2035年):類型、產品、應用、技術、終端用戶、製程、組件、簡介
 2026-2034年全球氨市場規模、佔有率、趨勢和成長分析報告2026年全球氨市場報告全球藍色低碳氨市場按產品類型、技術、原料、應用和最終用途產業分類的預測(2026-2032年)