


 |
市場調查報告書
商品編碼
1854910
青氨的全球市場(~2035年):各技術類型,用途類別,流通管道類別,各地區,產業趨勢,預測Blue Ammonia Market, Till 2035: Distribution by Type of Technology, Type of Application, Type of Distribution Channel, and Geographical Regions: Industry Trends and Global Forecasts |
||||||
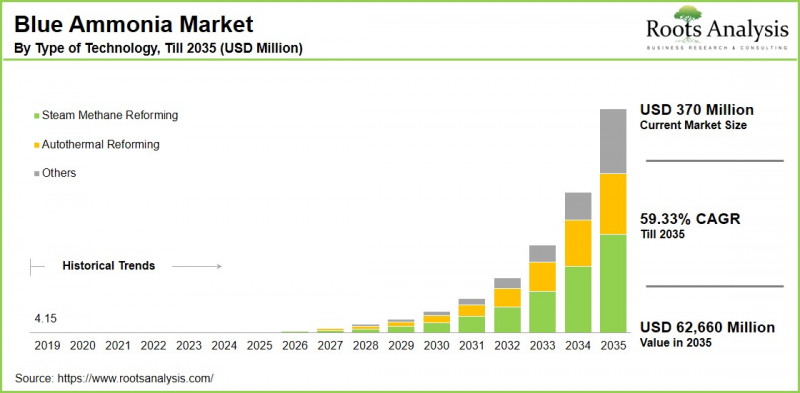
全球藍氨市場預計將從目前的 3.7 億美元增長到 2035 年的 626.6 億美元,預測期內複合年增長率 (CAGR) 為 59.33%。
青氨市場:成長和趨勢
藍氨是一種採用限制碳排放的方法所生產的氨。藍氨的生產提供了一種氨脫碳途徑,使其成為能源產業一種前景廣闊且用途廣泛的替代燃料。氨通常使用天然氣生產,但與傳統氨不同,碳捕獲技術可以減少二氧化碳排放。由於藍氨與綠氨一樣低碳,因此它日益被視為農業應用的可行選擇,在農業中,氨主要用作富氮肥料。
此外,能源領域的快速發展正在推動全球對清潔、環保能源的需求,從而促進市場成長。由於藍氨具有高能量密度和完善的運輸基礎設施,使其成為理想的能源載體,因此能源領域對藍氨市場的興趣日益濃厚。例如,它可以作為氫載體進行長期儲存和運輸,並可用作氫動力渦輪機和燃料電池的燃料。此外,目前正在研究將其用作碳中和發電燃料,尤其是在減少二氧化碳排放至關重要的海事領域。
此外,更有效率的碳捕獲與封存 (CCS) 技術的發展,透過捕獲二氧化碳,使藍氨的生產更加可行且更具成本效益,從而增加了對藍氨的需求。
在對永續氨解決方案和環保肥料的需求,以及對氣候變遷目標和淨零排放承諾等行業趨勢變化的推動下,預計藍氨市場在預測期內將顯著增長。
本報告分析了全球藍氨市場,並提供了市場規模估算、機會分析、競爭格局和公司概況。
目錄
章節1 報告概要
第1章 序文
第2章 調查手法
第3章 市場動態
第4章 宏觀經濟指標
章節2 定性性的知識和見識
第5章 摘要整理
第6章 簡介
第7章 法規Scenario
章節3 市場概要
第8章 主要企業整體性資料庫
第9章 競爭情形
第10章 閒置頻段的分析
第11章 企業的競爭力的分析
第12章 青氨市場上Start-Ups生態系統
章節4 企業簡介
第13章 企業簡介
- 章概要
- Air Liquide
- Ammonia Casale
- CF Industries Holdings
- Dastur Energy
- Equinor ASA
- ExxonMobil
- Hydrofuel
- ITOCHU
- Linde Plc
- LSB Industries
- Ma'aden
- Mitsubishi Heavy Industries
- Nutrien
- OCI
- PAO NOVATEK
- Saudi Arabian Oil
- Shell
- Tecnicas Reunidas
- Uniper
- Yara International
章節5 市場趨勢
第14章 大趨勢的分析
第15章 未滿足需求的分析
第16章 專利分析
第17章 近幾年的發展
章節6 市場機會分析
第18章 全球青氨市場
第19章 市場機會:各技術類型
第20章 市場機會:用途類別
第21章 市場機會:流通管道類別
第22章 北美的青氨市場機會
第23章 歐洲的青氨市場機會
第24章 亞洲的青氨市場機會
第25章 中東·北非(MENA)的青氨市場機會
第26章 南美的青氨市場機會
第27章 其他地區的青氨市場機會
第28章 市場集中的分析:各主要企業
第29章 鄰近市場的分析
章節7 策略性工具
第30章 重要的勝利策略
第31章 波特的五力分析
第32章 SWOT的分析
第33章 價值鏈的分析
第34章 Roots的策略性建議
章節8 其他獨家知識和見識
第35章 初步研究結果
第36章 報告的結論
章節9 附錄
Blue Ammonia Market Overview
As per Roots Analysis, the global blue ammonia market size is estimated to grow from USD 370 million in the current year USD 62.66 billion by 2035, at a CAGR of 59.33% during the forecast period, till 2035.
The opportunity for blue ammonia market has been distributed across the following segments:
Type of Technology
- Autothermal Reforming
- Gas Partial Oxidation
- Steam Methane Reforming
Type of Application
- Fertilizers
- Industrial Chemicals
- Industrial Feedstock
- Marine Fuel
- Power Generation
- Transportation
Type of Distribution Channel
- Direct Sale
- E-commerce
- Wholesalers
Geographical Regions
- North America
- US
- Canada
- Mexico
- Other North American countries
- Europe
- Austria
- Belgium
- Denmark
- France
- Germany
- Ireland
- Italy
- Netherlands
- Norway
- Russia
- Spain
- Sweden
- Switzerland
- UK
- Other European countries
- Asia
- China
- India
- Japan
- Singapore
- South Korea
- Other Asian countries
- Latin America
- Brazil
- Chile
- Colombia
- Venezuela
- Other Latin American countries
- Middle East and North Africa
- Egypt
- Iran
- Iraq
- Israel
- Kuwait
- Saudi Arabia
- UAE
- Other MENA countries
- Rest of the World
- Australia
- New Zealand
- Other countries
Blue Ammonia Market: Growth and Trends
Blue ammonia refers to a type of ammonia produced through a method that limits carbon emissions. The production of blue ammonia offers a way to decarbonize ammonia, making it a promising and versatile alternative fuel for the energy industry. Typically, it is generated using natural gas, but unlike conventional ammonia, its carbon capture technology reduces the emissions of carbon dioxide. Being a lower-carbon variant, blue ammonia, similar to green ammonia, is increasingly seen as a viable option for agricultural applications where ammonia is primarily utilized as a nitrogen-rich fertilizer.
Moreover, the swift advancements in the energy sector are boosting the worldwide demand for clean and green energy, driving market growth. The blue ammonia market is experiencing heightened interest from the energy sector due to its high energy density and established transportation infrastructure, which position it as an ideal energy carrier. For example, it can serve as a hydrogen carrier for prolonged storage and transport and can be utilized as fuel for hydrogen-powered turbines or fuel cells. Furthermore, it is also being investigated as a carbon-neutral fuel for electricity generation, particularly in the maritime sector where reducing carbon emissions is essential.
In addition, the ongoing development of more effective carbon capture and storage (CCS) technologies has rendered blue ammonia production more feasible and cost-efficient by capturing carbon dioxide, thus increasing the demand for blue ammonia.
Driven by the demand for sustainable ammonia solutions and green fertilizers, along with evolving industry trends such as a heightened focus on climate change objectives and Net-Zero commitments, the blue ammonia market is expected to grow significantly during the forecast period.
Blue ammonia Market: Key Segments
Market Share by Type of Technology
Based on type of technology, the global blue ammonia market is segmented into autothermal reforming, gas partial oxidation, and steam methane reforming. According to our estimates, currently, the steam methane reforming technology captures the majority of the market share. This is due to the prevalent adoption of steam methane reforming along with carbon capture and storage technology, which is the most commercially feasible method for producing blue ammonia.
However, the autothermal reforming technology is expected to grow at a higher CAGR throughout the forecast period. This growth is fueled by its integration of heat production into the reforming process, which potentially increases efficiency and lowers emissions.
Market Share by Type of Application
Based on type of application, the global blue ammonia market is segmented into fertilizers, industrial chemicals, industrial feedstock, marine fuel, power generation, and transportation. According to our estimates, currently, the fertilizers segment captures the majority of the market share. This growth can be linked to the high demand for ammonia, which is primarily utilized in the production of fertilizers such as ammonium nitrate, urea, and ammonium phosphate.
On the other hand, the power generation segment is expected to grow at a higher CAGR throughout the forecast period, driven by the push for decarbonization in the power sector.
Market Share by Type of Distribution Channel
Based on type of distribution channel, the global blue ammonia market is segmented into direct sale, e-commerce, and wholesalers. According to our estimates, currently, the direct sales segment captures the majority of the market share. Blue ammonia is primarily sold in large volumes to industrial clients, ranging from power generation firms to fertilizer producers. The transactions between producers and purchasers are typically long-term arrangements that involve intricate contracts and direct negotiations.
On the other hand, the e-commerce platforms are expected to grow at a higher CAGR throughout the forecast period, due to its technical complexities and safety concerns.
Market Share by Geographical Regions
Based on geographical regions, the blue ammonia market is segmented into North America, Europe, Asia, Latin America, Middle East and North Africa, and the rest of the world. According to our estimates, currently, North America captures the majority share of the market. On the other hand, the market in Europe is expected to grow at a higher CAGR throughout the forecast period, due to the increasing demand from the energy sector and the rising transition toward green energy alternatives.
Example Players in Blue Ammonia Market
- Air Liquid
- Ammonia Casale
- CF Industries Holdings
- Dastur Energy
- Equinor ASA
- EuroChem
- ExxnMobil
- Hydrofuel Canada
- ITOUCHU
- Linde Ple
- LSB
- Ma'aden
- Mitsubishi Heavy Industries
- Nutrien
- OCI
- PAO NOVATEK
- Saudi Arabian Oil
- Shell
- Siemens Energy
- Tecnicas Reunidas
- Uniper
- Yara International
Blue Ammonia Market: Research Coverage
The report on the blue ammonia market features insights on various sections, including:
- Market Sizing and Opportunity Analysis: An in-depth analysis of the blue ammonia market, focusing on key market segments, including [A] type of technology, [B] type of application, [C] type of distribution channel, and [D] geographical regions.
- Competitive Landscape: A comprehensive analysis of the companies engaged in the blue ammonia market, based on several relevant parameters, such as [A] year of establishment, [B] company size, [C] location of headquarters and [D] ownership structure.
- Company Profiles: Elaborate profiles of prominent players engaged in the blue ammonia market, providing details on [A] location of headquarters, [B] company size, [C] company mission, [D] company footprint, [E] management team, [F] contact details, [G] financial information, [H] operating business segments, [I] blue ammonia portfolio, [J] moat analysis, [K] recent developments, and an informed future outlook.
- Megatrends: An evaluation of ongoing megatrends in the blue ammonia industry.
- Patent Analysis: An insightful analysis of patents filed / granted in the blue ammonia domain, based on relevant parameters, including [A] type of patent, [B] patent publication year, [C] patent age and [D] leading players.
- Recent Developments: An overview of the recent developments made in the blue ammonia market, along with analysis based on relevant parameters, including [A] year of initiative, [B] type of initiative, [C] geographical distribution and [D] most active players.
- Porter's Five Forces Analysis: An analysis of five competitive forces prevailing in the blue ammonia market, including threats of new entrants, bargaining power of buyers, bargaining power of suppliers, threats of substitute products and rivalry among existing competitors.
- SWOT Analysis: An insightful SWOT framework, highlighting the strengths, weaknesses, opportunities and threats in the domain. Additionally, it provides Harvey ball analysis, highlighting the relative impact of each SWOT parameter.
- Value Chain Analysis: A comprehensive analysis of the value chain, providing information on the different phases and stakeholders involved in the blue ammonia market.
Key Questions Answered in this Report
- How many companies are currently engaged in blue ammonia market?
- Which are the leading companies in this market?
- What factors are likely to influence the evolution of this market?
- What is the current and future market size?
- What is the CAGR of this market?
- How is the current and future market opportunity likely to be distributed across key market segments?
Reasons to Buy this Report
- The report provides a comprehensive market analysis, offering detailed revenue projections of the overall market and its specific sub-segments. This information is valuable to both established market leaders and emerging entrants.
- Stakeholders can leverage the report to gain a deeper understanding of the competitive dynamics within the market. By analyzing the competitive landscape, businesses can make informed decisions to optimize their market positioning and develop effective go-to-market strategies.
- The report offers stakeholders a comprehensive overview of the market, including key drivers, barriers, opportunities, and challenges. This information empowers stakeholders to stay abreast of market trends and make data-driven decisions to capitalize on growth prospects.
Additional Benefits
- Complimentary Excel Data Packs for all Analytical Modules in the Report
- 15% Free Content Customization
- Detailed Report Walkthrough Session with Research Team
- Free Updated report if the report is 6-12 months old or older
TABLE OF CONTENTS
SECTION I: REPORT OVERVIEW
1. PREFACE
- 1.1. Introduction
- 1.2. Market Share Insights
- 1.3. Key Market Insights
- 1.4. Report Coverage
- 1.5. Key Questions Answered
- 1.6. Chapter Outlines
2. RESEARCH METHODOLOGY
- 2.1. Chapter Overview
- 2.2. Research Assumptions
- 2.3. Database Building
- 2.3.1. Data Collection
- 2.3.2. Data Validation
- 2.3.3. Data Analysis
- 2.4. Project Methodology
- 2.4.1. Secondary Research
- 2.4.1.1. Annual Reports
- 2.4.1.2. Academic Research Papers
- 2.4.1.3. Company Websites
- 2.4.1.4. Investor Presentations
- 2.4.1.5. Regulatory Filings
- 2.4.1.6. White Papers
- 2.4.1.7. Industry Publications
- 2.4.1.8. Conferences and Seminars
- 2.4.1.9. Government Portals
- 2.4.1.10. Media and Press Releases
- 2.4.1.11. Newsletters
- 2.4.1.12. Industry Databases
- 2.4.1.13. Roots Proprietary Databases
- 2.4.1.14. Paid Databases and Sources
- 2.4.1.15. Social Media Portals
- 2.4.1.16. Other Secondary Sources
- 2.4.2. Primary Research
- 2.4.2.1. Introduction
- 2.4.2.2. Types
- 2.4.2.2.1. Qualitative
- 2.4.2.2.2. Quantitative
- 2.4.2.3. Advantages
- 2.4.2.4. Techniques
- 2.4.2.4.1. Interviews
- 2.4.2.4.2. Surveys
- 2.4.2.4.3. Focus Groups
- 2.4.2.4.4. Observational Research
- 2.4.2.4.5. Social Media Interactions
- 2.4.2.5. Stakeholders
- 2.4.2.5.1. Company Executives (CXOs)
- 2.4.2.5.2. Board of Directors
- 2.4.2.5.3. Company Presidents and Vice Presidents
- 2.4.2.5.4. Key Opinion Leaders
- 2.4.2.5.5. Research and Development Heads
- 2.4.2.5.6. Technical Experts
- 2.4.2.5.7. Subject Matter Experts
- 2.4.2.5.8. Scientists
- 2.4.2.5.9. Doctors and Other Healthcare Providers
- 2.4.2.6. Ethics and Integrity
- 2.4.2.6.1. Research Ethics
- 2.4.2.6.2. Data Integrity
- 2.4.3. Analytical Tools and Databases
- 2.4.1. Secondary Research
3. MARKET DYNAMICS
- 3.1. Forecast Methodology
- 3.1.1. Top-Down Approach
- 3.1.2. Bottom-Up Approach
- 3.1.3. Hybrid Approach
- 3.2. Market Assessment Framework
- 3.2.1. Total Addressable Market (TAM)
- 3.2.2. Serviceable Addressable Market (SAM)
- 3.2.3. Serviceable Obtainable Market (SOM)
- 3.2.4. Currently Acquired Market (CAM)
- 3.3. Forecasting Tools and Techniques
- 3.3.1. Qualitative Forecasting
- 3.3.2. Correlation
- 3.3.3. Regression
- 3.3.4. Time Series Analysis
- 3.3.5. Extrapolation
- 3.3.6. Convergence
- 3.3.7. Forecast Error Analysis
- 3.3.8. Data Visualization
- 3.3.9. Scenario Planning
- 3.3.10. Sensitivity Analysis
- 3.4. Key Considerations
- 3.4.1. Demographics
- 3.4.2. Market Access
- 3.4.3. Reimbursement Scenarios
- 3.4.4. Industry Consolidation
- 3.5. Robust Quality Control
- 3.6. Key Market Segmentations
- 3.7. Limitations
4. MACRO-ECONOMIC INDICATORS
- 4.1. Chapter Overview
- 4.2. Market Dynamics
- 4.2.1. Time Period
- 4.2.1.1. Historical Trends
- 4.2.1.2. Current and Forecasted Estimates
- 4.2.2. Currency Coverage
- 4.2.2.1. Overview of Major Currencies Affecting the Market
- 4.2.2.2. Impact of Currency Fluctuations on the Industry
- 4.2.3. Foreign Exchange Impact
- 4.2.3.1. Evaluation of Foreign Exchange Rates and Their Impact on Market
- 4.2.3.2. Strategies for Mitigating Foreign Exchange Risk
- 4.2.4. Recession
- 4.2.4.1. Historical Analysis of Past Recessions and Lessons Learnt
- 4.2.4.2. Assessment of Current Economic Conditions and Potential Impact on the Market
- 4.2.5. Inflation
- 4.2.5.1. Measurement and Analysis of Inflationary Pressures in the Economy
- 4.2.5.2. Potential Impact of Inflation on the Market Evolution
- 4.2.6. Interest Rates
- 4.2.6.1. Overview of Interest Rates and Their Impact on the Market
- 4.2.6.2. Strategies for Managing Interest Rate Risk
- 4.2.7. Commodity Flow Analysis
- 4.2.7.1. Type of Commodity
- 4.2.7.2. Origins and Destinations
- 4.2.7.3. Values and Weights
- 4.2.7.4. Modes of Transportation
- 4.2.8. Global Trade Dynamics
- 4.2.8.1. Import Scenario
- 4.2.8.2. Export Scenario
- 4.2.9. War Impact Analysis
- 4.2.9.1. Russian-Ukraine War
- 4.2.9.2. Israel-Hamas War
- 4.2.10. COVID Impact / Related Factors
- 4.2.10.1. Global Economic Impact
- 4.2.10.2. Industry-specific Impact
- 4.2.10.3. Government Response and Stimulus Measures
- 4.2.10.4. Future Outlook and Adaptation Strategies
- 4.2.11. Other Indicators
- 4.2.11.1. Fiscal Policy
- 4.2.11.2. Consumer Spending
- 4.2.11.3. Gross Domestic Product (GDP)
- 4.2.11.4. Employment
- 4.2.11.5. Taxes
- 4.2.11.6. R&D Innovation
- 4.2.11.7. Stock Market Performance
- 4.2.11.8. Supply Chain
- 4.2.11.9. Cross-Border Dynamics
- 4.2.1. Time Period
SECTION II: QUALITATIVE INSIGHTS
5. EXECUTIVE SUMMARY
6. INTRODUCTION
- 6.1. Chapter Overview
- 6.2. Overview of Blue Ammonia Market
- 6.2.1. Type of Technology
- 6.2.2. Type of Application
- 6.2.3. Type of Distribution Channel
- 6.3. Future Perspective
7. REGULATORY SCENARIO
SECTION III: MARKET OVERVIEW
8. COMPREHENSIVE DATABASE OF LEADING PLAYERS
9. COMPETITIVE LANDSCAPE
- 9.1. Chapter Overview
- 9.2. Blue Ammonia: Overall Market Landscape
- 9.2.1. Analysis by Year of Establishment
- 9.2.2. Analysis by Company Size
- 9.2.3. Analysis by Location of Headquarters
- 9.2.4. Analysis by Ownership Structure
10. WHITE SPACE ANALYSIS
11. COMPANY COMPETITIVENESS ANALYSIS
12. STARTUP ECOSYSTEM IN THE BLUE AMMONIA MARKET
- 12.1. Blue Ammonia: Market Landscape of Startups
- 12.1.1. Analysis by Year of Establishment
- 12.1.2. Analysis by Company Size
- 12.1.3. Analysis by Company Size and Year of Establishment
- 12.1.4. Analysis by Location of Headquarters
- 12.1.5. Analysis by Company Size and Location of Headquarters
- 12.1.6. Analysis by Ownership Structure
- 12.2. Key Findings
SECTION IV: COMPANY PROFILES
13. COMPANY PROFILES
- 13.1. Chapter Overview
- 13.2. Air Liquide *
- 13.2.1. Company Overview
- 13.2.2. Company Mission
- 13.2.3. Company Footprint
- 13.2.4. Management Team
- 13.2.5. Contact Details
- 13.2.6. Financial Performance
- 13.2.7. Operating Business Segments
- 13.2.8. Service / Product Portfolio (project specific)
- 13.2.9. MOAT Analysis
- 13.2.10. Recent Developments and Future Outlook
- 13.3. Ammonia Casale
- 13.4. CF Industries Holdings
- 13.5. Dastur Energy
- 13.6. Equinor ASA
- 13.7. ExxonMobil
- 13.8. Hydrofuel
- 13.9. ITOCHU
- 13.10. Linde Plc
- 13.11. LSB Industries
- 13.12. Ma'aden
- 13.13. Mitsubishi Heavy Industries
- 13.14. Nutrien
- 13.15. OCI
- 13.16. PAO NOVATEK
- 13.17. Saudi Arabian Oil
- 13.18. Shell
- 13.19. Tecnicas Reunidas
- 13.20. Uniper
- 13.21. Yara International
SECTION V: MARKET TRENDS
14. MEGA TRENDS ANALYSIS
15. UNMEET NEED ANALYSIS
16. PATENT ANALYSIS
17. RECENT DEVELOPMENTS
- 17.1. Chapter Overview
- 17.2. Recent Funding
- 17.3. Recent Partnerships
- 17.4. Other Recent Initiatives
SECTION VI: MARKET OPPORTUNITY ANALYSIS
18. GLOBAL BLUE AMMONIA MARKET
- 18.1. Chapter Overview
- 18.2. Key Assumptions and Methodology
- 18.3. Trends Disruption Impacting Market
- 18.4. Demand Side Trends
- 18.5. Supply Side Trends
- 18.6. Global Blue Ammonia, Historical Trends (Since 2019) and Forecasted Estimates (Till 2035)
- 18.7. Multivariate Scenario Analysis
- 18.7.1. Conservative Scenario
- 18.7.2. Optimistic Scenario
- 18.8. Investment Feasibility Index
- 18.9. Key Market Segmentations
19. MARKET OPPORTUNITIES BASED ON TYPE OF TECHNOLOGY
- 19.1. Chapter Overview
- 19.2. Key Assumptions and Methodology
- 19.3. Revenue Shift Analysis
- 19.4. Market Movement Analysis
- 19.5. Penetration-Growth (P-G) Matrix
- 19.6. Blue Ammonia Market for Autothermal Reforming: Historical Trends (Since 2019) and Forecasted Estimates (Till 2035)
- 19.7. Blue Ammonia Market for Gas Partial Oxidation: Historical Trends (Since 2019) and Forecasted Estimates (Till 2035)
- 19.8. Blue Ammonia Market for Steam Methane Reforming: Historical Trends (Since 2019) and Forecasted Estimates (Till 2035)
- 19.9. Data Triangulation and Validation
- 19.9.1. Secondary Sources
- 19.9.2. Primary Sources
- 19.9.3. Statistical Modeling
20. MARKET OPPORTUNITIES BASED ON TYPE OF APPLICATION
- 20.1. Chapter Overview
- 20.2. Key Assumptions and Methodology
- 20.3. Revenue Shift Analysis
- 20.4. Market Movement Analysis
- 20.5. Penetration-Growth (P-G) Matrix
- 20.6. Blue Ammonia Market for Fertilizers: Historical Trends (Since 2019) and Forecasted Estimates (Till 2035)
- 20.7. Blue Ammonia Market for Industrial Chemicals: Historical Trends (Since 2019) and Forecasted Estimates (Till 2035)
- 20.8. Blue Ammonia Market for Industrial Feedstock: Historical Trends (Since 2019) and Forecasted Estimates (Till 2035)
- 20.9. Blue Ammonia Market for Marine Fuel: Historical Trends (Since 2019) and Forecasted Estimates (Till 2035)
- 20.10. Blue Ammonia Market for Power Generation: Historical Trends (Since 2019) and Forecasted Estimates (Till 2035)
- 20.11. Blue Ammonia Market for Transportation: Historical Trends (Since 2019) and Forecasted Estimates (Till 2035)
- 20.12. Data Triangulation and Validation
- 20.12.1. Secondary Sources
- 20.12.2. Primary Sources
- 20.12.3. Statistical Modeling
21. MARKET OPPORTUNITIES BASED ON TYPE OF DISTRIBUTION CHANNEL
- 21.1. Chapter Overview
- 21.2. Key Assumptions and Methodology
- 21.3. Revenue Shift Analysis
- 21.4. Market Movement Analysis
- 21.5. Penetration-Growth (P-G) Matrix
- 21.6. Blue Ammonia Market for Direct Sale: Historical Trends (Since 2019) and Forecasted Estimates (Till 2035)
- 21.7. Blue Ammonia Market for E-commerce: Historical Trends (Since 2019) and Forecasted Estimates (Till 2035)
- 21.7. Blue Ammonia Market for Wholesalers: Historical Trends (Since 2019) and Forecasted Estimates (Till 2035)
- 21.8. Data Triangulation and Validation
- 21.8.1. Secondary Sources
- 21.8.2. Primary Sources
- 21.8.3. Statistical Modeling
22. MARKET OPPORTUNITIES FOR BLUE AMMONIA IN NORTH AMERICA
- 22.1. Chapter Overview
- 22.2. Key Assumptions and Methodology
- 22.3. Revenue Shift Analysis
- 22.4. Market Movement Analysis
- 22.5. Penetration-Growth (P-G) Matrix
- 22.6. Blue Ammonia Market in North America: Historical Trends (Since 2019) and Forecasted Estimates (Till 2035)
- 22.6.1. Blue Ammonia Market in the US: Historical Trends (Since 2019) and Forecasted Estimates (Till 2035)
- 22.6.2. Blue Ammonia Market in Canada: Historical Trends (Since 2019) and Forecasted Estimates (Till 2035)
- 22.6.3. Blue Ammonia Market in Mexico: Historical Trends (Since 2019) and Forecasted Estimates (Till 2035)
- 22.6.4. Blue Ammonia Market in Other North American Countries: Historical Trends (Since 2019) and Forecasted Estimates (Till 2035)
- 22.7. Data Triangulation and Validation
23. MARKET OPPORTUNITIES FOR BLUE AMMONIA IN EUROPE
- 23.1. Chapter Overview
- 23.2. Key Assumptions and Methodology
- 23.3. Revenue Shift Analysis
- 23.4. Market Movement Analysis
- 23.5. Penetration-Growth (P-G) Matrix
- 23.6. Blue Ammonia Market in Europe: Historical Trends (Since 2019) and Forecasted Estimates (Till 2035)
- 23.6.1. Blue Ammonia Market in Austria: Historical Trends (Since 2019) and Forecasted Estimates (Till 2035)
- 23.6.2. Blue Ammonia Market in Belgium: Historical Trends (Since 2019) and Forecasted Estimates (Till 2035)
- 23.6.3. Blue Ammonia Market in Denmark: Historical Trends (Since 2019) and Forecasted Estimates (Till 2035)
- 23.6.4. Blue Ammonia Market in France: Historical Trends (Since 2019) and Forecasted Estimates (Till 2035)
23..5. Blue Ammonia Market in Germany: Historical Trends (Since 2019) and Forecasted Estimates (Till 2035)
- 23.6.6. Blue Ammonia Market in Ireland: Historical Trends (Since 2019) and Forecasted Estimates (Till 2035)
- 23.6.7. Blue Ammonia Market in Italy: Historical Trends (Since 2019) and Forecasted Estimates (Till 2035)
- 23.6.8. Blue Ammonia Market in Netherlands: Historical Trends (Since 2019) and Forecasted Estimates (Till 2035)
- 23.6.9. Blue Ammonia Market in Norway: Historical Trends (Since 2019) and Forecasted Estimates (Till 2035)
- 23.6.10. Blue Ammonia Market in Russia: Historical Trends (Since 2019) and Forecasted Estimates (Till 2035)
- 23.6.11. Blue Ammonia Market in Spain: Historical Trends (Since 2019) and Forecasted Estimates (Till 2035)
- 23.6.12. Blue Ammonia Market in Sweden: Historical Trends (Since 2019) and Forecasted Estimates (Till 2035)
- 23.6.13. Blue Ammonia Market in Switzerland: Historical Trends (Since 2019) and Forecasted Estimates (Till 2035)
- 23.6.14. Blue Ammonia Market in the UK: Historical Trends (Since 2019) and Forecasted Estimates (Till 2035)
- 23.6.15. Blue Ammonia Market in Other European Countries: Historical Trends (Since 2019) and Forecasted Estimates (Till 2035)
- 23.7. Data Triangulation and Validation
24. MARKET OPPORTUNITIES FOR BLUE AMMONIA IN ASIA
- 24.1. Chapter Overview
- 24.2. Key Assumptions and Methodology
- 24.3. Revenue Shift Analysis
- 24.4. Market Movement Analysis
- 24.5. Penetration-Growth (P-G) Matrix
- 24.6. Blue Ammonia Market in Asia: Historical Trends (Since 2019) and Forecasted Estimates (Till 2035)
- 24.6.1. Blue Ammonia Market in China: Historical Trends (Since 2019) and Forecasted Estimates (Till 2035)
- 24.6.2. Blue Ammonia Market in India: Historical Trends (Since 2019) and Forecasted Estimates (Till 2035)
- 24.6.3. Blue Ammonia Market in Japan: Historical Trends (Since 2019) and Forecasted Estimates (Till 2035)
- 24.6.4. Blue Ammonia Market in Singapore: Historical Trends (Since 2019) and Forecasted Estimates (Till 2035)
- 24.6.5. Blue Ammonia Market in South Korea: Historical Trends (Since 2019) and Forecasted Estimates (Till 2035)
- 24.6.6. Blue Ammonia Market in Other Asian Countries: Historical Trends (Since 2019) and Forecasted Estimates (Till 2035)
- 24.7. Data Triangulation and Validation
25. MARKET OPPORTUNITIES FOR BLUE AMMONIA IN MIDDLE EAST AND NORTH AFRICA (MENA)
25..1. Chapter Overview
25..2. Key Assumptions and Methodology
25..3. Revenue Shift Analysis
25..4. Market Movement Analysis
25..5. Penetration-Growth (P-G) Matrix
25..6. Blue Ammonia Market in Middle East and North Africa (MENA): Historical Trends (Since 2019) and Forecasted Estimates (Till 2035)
25..6.1. Blue Ammonia Market in Egypt: Historical Trends (Since 2019) and Forecasted Estimates (Till 205)
25..6.2. Blue Ammonia Market in Iran: Historical Trends (Since 2019) and Forecasted Estimates (Till 2035)
25..6.3. Blue Ammonia Market in Iraq: Historical Trends (Since 2019) and Forecasted Estimates (Till 2035)
25..6.4. Blue Ammonia Market in Israel: Historical Trends (Since 2019) and Forecasted Estimates (Till 2035)
25..6.5. Blue Ammonia Market in Kuwait: Historical Trends (Since 2019) and Forecasted Estimates (Till 2035)
25..6.6. Blue Ammonia Market in Saudi Arabia: Historical Trends (Since 2019) and Forecasted Estimates (Till 2035)
25..6.7. Neuromorphic Computing Marke in United Arab Emirates (UAE): Historical Trends (Since 2019) and Forecasted Estimates (Till 2035)
25..6.8. Blue Ammonia Market in Other MENA Countries: Historical Trends (Since 2019) and Forecasted Estimates (Till 2035)
25..7. Data Triangulation and Validation
26. MARKET OPPORTUNITIES FOR BLUE AMMONIA IN LATIN AMERICA
- 26.1. Chapter Overview
- 26.2. Key Assumptions and Methodology
- 26.3. Revenue Shift Analysis
- 26.4. Market Movement Analysis
- 26.5. Penetration-Growth (P-G) Matrix
- 26.6. Blue Ammonia Market in Latin America: Historical Trends (Since 2019) and Forecasted Estimates (Till 2035)
- 26.6.1. Blue Ammonia Market in Argentina: Historical Trends (Since 2019) and Forecasted Estimates (Till 2035)
- 26.6.2. Blue Ammonia Market in Brazil: Historical Trends (Since 2019) and Forecasted Estimates (Till 2035)
- 26.6.3. Blue Ammonia Market in Chile: Historical Trends (Since 2019) and Forecasted Estimates (Till 2035)
- 26.6.4. Blue Ammonia Market in Colombia Historical Trends (Since 2019) and Forecasted Estimates (Till 2035)
- 26.6.5. Blue Ammonia Market in Venezuela: Historical Trends (Since 2019) and Forecasted Estimates (Till 2035)
- 26.6.6. Blue Ammonia Market in Other Latin American Countries: Historical Trends (Since 2019) and Forecasted Estimates (Till 2035)
- 26.7. Data Triangulation and Validation
27. MARKET OPPORTUNITIES FOR BLUE AMMONIA IN REST OF THE WORLD
- 27.1. Chapter Overview
- 27.2. Key Assumptions and Methodology
- 27.3. Revenue Shift Analysis
- 27.4. Market Movement Analysis
- 27.5. Penetration-Growth (P-G) Matrix
- 27.6. Blue Ammonia Market in Rest of the World: Historical Trends (Since 2019) and Forecasted Estimates (Till 2035)
- 27.6.1. Blue Ammonia Market in Australia: Historical Trends (Since 2019) and Forecasted Estimates (Till 2035)
- 27.6.2. Blue Ammonia Market in New Zealand: Historical Trends (Since 2019) and Forecasted Estimates (Till 2035)
- 27.6.3. Blue Ammonia Market in Other Countries
- 27.7. Data Triangulation and Validation
28. MARKET CONCENTRATION ANALYSIS: DISTRIBUTION BY LEADING PLAYERS
- 28.1. Leading Player 1
- 28.2. Leading Player 2
- 28.3. Leading Player 3
- 28.4. Leading Player 4
- 28.5. Leading Player 5
- 28.6. Leading Player 6
- 28.7. Leading Player 7
- 28.8. Leading Player 8
29. ADJACENT MARKET ANALYSIS
SECTION VII: STRATEGIC TOOLS
30. KEY WINNING STRATEGIES
31. PORTER'S FIVE FORCES ANALYSIS
32. SWOT ANALYSIS
33. VALUE CHAIN ANALYSIS
34. ROOTS STRATEGIC RECOMMENDATIONS
- 34.1. Chapter Overview
- 34.2. Key Business-related Strategies
- 34.2.1. Research & Development
- 34.2.2. Product Manufacturing
- 34.2.3. Commercialization / Go-to-Market
- 34.2.4. Sales and Marketing
- 34.3. Key Operations-related Strategies
- 34.3.1. Risk Management
- 34.3.2. Workforce
- 34.3.3. Finance
- 34.3.4. Others


