


 |
市場調查報告書
商品編碼
1851573
能源產業的預測性維護:市場佔有率分析、產業趨勢、統計數據和成長預測(2025-2030 年)Predictive Maintenance In The Energy - Market Share Analysis, Industry Trends & Statistics, Growth Forecasts (2025 - 2030) |
||||||
※ 本網頁內容可能與最新版本有所差異。詳細情況請與我們聯繫。
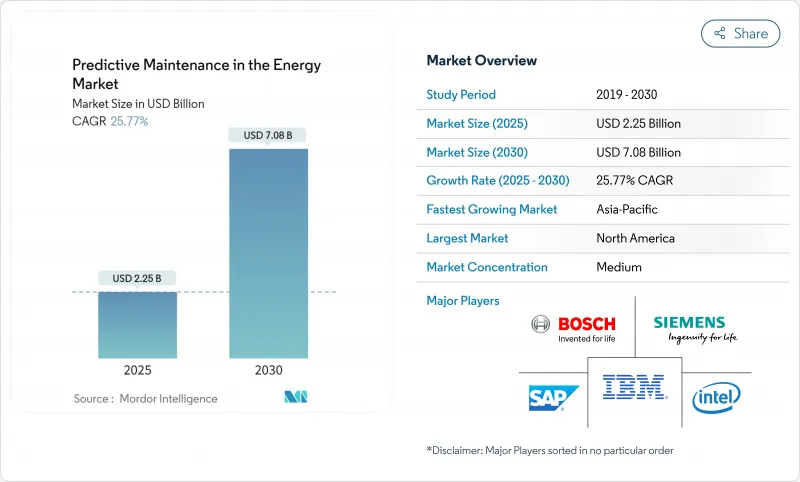
預計到 2025 年,能源產業的預測性維護市場規模將達到 22.5 億美元,到 2030 年將達到 70.8 億美元。
持續的電氣化、資料中心的激增以及對電網可靠性日益成長的擔憂,正迫使資產所有者用資料主導模型取代傳統的「運行至故障」模式,以降低全生命週期擁有成本並延長資產壽命。諸如美國環保署針對長壽命燃煤電廠90%碳捕獲率的規定以及歐盟的《企業永續性報告指令》等監管要求,推動了數位化預算的增加,因為營運商現在必須證明其運作和排放績效。同時,工業物聯網感測器價格的快速下降和人工智慧演算法的日益成熟,使得大型設備的投資回收期縮短至18-24個月,加速了其在汽輪機房、變電站和中游管道等領域的應用。將邊緣運算與雲端分析相結合的供應商已經報告稱,透過減少停機時間和最佳化零件庫存,實現了數億美元的成本節約。
全球能源預測性維護市場趨勢與洞察
整合工業物聯網、人工智慧和巨量資料分析
西門子的Senseye平台可自動產生數位化行為模型,在解決關鍵勞動力短缺問題的同時,將維護成本降低高達40%。雪佛龍的即時異常偵測接地故障保護技術可保障密集型耗能資料中心叢集的持續供電。邊緣節點在本地處理振動和溫度數據,然後傳輸到雲端,從而創建一個自主生態系統,該系統能夠挖掘整個車隊的運作模式,並在無需人工干預的情況下安排干預措施。這些市場發展趨勢使能源預測性維護市場成為資產密集型公用事業公司數位轉型藍圖的核心。
降低非計劃性停機時間的成本壓力
由於人工智慧工作負載的增加,停機罰款不斷攀升,需求激增,停機已成為董事會層面的風險,預測性維護也從可有可無轉變為營運必要。 NextEra Energy 的燃氣渦輪機專案實現了 23% 的停機時間減少和每年 2,500 萬美元的節約,充分證明了能源預測性維護市場的投資回報率。領先的油氣業者已證明,最佳化維護週期可將資產壽命延長 20% 至 40%,從而在數十年內提升設備循環利用的價值。而那些行動遲緩的企業則面臨著糟糕的客戶體驗和更高的能源成本,因為競爭對手能夠以更低的備件庫存維持更高的資產可用性。
初始部署和整合成本高昂
對於大型公用事業公司而言,全面的感測器維修、邊緣閘道器和雲端協作通常會使計劃預算高達數千萬美元,這對資金緊張的開發中國家營運商構成了一大障礙。 GE Vernova 在美國耗資約 6 億美元的工廠升級項目,展現了在車隊層級釋放預測價值所需的現代化規模。銅和稀土價格的上漲將使硬體支出從 2024 年起增加高達 25%。儘管如此,主要採用者已在兩年內收回了投資,而且隨著供應商推出與性能保證掛鉤的訂閱模式,財務壁壘正在降低,這再次印證了能源預測性維護市場的長期競爭力。
細分市場分析
到2024年,解決方案將佔據能源預測性維護市場65.3%的佔有率,這反映出營運商偏好選擇整合分析、視覺化和工作流程自動化的平台。雖然能夠每天處理TB級Terabyte和變壓器數據的軟體套件仍然至關重要,但具備設備端推理能力的嵌入式感測器將增強邊緣智慧,減少不必要的數據排放並加速洞察。公用事業公司和獨立發電企業依賴供應商提供整合、變更管理和全天候監控服務。
服務供應商正受益於資料科學和旋轉機械物理學領域日益成長的人才缺口。隨著營運商將傳統歷史資料庫遷移到雲端資料湖,且不中斷生產,整合和實施尤其重要。託管服務通常以基於結果的合約形式構建,可確保可用性指標,從而使供應商的獎勵與資產性能保持一致。隨著客戶將重點放在結果而非套件包上,能源預測性維護產業正穩步轉型為以服務為導向的市場,在這個市場中,卓越營運比功能清單更為重要。
預計到2024年,雲端運算在能源預測性維護市場的佔比將達到72.6%,隨著演算法複雜性和資料量的成長超過本地運算能力,雲端運算的地位將進一步鞏固。目前,單一離岸風力發電每天會產生數十Terabyte的SCADA和雷射雷達數據,因此雲原生架構更適合實現即時擴展和持續的模型重訓練。邊緣雲混合架構可以降低負載削減和葉片槳距調整的延遲,在保持關鍵任務迴路本地運行的同時,集中處理總體分析。
儘管在偏遠盆地和對網路主權和延遲要求極高的核能發電廠等地區,本地部署系統仍然不可或缺,但大多數供應商都在捆綁雲端連接器,以便未來遷移。Honeywell與Verizon合作部署的5G智慧電錶正是這項轉變的典型例證。安全的蜂窩回程傳輸將亞秒遙測數據傳輸到人工智慧引擎,該引擎能夠提前數天預測變壓器熱點。這類應用案例凸顯了能源預測性維護市場與更廣泛的電網數位化舉措密不可分的原因,而這些計畫都依賴於無所不在的低延遲連線。
能源產業預測性維護市場細分依據產品類型(解決方案和服務)、部署模式(雲端、本地部署)、最終用戶產業(發電、可再生能源、石油天然氣等)、資產類型(渦輪機和旋轉設備、變壓器和變電站等)以及地區分類。市場預測以美元計價。
區域分析
北美將繼續保持領先地位,預計到2024年將佔全球收入的27.9%,這主要得益於聯邦基礎設施項目、公共產業的大力投入以及人工智慧平台的早期應用。美國能源資訊署預測,到2030年,國內電力需求將成長15%至20%,部分原因是超大規模資料中心的興起,這將促使人們更加關注如何預防停電。雲端原生法規環境和充足的創業投資資金將進一步加速新技術試點,鞏固該地區在能源預測性維護市場的主導地位。
在綠色新政脫碳目標和嚴格的停電處罰機制的推動下,歐洲保持著穩定發展的勢頭,這些措施提高了可靠性指標。企業永續性報告要求公用事業公司揭露即時排放和能源效率關鍵績效指標。大型車隊營運商正在將數位孿生技術與基於衛星的植被監測相結合,以滿足合規性和韌性目標。
亞太地區是成長最快的區域,年複合成長率高達26.5%,主要得益於中國數位化電網規劃和東南亞快速電氣化進程的推動。中國南方電網的端到端數位轉型展示了跨越式技術如何繞過傳統瓶頸,並將預測性工作流程直接嵌入到新的基礎設施中。同時,印度和印尼正大力投資升級電網,從而催生了對發送類型分析的待開發區需求。儘管規模較小,但中東和非洲地區也對預測性維護表現出越來越濃厚的興趣,這得益於“2030願景”大型企劃以及類似舉措,這些項目要求即使在嚴酷的沙漠環境中也能運作完美運行,從而擴大了能源領域的預測性維護市場基礎。
其他福利:
- Excel格式的市場預測(ME)表
- 3個月的分析師支持
目錄
第1章 引言
- 研究假設和市場定義
- 調查範圍
第2章調查方法
第3章執行摘要
第4章 市場情勢
- 市場概覽
- 市場促進因素
- 能源基礎設施老化與對電網可靠性的重視(主流)
- 工業物聯網、人工智慧和巨量資料分析的融合(主流)
- 降低非計劃性停機時間的成本壓力(主流)
- 安全/排放氣體法規(主流)
- 結合無人機和衛星遙感探測(低調進行)
- 數位雙胞胎驅動的基於風險的維護(鮮為人知)
- 市場限制
- 高昂的領先成本和整合成本(主流)
- 網路安全漏洞日益增多(主流觀點)
- 能源領域資料科學人才短缺(鮮為人知)
- 多方資產中關於資料所有權和責任的爭議(鮮為人知)
- 供應鏈分析
- 監管環境
- 技術展望
- 波特五力模型
- 新進入者的威脅
- 買方的議價能力
- 供應商的議價能力
- 替代品的威脅
- 競爭對手之間的競爭
- 評估市場的宏觀經濟因素
第5章 市場規模及成長預測(價值,2024-2030 年)
- 報價
- 解決方案
- 軟體平台
- 嵌入式硬體和感測器
- 服務
- 整合與實施
- 託管服務
- 解決方案
- 按部署模式
- 雲
- 本地部署
- 按最終用戶行業分類
- 發電(火力發電、核能、水力)
- 可再生能源(風能、太陽能和儲能)
- 石油和天然氣(上游、中游、下游)
- 公共產業和輸配電
- 採礦和礦產
- 依資產類型
- 渦輪機和旋轉設備
- 變壓器和變電站
- 管道和壓縮機
- 泵浦和閥門
- 按地區
- 北美洲
- 美國
- 加拿大
- 墨西哥
- 南美洲
- 巴西
- 阿根廷
- 其他南美洲
- 歐洲
- 德國
- 英國
- 法國
- 荷蘭
- 其他歐洲地區
- 亞太地區
- 中國
- 日本
- 印度
- 韓國
- 澳洲和紐西蘭
- 亞太其他地區
- 中東和非洲
- 中東
- 阿拉伯聯合大公國
- 沙烏地阿拉伯
- 土耳其
- 其他中東地區
- 非洲
- 南非
- 奈及利亞
- 其他非洲地區
- 北美洲
第6章 競爭情勢
- 市場集中度
- 策略趨勢
- 市佔率分析
- 公司簡介
- IBM Corporation
- SAP SE
- Siemens AG
- GE Digital
- ABB Ltd
- Schneider Electric SE
- Intel Corporation
- Robert Bosch GmbH
- Accenture plc
- Honeywell International Inc.
- Hitachi Energy Ltd.
- Emerson Electric Co.
- Aspen Technology, Inc.
- AVEVA Group plc
- Uptake Technologies Inc.
- SparkCognition, Inc.
- Senseye Ltd.
- SKF Group
- Bentley Systems, Inc.
- Mitsubishi Electric Corporation
- Caterpillar Inc.(Asset Intelligence)
- DNV AS
- KONUX GmbH
第7章 市場機會與未來展望
The predictive maintenance in the energy market size reached USD 2.25 billion in 2025 and is on track to hit USD 7.08 billion by 2030, reflecting a compelling 25.77% CAGR over the forecast period.
Unrelenting electrification, surging data-center build-outs, and mounting grid-reliability concerns are pushing asset owners to replace run-to-failure routines with data-driven models that lower the lifetime cost of ownership while stretching remaining asset life. Regulatory mandates such as the EPA's 90% carbon-capture rule for long-term coal plants and the EU's Corporate Sustainability Reporting Directive are catalyzing digitalization budgets because operators must now prove both uptime and emissions performance. Simultaneously, rapid IIoT sensor price declines and maturing AI algorithms are shrinking payback cycles to 18-24 months for large fleets, amplifying adoption momentum across turbine halls, substations, and midstream pipelines. Vendors that fuse edge computing with cloud analytics already report nine-figure savings driven by shorter outage windows and optimized part inventories.
Global Predictive Maintenance In The Energy Market Trends and Insights
Integration of IIoT, AI and Big-Data Analytics
The fusion of low-cost sensors with AI pattern-recognition algorithms is recasting maintenance from reactive to prescriptive modes across turbine decks and compressor stations.Siemens' Senseye platform now generates digital behavior models automatically, slicing maintenance spend by up to 40% while addressing acute workforce shortages. Chevron's real-time anomaly detection for leak prevention safeguards continuous power delivery to energy-intensive data-center clusters. Edge nodes process torrents of vibration and temperature data locally before forwarding condensed insights to the cloud for fleet-wide pattern mining, creating near-autonomous ecosystems that schedule interventions without human prompts. These developments place predictive maintenance in the energy market squarely at the center of digital-transformation roadmaps for asset-heavy utilities.
Cost Pressure to Cut Unplanned Downtime
Escalating outage penalties and demand spikes from AI workloads are making downtime a board-level risk, moving predictive maintenance from a discretionary line item to an operational imperative. NextEra Energy's gas-turbine program delivered a 23% outage reduction and USD 25 million in annual savings, validating the hard ROI underpinning the predictive maintenance in the energy market. Large oil-and-gas operators have documented 20-40% asset-life extension through optimized service intervals, compounding value over decades-long equipment cycles. Firms that lag on adoption face customer-experience erosion and higher delivered-energy costs as competitors sustain higher asset availability with leaner spares inventories.
High Upfront Implementation and Integration Cost
Comprehensive sensor retrofits, edge gateways, and cloud orchestration commonly push project budgets into eight figures for large utilities, deterring cash-constrained operators in developing economies. GE Vernova's nearly USD 600 million U.S. factory upgrades illustrate the scale of modernization needed to unlock predictive value at fleet level. Rising copper and rare-earth prices have inflated hardware outlays by up to 25% since 2024. Nonetheless, leading adopters recuperate capital within two years, and financial barriers are softening as vendors roll out subscription models linked to performance guarantees, reiterating the long-term competitiveness of the predictive maintenance in the energy market.
Other drivers and restraints analyzed in the detailed report include:
- Aging Energy Infrastructure and Grid Reliability Focus
- Regulatory Mandates on Safety / Emissions
- Rising Cyber-Security Vulnerabilities
For complete list of drivers and restraints, kindly check the Table Of Contents.
Segment Analysis
Solutions controlled 65.3% of the predictive maintenance in the energy market in 2024, reflecting operators' preference for unified platforms that amalgamate analytics, visualization, and workflow automation. Software suites capable of ingesting terabytes of turbine and transformer data per day remain central, while embedded sensors equipped with on-device inference augment edge intelligence, reducing unnecessary data egress and accelerating insights. Services, although smaller in absolute revenue, sprint ahead at 25.9% CAGR as utilities and independent power producers rely on vendors for integration, change management, and 24X7 monitoring.
Service providers benefit from widening talent gaps in data science and rotating-machinery physics. Integration and implementation are especially valued when operators migrate legacy historian databases into cloud data lakes without production interruptions. Managed services, often structured as outcome-based contracts, guarantee availability metrics that align vendor incentives with asset performance. As clients prioritize outcomes over toolkits, the predictive maintenance in the energy industry is steadily morphing into a service-oriented market where operational excellence overrides feature checklists.
Cloud deployments represented 72.6% share of the predictive maintenance in the energy market in 2024, a position expected to strengthen as algorithm complexity and data volumes outstrip on-premise compute capacity. A single offshore wind farm now generates tens of terabytes of SCADA and lidar data daily; instant scalability and continuous model retraining favor cloud-native architectures. Edge-cloud hybrids mitigate latency for load-shedding or blade-pitch adjustments, keeping mission-critical loops local while bulk analytics run centrally.
On-premise systems persist in remote basins and nuclear sites with stringent sovereignty or latency requirements, yet most vendors bundle cloud connectors for future migration. Honeywell's 5G-enabled smart-meter roll-out with Verizon exemplifies the shift: secure cellular backhaul funnels sub-second telemetry into an AI engine that forecasts transformer hot-spots days in advance. Such use cases underscore why the predictive maintenance in the energy market is entwined with broader grid-digitalization initiatives premised on ubiquitous, low-latency connectivity.
Predictive Maintenance in the Energy Sector Market is Segmented by Offering (Solutions and Services), Deployment Model (Cloud, On-Premise), End-User Industry (Power Generation, Renewables, Oil and Gas, and More), Asset Type (Turbines and Rotating Equipment, Transformers and Sub-Stations, and More), and Geography. The Market Forecasts are Provided in Terms of Value (USD)
Geography Analysis
North America retained leadership with 27.9% of 2024 revenue, supported by federal infrastructure programs, aggressive utility spending, and early adoption of AI platforms. The Energy Information Administration projects domestic electricity demand to rise 15-20% by 2030, partly due to hyperscale data centers, intensifying the focus on outage prevention. Cloud-native regulatory environments and ample venture financing further accelerate new-tech pilots, anchoring regional dominance in the predictive maintenance in the energy market.
Europe maintains steady momentum driven by the Green Deal's decarbonization targets and strict outage-penalty regimes that elevate reliability metrics. The Corporate Sustainability Reporting Directive obliges utilities to disclose real-time emissions and energy-efficiency KPIs, for which predictive-maintenance datasets are highly synergistic. Large fleet operators are combining digital twins with satellite-based vegetation monitoring to meet both compliance and resilience goals.
Asia-Pacific is the fastest-growing territory at 26.5% CAGR, buoyed by China's state-backed digital-grid blueprint and Southeast Asia's rapid electrification. China Southern Power Grid's end-to-end digital transformation shows how leapfrog technology can embed predictive workflows directly into new infrastructure, bypassing legacy bottlenecks. Concurrently, India and Indonesia invest heavily in transmission upgrades, creating greenfield demand for cloud-delivered analytics. The Middle East and Africa, though smaller, show rising interest as mega-projects under Vision 2030 and similar initiatives demand flawless uptime under harsh desert conditions, expanding the predictive maintenance in the energy market footprint.
- IBM Corporation
- SAP SE
- Siemens AG
- GE Digital
- ABB Ltd
- Schneider Electric SE
- Intel Corporation
- Robert Bosch GmbH
- Accenture plc
- Honeywell International Inc.
- Hitachi Energy Ltd.
- Emerson Electric Co.
- Aspen Technology, Inc.
- AVEVA Group plc
- Uptake Technologies Inc.
- SparkCognition, Inc.
- Senseye Ltd.
- SKF Group
- Bentley Systems, Inc.
- Mitsubishi Electric Corporation
- Caterpillar Inc. (Asset Intelligence)
- DNV AS
- KONUX GmbH
Additional Benefits:
- The market estimate (ME) sheet in Excel format
- 3 months of analyst support
TABLE OF CONTENTS
1 INTRODUCTION
- 1.1 Study Assumptions and Market Definition
- 1.2 Scope of the Study
2 RESEARCH METHODOLOGY
3 EXECUTIVE SUMMARY
4 MARKET LANDSCAPE
- 4.1 Market Overview
- 4.2 Market Drivers
- 4.2.1 Aging energy infrastructure and grid reliability focus (mainstream)
- 4.2.2 Integration of IIoT, AI and big-data analytics (mainstream)
- 4.2.3 Cost pressure to cut unplanned downtime (mainstream)
- 4.2.4 Regulatory mandates on safety / emissions (mainstream)
- 4.2.5 Drone- and satellite-enabled remote sensing fusion (under-the-radar)
- 4.2.6 Digital-twin-driven risk-based maintenance (under-the-radar)
- 4.3 Market Restraints
- 4.3.1 High upfront implementation and integration cost (mainstream)
- 4.3.2 Rising cyber-security vulnerabilities (mainstream)
- 4.3.3 Scarcity of energy-domain data-science talent (under-the-radar)
- 4.3.4 Data-ownership and liability disputes in multi-party assets (under-the-radar)
- 4.4 Supply-Chain Analysis
- 4.5 Regulatory Landscape
- 4.6 Technological Outlook
- 4.7 Porter's Five Forces
- 4.7.1 Threat of New Entrants
- 4.7.2 Bargaining Power of Buyers
- 4.7.3 Bargaining Power of Suppliers
- 4.7.4 Threat of Substitute Products
- 4.7.5 Intensity of Competitive Rivalry
- 4.8 Assessment of Macroeconomic Factors on the Market
5 MARKET SIZE AND GROWTH FORECASTS (VALUE, 2024-2030)
- 5.1 By Offering
- 5.1.1 Solutions
- 5.1.1.1 Software Platforms
- 5.1.1.2 Embedded Hardware and Sensors
- 5.1.2 Services
- 5.1.2.1 Integration and Implementation
- 5.1.2.2 Managed Services
- 5.1.1 Solutions
- 5.2 By Deployment Model
- 5.2.1 Cloud
- 5.2.2 On-premise
- 5.3 By End-user Industry
- 5.3.1 Power Generation (Thermal, Nuclear, Hydro)
- 5.3.2 Renewables (Wind, Solar, Storage)
- 5.3.3 Oil and Gas (Upstream, Mid, Downstream)
- 5.3.4 Utilities and TandD
- 5.3.5 Mining and Minerals
- 5.4 By Asset Type
- 5.4.1 Turbines and Rotating Equipment
- 5.4.2 Transformers and Sub-stations
- 5.4.3 Pipelines and Compressors
- 5.4.4 Pumps and Valves
- 5.5 By Geography
- 5.5.1 North America
- 5.5.1.1 United States
- 5.5.1.2 Canada
- 5.5.1.3 Mexico
- 5.5.2 South America
- 5.5.2.1 Brazil
- 5.5.2.2 Argentina
- 5.5.2.3 Rest of South America
- 5.5.3 Europe
- 5.5.3.1 Germany
- 5.5.3.2 United Kingdom
- 5.5.3.3 France
- 5.5.3.4 Netherlands
- 5.5.3.5 Rest of Europe
- 5.5.4 Asia-Pacific
- 5.5.4.1 China
- 5.5.4.2 Japan
- 5.5.4.3 India
- 5.5.4.4 South Korea
- 5.5.4.5 Australia and New Zealand
- 5.5.4.6 Rest of Asia-Pacific
- 5.5.5 Middle East and Africa
- 5.5.5.1 Middle East
- 5.5.5.1.1 United Arab Emirates
- 5.5.5.1.2 Saudi Arabia
- 5.5.5.1.3 Turkey
- 5.5.5.1.4 Rest of Middle East
- 5.5.5.2 Africa
- 5.5.5.2.1 South Africa
- 5.5.5.2.2 Nigeria
- 5.5.5.2.3 Rest of Africa
- 5.5.1 North America
6 COMPETITIVE LANDSCAPE
- 6.1 Market Concentration
- 6.2 Strategic Moves
- 6.3 Market Share Analysis
- 6.4 Company Profiles (includes Global level Overview, Market level overview, Core Segments, Financials as available, Strategic Information, Market Rank/Share for key companies, Products and Services, and Recent Developments)
- 6.4.1 IBM Corporation
- 6.4.2 SAP SE
- 6.4.3 Siemens AG
- 6.4.4 GE Digital
- 6.4.5 ABB Ltd
- 6.4.6 Schneider Electric SE
- 6.4.7 Intel Corporation
- 6.4.8 Robert Bosch GmbH
- 6.4.9 Accenture plc
- 6.4.10 Honeywell International Inc.
- 6.4.11 Hitachi Energy Ltd.
- 6.4.12 Emerson Electric Co.
- 6.4.13 Aspen Technology, Inc.
- 6.4.14 AVEVA Group plc
- 6.4.15 Uptake Technologies Inc.
- 6.4.16 SparkCognition, Inc.
- 6.4.17 Senseye Ltd.
- 6.4.18 SKF Group
- 6.4.19 Bentley Systems, Inc.
- 6.4.20 Mitsubishi Electric Corporation
- 6.4.21 Caterpillar Inc. (Asset Intelligence)
- 6.4.22 DNV AS
- 6.4.23 KONUX GmbH
7 MARKET OPPORTUNITIES AND FUTURE OUTLOOK
- 7.1 White-space and Unmet-need Assessment
 人工智慧預測性維護市場預測至2034年—按組件、部署模式、組織規模、應用、最終用戶和地區分類的全球分析
 2026-2030年全球離岸風力渦輪機維護機器人市場
 製造業預測性維護市場:按組件、技術、資料類型、方法論、應用和最終用戶產業分類-2026-2032年全球市場預測
 2026年全球預測性維護市場報告2026年全球營運預測性維護市場報告製造業維護機器人市場:依產品、經營模式、部署方式、應用和產業分類-全球預測,2026-2032年
 預測性維護市場報告:按組件、方法、部署模型、組織規模、產業和地區分類(2026-2034 年)
 預測性維護市場分析及至2035年預測:依類型、產品類型、服務、技術、組件、應用、部署類型、最終用戶、功能及設備分類
 全球預測性維護市場規模、佔有率、趨勢和成長分析報告(2026-2034年)全球半導體製造設備預測性維護市場:預測(至2034年)-按組件、類型、設備類型、部署方式、最終用戶和地區分類的分析