


 |
市場調查報告書
商品編碼
1851558
石油和天然氣資本支出:市場佔有率分析、行業趨勢、統計數據和成長預測(2025-2030 年)Oil And Gas CAPEX - Market Share Analysis, Industry Trends & Statistics, Growth Forecasts (2025 - 2030) |
||||||
※ 本網頁內容可能與最新版本有所差異。詳細情況請與我們聯繫。
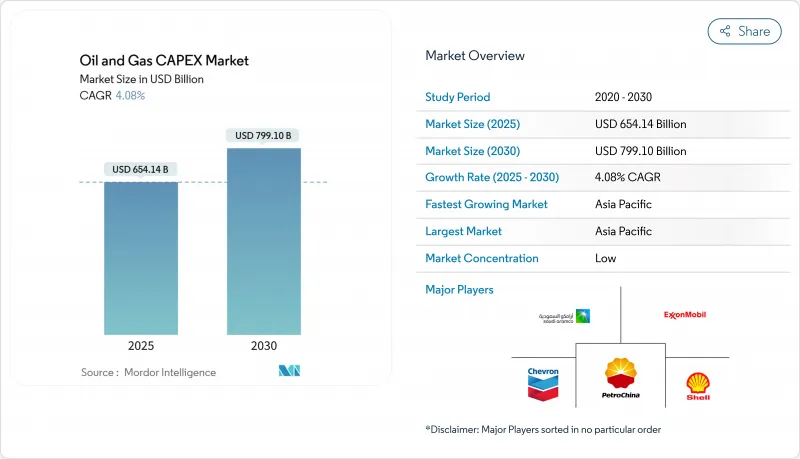
預計到 2025 年,石油和天然氣資本支出市場規模將達到 6,541.4 億美元,預計到 2030 年將達到 7,991.1 億美元,在預測期(2025-2030 年)內複合年成長率為 4.08%。
營運商正在調整投資組合,以應對長達數十年的能源轉型,同時將資金投入到能夠確保在價格週期中實現穩定現金流的高回報計劃中。深水計畫、液化天然氣計畫和棕地脫碳計畫佔據了大部分支出,因為它們兼具經濟競爭力和戰略意義。嚴格追求全週期損益平衡正在推動最終投資決策(FID)的快速訂定,並促使企業從前沿探勘轉向開發鑽井。大型綜合石油公司和國家石油公司(NOC)之間的整合釋放了規模效益,而數位化技術則減少了計劃超支並降低了營運成本。隨著與環境、社會和治理(ESG)相關的契約收緊了債務融資管道並提高了專案核准門檻,策略融資仍然是關注的焦點。
全球油氣資本支出市場趨勢及洞察
增加液化天然氣相容型天然氣基礎設施的建設
長期承購協議和結構性天然氣供需平衡是推動液化天然氣大型企劃發展的催化劑,例如伍德賽德公司投資175億美元的路易斯安那州液化天然氣項目和科珀斯克里斯蒂三期擴建項目。市場先驅正將投資範圍從液化擴展到加工、管道和儲存,從而在整個油氣資本支出市場產生倍增效應。在天然氣滯留地區搶佔先機的企業,例如與沙烏地阿美公司簽訂的里奧格蘭德液化天然氣承購協議,預計將在未來幾十年鎖定自由現金流。
深水探勘發現的增加推動了最終投資決定
海底設備成本的套件和標準化計劃模式的推行,已將深水油氣盈虧平衡點推低至每桶50美元以下,迫使BP價值50億美元的Kaskida項目和道達爾能源價值60億美元的Caminho項目等計劃進入核准階段。因此,油氣資本支出市場對專業鑽機、海底鑽井平台(SURF)和浮式生產儲卸油裝置(FPSO)承包商的訂單強勁,預計到2025年,海上EPC(工程、採購、施工)市場規模將達到540億美元。
布蘭特原油價格波動對長期計劃帶來不利影響。
2024年布蘭特原油價格區間預計在每桶68-93美元之間,但這掩蓋了日內價格的劇烈波動,也使得投資回收期為7-10年的計劃的淨現值計算變得複雜。貸款機構的應對措施包括提高最低利率和收緊壓力測試,這實際上篩選掉了邊際油氣資本支出市場的機會。花旗銀行預測,到2025年油價可能會跌至每桶60美元左右,進一步抑制了長期投資的意願。
細分市場分析
2024年,上游產業將佔油氣資本支出市場佔有率的72.92%,預計到2030年將以4.20%的複合年成長率成長,這主要得益於營運商加快對高回報深水和傳統型計劃的最終投資決策。該行業的成長勢頭反映了其戰略重心向短期開發項目的轉變,這些項目能夠快速適應大宗商品價格波動,同時保持具有競爭力的回報。重要的上游投資項目包括BP投資50億美元的卡斯基達計劃和雪佛龍的騰吉茲未來成長計劃,後者已於2025年1月投產,將新增26萬桶/日的產能。中游業務的重點是解決關鍵基礎設施瓶頸問題,以促進上游產量的成長,特別是液化天然氣加工和管道輸送能力的擴張。由於企業優先考慮維護性資本支出而非產能擴張,下游投資仍受到利潤率壓力和長期需求預測不確定性的限制。
數位轉型正透過人工智慧驅動的鑽井最佳化和預測維修系統重塑上游計劃執行模式,從而降低營運成本並提高採收率。 SLB公司簽署的大型人工智慧驅動深水鑽井合約表明,採用技術來提升複雜儲存開發領域的競爭力已變得日益迫切。上游資本支出分配越來越側重於生產最佳化而非探勘,這反映了過去週期中以探勘為導向的策略收益不足的經驗教訓。各公司正利用先進的地震成像和油藏建模技術來最大限度地提高現有油田的產量,而不是開展投機性的探勘項目。這種以生產為中心的策略符合投資者對資本紀律和短期現金流的需求,同時也能維持長期蘊藏量替代率。
區域分析
亞太地區是全球最大的油氣市場(2024年市場佔有率達29%),也是成長最快的區域油氣資本支出市場,預計到2030年複合年成長率將達到4.86%。這反映了能源安全的需求,以及各國國家石油公司(NOC)旨在降低進口依賴、抓住國內市場成長機會的大規模投資計畫。 PTTEP公司2025年53億美元的資本支出計畫表明,該地區的營運商正優先考慮上游天然氣開發和液化天然氣(LNG)供應鏈投資,以滿足國內消費和出口需求。經濟發展和資料中心擴張帶來的電力需求成長推動了該地區的成長勢頭,雪佛龍等公司在印度設立大型工程中心,以利用成本優勢和當地市場機會。中國和印度的國家石油公司正在加速國內探勘和開發計劃,同時尋求國際收購以確保長期資源取得。然而,隨著國際銀行實施與環境、社會和治理(ESG)相關的貸款監管規定,該地區的營運商面臨日益嚴峻的資金籌措挑戰。亞太地區的石油和燃氣公司96%的收入來自石化燃料業務,而全球同行則更加多元化。
北美和歐洲市場的發展趨勢截然不同。北美受益於頁岩生產最佳化和液化天然氣出口基礎設施的建設,而歐洲則日益關注維護性資本支出和脫碳計劃。北美營運商,例如德文能源(Devon Energy)和EOG資源公司,展現了卓越的資本紀律。根據investing.com報道,德文能源在2025年第一季創造了10億美元的自由現金流,同時下調了1億美元的資本支出預期。儘管各公司仍在繼續投資現有業務和碳捕獲技術,但歐洲的投資卻受到監管壓力和可再生能源政策的限制,這些政策限制了新的石化燃料開發。北美頁岩氣產業可以根據大宗商品價格靈活調整產量,而歐洲營運商則在更嚴格的政策框架下運作。南美市場繼續專注於深水開發和能夠滿足國內能源安全需求和出口市場機會的計劃,但政治穩定性和監管一致性仍然影響著國際營運商的參與程度。
中東和非洲市場的發展動力源自於其豐富的低成本蘊藏量以及鼓勵國內外發展的政府扶持政策。該地區受益於通常低於每桶20美元的生產成本和完善的基礎設施,與新興地區相比,開發週期更短,資本支出需求也更低。包括沙烏地阿美在內的區域石油公司正在實施大規模的上游擴張計劃,同時投資下游一體化和石化設施,以在整個油氣價值鏈中獲得更高的附加價值利潤。埃克森美孚計畫在奈及利亞投資15億美元用於深水油氣開發,顯示儘管面臨全球能源轉型帶來的壓力,國際業者仍將該地區列為優先發展區域。該地區資本支出的成長得益於與亞洲買家簽訂的長期供應協議,以及為應對能源轉型期間預期的全球供應趨緊而採取的戰略佈局。然而,隨著可再生能源的加速普及,營運商必須應對不斷變化的環境、社會和治理(ESG)預期以及傳統出口市場潛在需求下降的問題。
其他好處
- Excel格式的市場預測(ME)表
- 3個月的分析師支持
目錄
第1章 引言
- 研究假設和市場定義
- 調查範圍
第2章調查方法
第3章執行摘要
第4章 市場情勢
- 市場概覽
- 市場促進因素
- 液化天然氣相容天然氣基礎設施發展進展
- 深水探勘發現的增加推動了最終投資決策
- 中東和亞洲國家石油公司上游投資的復甦
- 棕地脫碳計畫「維護資本支出」激增
- 數位雙胞胎部署可減少計劃超支
- 1兆瓦以下模組化浮式液化天然氣裝置吸引小型氣田建設許可
- 市場限制
- 布蘭特原油價格波動劇烈,不利於長期計劃開展。
- 經合組織政策轉向再生能源
- 一級EPC(工程、採購和施工)勞動力短缺導致成本上升
- 與環境、社會及治理(ESG)相關的債務條款限制石化燃料資本支出
- 供應鏈分析
- 監管環境
- 技術展望
- 原油生產與消費展望
- 天然氣生產與消費展望
- 管道設置容量分析
- 非傳統資源支出展望(緻密油、油砂、深水)
- 波特五力模型
- 供應商的議價能力
- 買方的議價能力
- 新進入者的威脅
- 替代品的威脅
- 競爭的激烈程度
第5章 市場規模與成長預測
- 按行業
- 上游
- 中產階級
- 下游
- 按地區
- 陸上
- 離岸
- 依資產類型
- 遠徵
- 開發與生產
- 維護和檢修
- 退休
- 按地區
- 北美洲
- 美國
- 加拿大
- 墨西哥
- 歐洲
- 挪威
- 英國
- 俄羅斯
- 荷蘭
- 德國
- 其他歐洲地區
- 亞太地區
- 中國
- 印度
- 日本
- 韓國
- 東南亞國協
- 澳洲
- 亞太其他地區
- 南美洲
- 巴西
- 阿根廷
- 哥倫比亞
- 其他南美洲
- 中東和非洲
- 沙烏地阿拉伯
- 阿拉伯聯合大公國
- 卡達
- 奈及利亞
- 南非
- 其他中東和非洲地區
- 北美洲
第6章 競爭情勢
- 市場集中度
- 策略性舉措(併購、夥伴關係、購電協議)
- 市場佔有率分析(主要企業的市場排名/佔有率)
- 公司簡介
- Saudi Aramco
- Exxon Mobil Corporation
- Shell plc
- BP plc
- TotalEnergies SE
- Chevron Corporation
- PetroChina(CNPC)
- CNOOC Ltd
- Equinor ASA
- Petrobras
- ConocoPhillips
- ENI SpA
- Suncor Energy
- Occidental Petroleum
- Woodside Energy
- Lukoil PJSC
- ONGC
- Cairn Oil & Gas(Vedanta)
- QatarEnergy
- SLB(Schlumberger)
- Halliburton
第7章 市場機會與未來展望
The Oil And Gas CAPEX Market size is estimated at USD 654.14 billion in 2025, and is expected to reach USD 799.11 billion by 2030, at a CAGR of 4.08% during the forecast period (2025-2030).
Operators funnel capital toward high-return projects that protect cash flows during volatile price cycles while positioning portfolios for a multi-decade energy transition. Deepwater, LNG, and brownfield decarbonization programs dominate the spending slate because they combine competitive economics with strategic relevance. Tight discipline on full-cycle break-evens prompts faster final investment decisions (FIDs) and a visible shift from frontier exploration to development drilling. Consolidation among integrated majors and national oil companies (NOCs) unlocks scale efficiencies, while digital technologies trim project overruns and lower operating costs. Strategic finance remains a watchpoint as ESG-linked covenants tighten access to debt and raise the hurdle rate for green-light decisions.
Global Oil And Gas CAPEX Market Trends and Insights
Increasing LNG-Ready Gas Infrastructure Build-Out
Long-term offtake contracts and structurally tight gas balances have catalyzed LNG megaprojects such as Woodside's USD 17.5 billion Louisiana facility and the Corpus Christi Stage 3 expansion. Developers are extending spend beyond liquefaction into processing, pipelines, and storage, creating multiplier effects throughout the oil and gas capex market. First-mover positions in regions with stranded gas-illustrated by NextDecade's Rio Grande LNG offtake with Saudi Aramco-are projected to lock in decades of free cash flow.
Rising Deep-Water Discoveries Driving FIDs
Cost deflation in subsea kit and standardized project models has dropped deepwater breakevens below USD 50 per barrel, pushing projects like BP's USD 5 billion Kaskida and TotalEnergies' USD 6 billion Kaminho to sanction. Therefore, the oil and gas capex market sees robust order books for specialized rigs, SURF and FPSO contractors, with 2025 offshore EPC opportunities estimated at USD 54 billion.
Volatility in Dated Brent Discouraging Long-Cycle Projects
Brent's USD 68-93 range in 2024 masked sharp intraday swings that complicate NPV calculations for projects with 7-10 year paybacks. Lenders have responded by raising hurdle rates and tightening stress-test scenarios, effectively screening out marginal oil and gas capex market opportunities. Citi's forecast of prices potentially dropping into the USD 60s by 2025 further discourages long-cycle commitments.
Other drivers and restraints analyzed in the detailed report include:
- NOC Upstream Spending Rebound in Middle East & Asia
- Surge in "Maintenance CAPEX" to Decarbonize Brownfields
- Policy Pivots Toward Renewables in OECD
For complete list of drivers and restraints, kindly check the Table Of Contents.
Segment Analysis
Upstream activities command 72.92% of the oil and gas capex market share in 2024, benefiting from a 4.20% CAGR forecast through 2030 as operators accelerate final investment decisions on high-return deepwater and unconventional projects. The sector's growth momentum reflects strategic repositioning toward short-cycle developments that adapt quickly to commodity price fluctuations while maintaining competitive returns. Major upstream investments include BP's USD 5 billion Kaskida project and Chevron's Future Growth Project at Tengiz, which commenced production in January 2025 with the capacity to increase output by 260,000 barrels per day. Midstream operations focus on critical infrastructure bottlenecks, particularly LNG processing and pipeline capacity expansions that enable upstream production growth. With companies prioritizing maintenance CAPEX over capacity additions, downstream investments remain constrained by margin pressures and uncertain long-term demand projections.
Digital transformation reshapes upstream project execution through AI-enabled drilling optimization and predictive maintenance systems that reduce operational costs and improve recovery rates. SLB's major AI-enabled deepwater drilling contract demonstrates how technology adoption is becoming essential for competitive positioning in complex reservoir developments. The upstream sector's CAPEX allocation increasingly emphasizes production optimization over exploration, reflecting lessons learned from previous cycles where discovery-focused strategies generated insufficient returns. Companies leverage advanced seismic imaging and reservoir modeling to maximize output from existing fields rather than pursuing speculative exploration programs. This production-centric approach aligns with investor demands for capital discipline and near-term cash flow generation while maintaining long-term reserve replacement ratios.
The Oil and Gas CAPEX Market Report is Segmented by Sector (Upstream, Midstream, and Downstream), Location (Onshore and Offshore), Asset Type (Exploration, Development and Production, Maintenance and Turn-Around, and Decommissioning), and Geography (North America, Europe, Asia-Pacific, South America, and Middle East and Africa). The Market Sizes and Forecasts are Provided in Terms of Value (USD).
Geography Analysis
Asia-Pacific emerges as the largest (29% of the market share in 2024) and the fastest-growing regional oil and gas capex market with 4.86% CAGR through 2030, reflecting energy security imperatives and substantial NOC investment programs designed to reduce import dependence and capture domestic market growth. PTTEP's USD 5.3 billion CAPEX plan for 2025 demonstrates how regional operators prioritize upstream gas development and LNG supply chain investments to serve domestic consumption and export opportunities. The region's growth momentum is supported by rising electricity demand driven by economic development and data center expansion, with companies like Chevron establishing major engineering centers in India to capture cost advantages and local market opportunities. Chinese and Indian NOCs are accelerating domestic exploration and development programs while pursuing international acquisitions that secure long-term resource access. However, regional operators face increasing financing challenges as international banks implement ESG-linked lending restrictions. APAC oil and gas firms generate 96% of revenues from fossil fuel activities compared to more diversified global peers.
North American and European markets are experiencing divergent trends, with North America benefiting from shale production optimization and LNG export infrastructure development while Europe focuses increasingly on maintenance CAPEX and decarbonization projects. North American operators like Devon Energy and EOG Resources demonstrate exceptional capital discipline. Devon generated USD 1 billion in free cash flow during Q1 2025 while reducing CAPEX guidance by USD 100 million, investing.com. Though companies continue to invest in existing operations and carbon capture technologies, European investments are constrained by regulatory pressures and renewable energy policies that discourage new fossil fuel development. The regional divergence reflects different regulatory environments and resource endowments, with North American shale providing flexibility to adjust production levels based on commodity prices while European operators navigate more restrictive policy frameworks. South American markets remain focused on deepwater developments and infrastructure projects that can serve domestic energy security needs and export market opportunities, though political stability and regulatory consistency continue to influence international operator participation levels.
Middle East and Africa market is driven by abundant low-cost reserves and supportive government policies that encourage domestic and international development. The region benefits from production costs often below USD 20 per barrel and established infrastructure networks that reduce development timelines and CAPEX requirements compared to frontier regions. Saudi Aramco and other regional NOCs are implementing substantial upstream expansion programs while investing in downstream integration and petrochemical facilities that capture higher value-added margins throughout the hydrocarbon value chain. ExxonMobil's planned USD 1.5 billion deepwater investment in Nigeria exemplifies how international operators prioritize the region despite global energy transition pressures. The region's CAPEX growth is supported by long-term supply contracts with Asian buyers and strategic positioning for anticipated global supply tightness during the energy transition period. However, operators must navigate evolving ESG expectations and potential demand destruction in traditional export markets as renewable energy adoption accelerates.
- Saudi Aramco
- Exxon Mobil Corporation
- Shell plc
- BP plc
- TotalEnergies SE
- Chevron Corporation
- PetroChina (CNPC)
- CNOOC Ltd
- Equinor ASA
- Petrobras
- ConocoPhillips
- ENI SpA
- Suncor Energy
- Occidental Petroleum
- Woodside Energy
- Lukoil PJSC
- ONGC
- Cairn Oil & Gas (Vedanta)
- QatarEnergy
- SLB (Schlumberger)
- Halliburton
Additional Benefits:
- The market estimate (ME) sheet in Excel format
- 3 months of analyst support
TABLE OF CONTENTS
1 Introduction
- 1.1 Study Assumptions & Market Definition
- 1.2 Scope of the Study
2 Research Methodology
3 Executive Summary
4 Market Landscape
- 4.1 Market Overview
- 4.2 Market Drivers
- 4.2.1 Increasing LNG-ready gas infrastructure build-out
- 4.2.2 Rising deep-water discoveries driving FIDs
- 4.2.3 NOC upstream spending rebound in Middle East & Asia
- 4.2.4 Surge in "maintenance CAPEX" to decarbonise brownfields
- 4.2.5 Digital twin roll-outs cutting project overruns
- 4.2.6 Sub-1 MW modular FLNG attracting small-field sanctioning
- 4.3 Market Restraints
- 4.3.1 Volatility in Dated Brent discouraging long-cycle projects
- 4.3.2 Policy pivots toward renewables in OECD
- 4.3.3 Scarcity-pricing of Tier-1 EPC labour elevating costs
- 4.3.4 ESG-linked debt covenants capping fossil CAPEX ceilings
- 4.4 Supply-Chain Analysis
- 4.5 Regulatory Landscape
- 4.6 Technological Outlook
- 4.7 Crude-Oil Production and Consumption Outlook
- 4.8 Natural-Gas Production and Consumption Outlook
- 4.9 Installed Pipeline Capacity Analysis
- 4.10 Unconventional Resources CAPEX Outlook (tight oil, oil sands, deep-water)
- 4.11 Porter's Five Forces
- 4.11.1 Bargaining Power of Suppliers
- 4.11.2 Bargaining Power of Buyers
- 4.11.3 Threat of New Entrants
- 4.11.4 Threat of Substitutes
- 4.11.5 Intensity of Rivalry
5 Market Size & Growth Forecasts
- 5.1 By Sector
- 5.1.1 Upstream
- 5.1.2 Midstream
- 5.1.3 Downstream
- 5.2 By Location
- 5.2.1 Onshore
- 5.2.2 Offshore
- 5.3 By Asset Type
- 5.3.1 Exploration
- 5.3.2 Development and Production
- 5.3.3 Maintenance and Turn-around
- 5.3.4 Decommissioning
- 5.4 By Geography
- 5.4.1 North America
- 5.4.1.1 United States
- 5.4.1.2 Canada
- 5.4.1.3 Mexico
- 5.4.2 Europe
- 5.4.2.1 Norway
- 5.4.2.2 United Kingdom
- 5.4.2.3 Russia
- 5.4.2.4 Netherlands
- 5.4.2.5 Germany
- 5.4.2.6 Rest of Europe
- 5.4.3 Asia Pacific
- 5.4.3.1 China
- 5.4.3.2 India
- 5.4.3.3 Japan
- 5.4.3.4 South Korea
- 5.4.3.5 ASEAN Countries
- 5.4.3.6 Australia
- 5.4.3.7 Rest of Asia Pacific
- 5.4.4 South America
- 5.4.4.1 Brazil
- 5.4.4.2 Argentina
- 5.4.4.3 Colombia
- 5.4.4.4 Rest of South America
- 5.4.5 Middle East and Africa
- 5.4.5.1 Saudi Arabia
- 5.4.5.2 United Arab Emirates
- 5.4.5.3 Qatar
- 5.4.5.4 Nigeria
- 5.4.5.5 South Africa
- 5.4.5.6 Rest of Middle East and Africa
- 5.4.1 North America
6 Competitive Landscape
- 6.1 Market Concentration
- 6.2 Strategic Moves (M&A, Partnerships, PPAs)
- 6.3 Market Share Analysis (Market Rank/Share for key companies)
- 6.4 Company Profiles (includes Global level Overview, Market level overview, Core Segments, Financials as available, Strategic Information, Products & Services, and Recent Developments)
- 6.4.1 Saudi Aramco
- 6.4.2 Exxon Mobil Corporation
- 6.4.3 Shell plc
- 6.4.4 BP plc
- 6.4.5 TotalEnergies SE
- 6.4.6 Chevron Corporation
- 6.4.7 PetroChina (CNPC)
- 6.4.8 CNOOC Ltd
- 6.4.9 Equinor ASA
- 6.4.10 Petrobras
- 6.4.11 ConocoPhillips
- 6.4.12 ENI SpA
- 6.4.13 Suncor Energy
- 6.4.14 Occidental Petroleum
- 6.4.15 Woodside Energy
- 6.4.16 Lukoil PJSC
- 6.4.17 ONGC
- 6.4.18 Cairn Oil & Gas (Vedanta)
- 6.4.19 QatarEnergy
- 6.4.20 SLB (Schlumberger)
- 6.4.21 Halliburton
7 Market Opportunities & Future Outlook
- 7.1 White-space & Unmet-Need Assessment
 工業固定設備市場預測至2032年:按設備類型、材料類型、最終用戶和地區分類的全球分析
 中游石油和天然氣設備市場(按設備類型、材料類型、應用、最終用途和分銷管道)—2025-2032 年全球預測
 2025年全球石油和天然氣中游設備市場報告石油和天然氣工程服務市場按服務類型、計劃類型、合約類型、所用技術、應用和最終用戶分類——2025-2030 年全球預測
 全球減壓氣油市場全球石油和天然氣漁業市場全球上游油氣市場2025年全球真空柴油市場報告2025年全球石油和天然氣基礎設施市場報告2025年全球石油和天然氣測量儀器市場報告