


 |
市場調查報告書
商品編碼
1851454
燃氣渦輪機:市場佔有率分析、行業趨勢、統計數據和成長預測(2025-2030 年)Gas Turbine - Market Share Analysis, Industry Trends & Statistics, Growth Forecasts (2025 - 2030) |
||||||
※ 本網頁內容可能與最新版本有所差異。詳細情況請與我們聯繫。
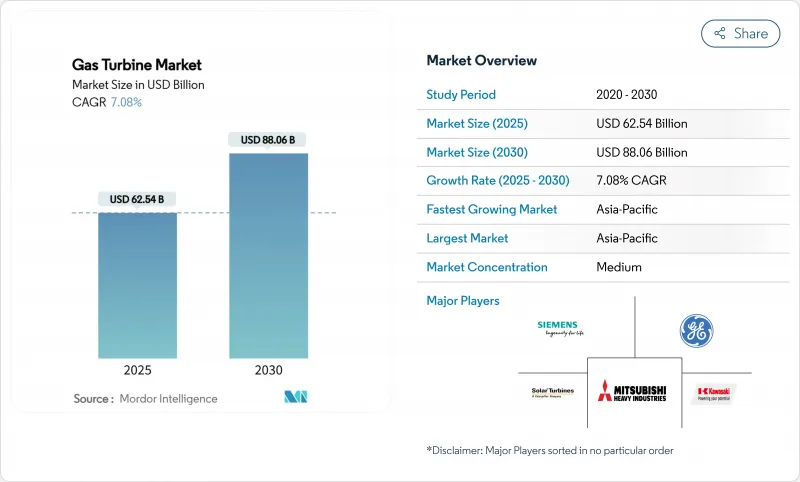
據估計,燃氣渦輪機市場規模將在 2025 年達到 625.4 億美元,到 2030 年達到 880.6 億美元,在預測期(2025-2030 年)內複合年成長率為 7.08%。
這一發展勢頭源於對能源安全的擔憂、日益嚴格的碳減排政策,以及隨著可再生能源滲透率的提高,對靈活資產以穩定電網的需求。隨著人工智慧工作負載推動資料中心電力需求激增,像杜克能源這樣的公用事業公司正被迫採購更多能夠快速啟動並有效運作的渦輪機。製造商正優先考慮氫能驅動設計、提高複合迴圈效率以及採用模組化建造技術,以縮短安裝時間並降低成本。超合金熱氣通道零件的供應鏈限制以及與環境、社會和治理(ESG)分類相關的資金籌措障礙正在抑制整體前景,但新訂單的積壓量並未放緩。
全球燃氣渦輪機市場趨勢與洞察
亞太地區煤改氣轉變電力公司燃料訂單
隨著燃煤發電廠面臨日益嚴格的排放法規,中國、印度和越南的電力公司正轉向預先設計用於氫氣混燒的高效能燃氣渦輪機。中國部署大容量氫能機組表明了該國將無污染燃料與分散式能源結合的決心。越南已部署了一套9HA.02系統,以確保低碳基本負載。新加坡計劃在2030年前建成並運作一台可燃氫能的機組,凸顯了燃氣渦輪機市場在可再生能源和脫碳目標之間發揮的橋樑作用。到2030年,該地區的採購項目將新增超過42吉瓦的潛在裝置容量。
東南亞透過液化天然氣連接的島嶼輸電網路推動了對移動航空衍生產品的需求。
島嶼經濟體依賴季節性旅遊業,必須利用小型電網來管理波動性較大的再生能源。可攜式TM2500系統可在數分鐘內提供34兆瓦電力,無需用水即可運行,並能靈活提供尖峰和緊急電力。電力生產商可利用浮體式天然氣(LNG)儲槽作為燃料,以實現快速安裝和搬遷。增強型乾式低氮衍生燃燒可減少排放氣體,而多燃料能力則有助於應對供應中斷。因此,航空燃料供應商在東南亞和加勒比海部分地區看到了一個獨特的市場機會。
烏克蘭戰爭後天然氣價格波動抑制歐盟計劃
俄羅斯輸往歐洲的管道天然氣流量下降了80%,導致現貨天然氣價格飆升至前所未有的高位,阻礙了簡單迴圈機組計劃的資金籌措。開發商目前優先考慮簽訂長期液化天然氣合約的複合迴圈發電廠,而一些調峰電廠計劃則轉向電池儲能。德國正在加快建造再氣化終端以確保供應,但貸款機構在價格穩定之前仍保持謹慎,歐盟多個國家的燃氣渦輪機市場也放緩。
細分市場分析
2024年,功率超過120兆瓦的大型燃氣渦輪機將佔總銷量的58%,這印證了電力公司在基本負載和複合迴圈中對高功率、高效率設備的偏好。重型結構具有優異的熱穩定性,並且能夠承受黏稠的燃料混合物,這對於氫能的未來至關重要。鑑於煤電資產的持續退役,預計此類燃氣渦輪機的市場規模將以行業平均速度穩定成長。
功率介於 31 兆瓦至 120 兆瓦之間的中階機組成長最快,複合年成長率達 7.44%。其兼具高效性和循環能力,使其成為再生能源應用的理想選擇。其更高的調節比和快速冷啟動性能,特別適用於太陽能和風能發電波動較大的市場。隨著資料中心部署專用的中階燃氣渦輪機組來應對波動的計算負載並確保本地可靠性,燃氣渦輪機市場也從中受益。
2024年,複合迴圈配置的燃氣渦輪機出貨量佔比高達75%,這主要得益於其超過64%的淨效率,從而降低了燃料成本和每兆瓦時的二氧化碳排放量。模組化餘熱回收蒸汽產生器等整合技術的進步縮短了建設週期,進一步擴大了其市場吸引力。新的國家排放法規將禁止不具備碳捕集功能的簡單迴圈計劃,這將提升複合迴圈燃氣渦輪機的市場佔有率。
簡單/開式循環機組在調峰和緊急供電方面仍將發揮重要作用,尤其是在需要快速爬坡設備的電網中。汽電共生電廠在重視蒸氣輸出的工業用戶中也蓬勃發展。隨著整體製程能源利用率達到 80%,汽電共生正在支持中東和東南亞石化產業的擴張。
燃氣渦輪機市場報告按容量(小於 30 MW、31-120 MW 和大於 120 MW)、運行循環(複合迴圈、簡單/開式循環、汽電共生/CHP)、燃料類型(天然氣、液體燃料和其他燃料類型)、服務(OEM、MRO)、最終行業(電力、英國和其他國家/地區和其他國家/地區進行歐洲地區)。
區域分析
亞太地區預計到2024年將佔全球銷售額的59.1%,到2030年將以7.96%的複合年成長率成長。煤改氣以及工業擴張正在推動中國、印度、越南和印尼的成長。各國政府的政策鼓勵使用氫能燃氣渦輪機,將其視為中期脫碳的重要一步,提振了該地區的設備訂單。
北美位居第二。燃煤發電廠退役、老舊複合迴圈發電廠的更新換代以及人工智慧賦能的資料中心供電,都是訂單成長的主要因素。隨著獨立電力生產商收購資產組合以獲取容量費和配套服務收入,資產整合仍在繼續。
歐洲面臨天然氣價格波動,但仍在投資興建調峰機組和備用容量市場。新建的再氣化終端和戰略性液化天然氣合約正在恢復燃料供應的穩定性,而具備快速停機能力的簡單迴圈調峰機組有望與大規模離岸風力發電的擴張形成互補。
其他福利:
- Excel格式的市場預測(ME)表
- 3個月的分析師支持
目錄
第1章 引言
- 研究假設和市場定義
- 調查範圍
第2章調查方法
第3章執行摘要
第4章 市場情勢
- 市場概覽
- 市場促進因素
- 與液化天然氣相關的東南亞島嶼電網將推動對移動航空衍生產品的需求。
- 中東地區石化熱電汽電共生建設現狀
- 加勒比海地區航空衍生性商品租賃業務激增,救災需求激增
- 市場限制
- 烏克蘭戰爭後天然氣價格波動抑制歐盟計劃
- 公用事業規模的電池儲能裝置取代了調峰渦輪機(美國/澳洲)
- 歐盟分類法中以ESG主導的貸款監管
- 大型高溫氣道用超合金供應鏈短缺
- 供應鏈分析
- 監管環境
- 技術展望
- 波特五力分析
- 供應商的議價能力
- 消費者議價能力
- 新進入者的威脅
- 替代品的威脅
- 競爭對手之間的競爭
第5章 市場規模與成長預測
- 按產能
- 小於30兆瓦
- 31~120 MW
- 超過120兆瓦
- 按類型
- 複合迴圈
- 簡單/開放式循環
- 汽電共生/CHP
- 按燃料類型
- 天然氣
- 液體燃料(柴油/煤油/液化石油氣)
- 其他燃料類型(氫氣、沼氣)
- 透過服務
- OEM
- 維護、修理和大修 (MRO)
- 按最終用戶行業分類
- 電力
- 石油和天然氣
- 其他終端用戶產業(工業、船舶)
- 按地區
- 北美洲
- 美國
- 加拿大
- 墨西哥
- 歐洲
- 英國
- 德國
- 法國
- 義大利
- 西班牙
- 俄羅斯
- 其他歐洲地區
- 亞太地區
- 中國
- 印度
- 日本
- 韓國
- 東南亞國協
- 亞太其他地區
- 南美洲
- 巴西
- 阿根廷
- 智利
- 其他南美洲
- 中東和非洲
- 沙烏地阿拉伯
- 阿拉伯聯合大公國
- 南非
- 埃及
- 其他中東和非洲地區
- 北美洲
第6章 競爭情勢
- 市場集中度
- 策略性舉措(併購、夥伴關係、購電協議)
- 市場佔有率分析(主要企業的市場排名/佔有率)
- 公司簡介
- General Electric Company
- Siemens Energy AG
- Mitsubishi Heavy Industries Ltd.
- Kawasaki Heavy Industries Ltd.
- Ansaldo Energia SpA
- MAN Energy Solutions SE
- Wartsila Oyj Abp
- Rolls-Royce Holdings plc
- Solar Turbines Incorporated
- Capstone Green Energy Corporation
- Doosan Skoda Power
- IHI Corporation
- Bharat Heavy Electricals Limited
- Harbin Electric Co. Ltd.
- Shanghai Electric Group Co. Ltd.
- OPRA Turbines BV
- Baker Hughes Company
- Vericor Power Systems LLC
- Zorya-Mashproekt
- Nanjing Turbine & Electric Machinery Group
第7章 市場機會與未來展望
The Gas Turbine Market size is estimated at USD 62.54 billion in 2025, and is expected to reach USD 88.06 billion by 2030, at a CAGR of 7.08% during the forecast period (2025-2030).
Momentum comes from energy-security concerns, stricter carbon-reduction policies, and the need for flexible assets that stabilize grids with rising renewable penetration. Rapid growth in data-center electricity demand, spurred by artificial-intelligence workloads, is prompting utilities such as Duke Energy to secure additional turbines that can start quickly and run efficiently. Manufacturers prioritize hydrogen-ready designs, higher combined-cycle efficiencies, and modular construction techniques to lower installation times and cost. Supply-chain constraints for superalloy hot-gas-path parts and financing hurdles linked to ESG taxonomies temper the overall outlook yet have not slowed new-build backlogs.
Global Gas Turbine Market Trends and Insights
Asia-Pacific Coal-to-Gas Transition Accelerating Utility Orders
With coal fleets facing tighter emissions limits, utilities across China, India, and Vietnam are turning to high-efficiency turbines pre-engineered for hydrogen co-firing. China's rollout of a high-capacity hydrogen unit demonstrates national intent to pair clean fuel with dispatchable power. Vietnam is already installing 9HA.02 systems to secure a low-carbon baseload. Singapore plans to run hydrogen-ready units before 2030, highlighting how the gas turbine market bridges renewables and decarbonization goals. Regional procurement pipelines exceed 42 GW of potential capacity additions by 2030.
LNG-Linked Island Grids in Southeast Asia Driving Mobile Aeroderivative Demand
Island economies depend on seasonal tourism and must manage variable renewables on small grids. Portable TM2500 packages, now delivering 34 MW within minutes and operating without water, supply flexible peaking and emergency power. Operators tap floating LNG storage for fuel, enabling quick installation and relocation. Enhanced dry-low-NOx combustion trims emissions, while multi-fuel capability underpins resilience against supply disruptions. As such, aeroderivative suppliers see a distinct niche emerging across archipelagic Southeast Asia and certain Caribbean states.
Gas-Price Volatility Post-Ukraine War Curtailing EU Projects
Russian pipeline flows to Europe dropped 80%, sending spot gas prices to unprecedented highs and undermining project financing for simple-cycle units. Developers now prioritize combined-cycle plants with long-term LNG contracts, while some peaking projects pivot to battery storage. Germany accelerates regasification terminals to secure supply, yet lenders remain cautious until prices stabilize, slowing the gas turbine market in several EU states.
Other drivers and restraints analyzed in the detailed report include:
- Petro-Chemical Cogeneration Build-out in the Middle East
- Disaster-Relief Leasing Surge for Aeroderivative Sets in the Caribbean
- Utility-Scale Battery Storage Displacing Peaking Turbines
For complete list of drivers and restraints, kindly check the Table Of Contents.
Segment Analysis
Large frames exceeding 120 MW captured 58% of 2024 sales, confirming utility preference for high-output, high-efficiency equipment in baseload and combined-cycle duty. Their heavy construction favors thermal stability and endures more viscous fuel blends, a key trait for future hydrogen. The gas turbine market size allocated to this class is forecast to expand steadily at the overall industry pace, given persistent retirements of coal assets.
Mid-range units between 31 MW and 120 MW represent the fastest growing slice at 7.44% CAGR. They balance efficiency with cycling capability, making them attractive for renewables-firming. Enhanced turndown ratios and quick cold starts suit markets with volatile solar or wind profiles. The gas turbine market benefits as data centers deploy dedicated mid-range plants that can match variable computational loads while ensuring local reliability.
Combined-cycle configurations held 75% of 2024 shipments thanks to greater than 64% net efficiencies that cut fuel cost and CO2 per MWh. Integration advances, such as modular heat-recovery steam generators, lower construction timelines, further widening their appeal. The gas turbine market share for combined-cycle designs should increase as new national emissions rules discount simple-cycle projects without carbon-capture provisions.
Simple/open-cycle sets retain importance for peaking and emergency duty, especially in grids needing fast-ramp assets. Cogeneration plants also prosper where industrial hosts value steam output. With overall process-energy utilizations reaching 80%, cogeneration supports petrochemical expansion in the Middle East and Southeast Asia.
The Gas Turbine Market Report is Segmented by Capacity (Below 30 MW, 31 To 120 MW, Above 120 MW), Operating Cycle (Combined Cycle, Simple/Open Cycle, and Cogeneration/CHP), Fuel Type (Natural Gas, Liquid Fuels, and Other Fuel Types), Service (OEM and MRO), End-User Industry (Power, Oil and Gas, and Other End-User Industries), and Geography (North America, Europe, Asia-Pacific, South America, and Middle East and Africa).
Geography Analysis
Asia-Pacific generated 59.1% of 2024 revenue and is set for a 7.96% CAGR through 2030. Combined with industrial expansion, coal-to-gas switching underpins growth in China, India, Vietnam, and Indonesia. Government policies favor hydrogen-capable turbines as a medium-term decarbonization step, reinforcing regional equipment orders.
North America ranks second. Decommissioning coal plants, rejuvenating aging combined-cycle fleets, and powering AI-driven data centers all support volume. Asset consolidation continues with independent power producers acquiring portfolios to capture capacity payments and ancillary-service revenues.
Europe faces gas-price volatility, yet still invests in reserve peaking units and back-up capacity markets. New regasification terminals and strategic LNG contracts restore fuel security, while simple-cycle peakers equipped with fast-shutdown features stand ready to complement large offshore-wind additions.
- General Electric Company
- Siemens Energy AG
- Mitsubishi Heavy Industries Ltd.
- Kawasaki Heavy Industries Ltd.
- Ansaldo Energia SpA
- MAN Energy Solutions SE
- Wartsila Oyj Abp
- Rolls-Royce Holdings plc
- Solar Turbines Incorporated
- Capstone Green Energy Corporation
- Doosan Skoda Power
- IHI Corporation
- Bharat Heavy Electricals Limited
- Harbin Electric Co. Ltd.
- Shanghai Electric Group Co. Ltd.
- OPRA Turbines BV
- Baker Hughes Company
- Vericor Power Systems LLC
- Zorya-Mashproekt
- Nanjing Turbine & Electric Machinery Group
Additional Benefits:
- The market estimate (ME) sheet in Excel format
- 3 months of analyst support
TABLE OF CONTENTS
1 Introduction
- 1.1 Study Assumptions & Market Definition
- 1.2 Scope of the Study
2 Research Methodology
3 Executive Summary
4 Market Landscape
- 4.1 Market Overview
- 4.2 Market Drivers
- 4.2.1 LNG-linked Island Grids in SEA Driving Mobile Aeroderivative Demand
- 4.2.2 Petro-chemical Cogeneration Build-out in Middle East
- 4.2.3 Disaster-Relief Leasing Surge for Aeroderivative Sets in Caribbeans
- 4.3 Market Restraints
- 4.3.1 Gas-price Volatility Post-Ukraine War Curtailing EU Projects
- 4.3.2 Utility-scale Battery Storage Displacing Peaking Turbines (US/Australia)
- 4.3.3 ESG-driven Financing Restrictions under EU Taxonomy
- 4.3.4 Super-alloy Supply-Chain Shortages for Large-Frame Hot-gas-path Parts
- 4.4 Supply-Chain Analysis
- 4.5 Regulatory Landscape
- 4.6 Technological Outlook
- 4.7 Porter's Five Forces Analysis
- 4.7.1 Bargaining Power of Suppliers
- 4.7.2 Bargaining Power of Consumers
- 4.7.3 Threat of New Entrants
- 4.7.4 Threat of Substitute Products and Services
- 4.7.5 Intensity of Competitive Rivalry
5 Market Size & Growth Forecasts
- 5.1 By Capacity
- 5.1.1 Below 30 MW
- 5.1.2 31 to 120 MW
- 5.1.3 Above 120 MW
- 5.2 By Type
- 5.2.1 Combined Cycle
- 5.2.2 Simple/Open Cycle
- 5.2.3 Cogeneration/CHP
- 5.3 By Fuel Type
- 5.3.1 Natural Gas
- 5.3.2 Liquid Fuels (Diesel/Kerosene/LPG)
- 5.3.3 Other Fuel Types (Hydrogen, Biogas)
- 5.4 By Service
- 5.4.1 OEM
- 5.4.2 Maintenance, Repair and Overhaul (MRO)
- 5.5 By End-User Industry
- 5.5.1 Power
- 5.5.2 Oil and Gas
- 5.5.3 Other End-user Indutries (Industrial, Marine)
- 5.6 By Geography
- 5.6.1 North America
- 5.6.1.1 United States
- 5.6.1.2 Canada
- 5.6.1.3 Mexico
- 5.6.2 Europe
- 5.6.2.1 United Kingdom
- 5.6.2.2 Germany
- 5.6.2.3 France
- 5.6.2.4 Italy
- 5.6.2.5 Spain
- 5.6.2.6 Russia
- 5.6.2.7 Rest of Europe
- 5.6.3 Asia-Pacific
- 5.6.3.1 China
- 5.6.3.2 India
- 5.6.3.3 Japan
- 5.6.3.4 South Korea
- 5.6.3.5 ASEAN Countries
- 5.6.3.6 Rest of Asia-Pacific
- 5.6.4 South America
- 5.6.4.1 Brazil
- 5.6.4.2 Argentina
- 5.6.4.3 Chile
- 5.6.4.4 Rest of South America
- 5.6.5 Middle East and Africa
- 5.6.5.1 Saudi Arabia
- 5.6.5.2 United Arab Emirates
- 5.6.5.3 South Africa
- 5.6.5.4 Egypt
- 5.6.5.5 Rest of Middle East and Africa
- 5.6.1 North America
6 Competitive Landscape
- 6.1 Market Concentration
- 6.2 Strategic Moves (M&A, Partnerships, PPAs)
- 6.3 Market Share Analysis (Market Rank/Share for key companies)
- 6.4 Company Profiles (includes Global level Overview, Market level overview, Core Segments, Financials as available, Strategic Information, Products & Services, and Recent Developments)
- 6.4.1 General Electric Company
- 6.4.2 Siemens Energy AG
- 6.4.3 Mitsubishi Heavy Industries Ltd.
- 6.4.4 Kawasaki Heavy Industries Ltd.
- 6.4.5 Ansaldo Energia SpA
- 6.4.6 MAN Energy Solutions SE
- 6.4.7 Wartsila Oyj Abp
- 6.4.8 Rolls-Royce Holdings plc
- 6.4.9 Solar Turbines Incorporated
- 6.4.10 Capstone Green Energy Corporation
- 6.4.11 Doosan Skoda Power
- 6.4.12 IHI Corporation
- 6.4.13 Bharat Heavy Electricals Limited
- 6.4.14 Harbin Electric Co. Ltd.
- 6.4.15 Shanghai Electric Group Co. Ltd.
- 6.4.16 OPRA Turbines BV
- 6.4.17 Baker Hughes Company
- 6.4.18 Vericor Power Systems LLC
- 6.4.19 Zorya-Mashproekt
- 6.4.20 Nanjing Turbine & Electric Machinery Group
7 Market Opportunities & Future Outlook
- 7.1 White-space & Unmet-Need Assessment
 燃氣渦輪機
燃氣渦輪機 複合循環 (CC)的全球市場 (以季度為基礎)
 泛氫燃氣渦輪機市場:按配置、容量、部署、燃料混合比、應用和最終用戶分類的全球預測,2026-2032年微型燃氣渦輪機發電機市場:按燃料類型、功率輸出、銷售管道、應用和最終用戶分類的全球預測(2026-2032年)陸基燃氣渦輪機市場:按類型、功率、應用、技術、燃料類型和安裝方式分類,全球預測,2026-2032年
 2026-2034年全球燃氣渦輪機市場規模、佔有率、趨勢和成長分析報告
 2026年全球燃氣渦輪機服務市場報告
 燃氣渦輪機服務市場 - 全球產業規模、佔有率、趨勢、機會及預測(按渦輪機類型、渦輪機容量、服務類型、銷售管道、最終用途、地區和競爭格局分類,2021-2031年)全球燃氣渦輪機市場:市場規模、佔有率、成長率、產業分析、類型、應用和區域分析,未來預測(2026-2034)
 渦流渦輪機市場規模、佔有率和成長分析(按應用、類型、材質、最終用途和地區分類)—2026-2033年產業預測