


 |
市場調查報告書
商品編碼
1851334
振動感測器:市場佔有率分析、行業趨勢、統計數據和成長預測(2025-2030 年)Vibration Sensor - Market Share Analysis, Industry Trends & Statistics, Growth Forecasts (2025 - 2030) |
||||||
※ 本網頁內容可能與最新版本有所差異。詳細情況請與我們聯繫。
預計到 2025 年,振動感測器市場規模將達到 61 億美元,到 2030 年將達到 86 億美元,在此期間的複合年成長率為 7.10%。
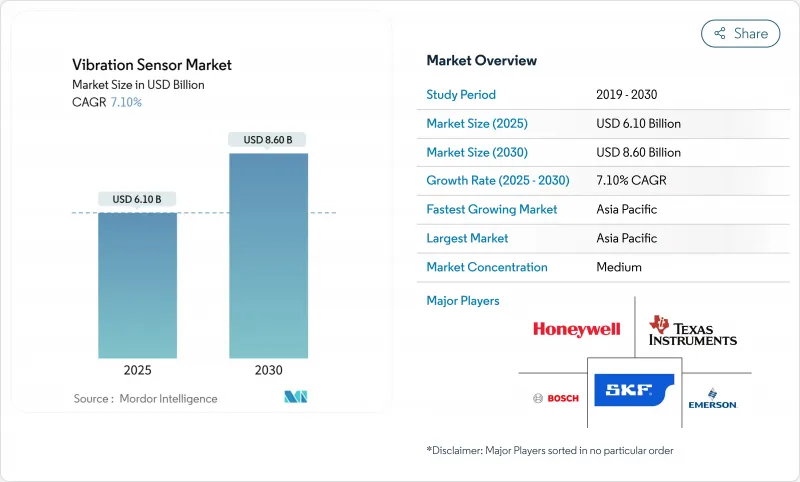
對預測性維護項目的持續投入、MEMS設計的微型化以及更嚴格的機器健康法規正在加速工廠、風電場和汽車製造廠對MEMS技術的應用。亞太地區的製造商、風力發電機所有者和汽車組裝投入了大部分資金,這得益於感測器價格的下降和該地區半導體製造能力的擴張。無線連接降低了安裝成本,邊緣AI韌體減少了數據流量,使得感測器能夠在偏遠和危險環境中使用。同時,中國將於2025年對用於陶瓷感測元件的稀土元素實施出口限制,使得供應鏈多元化變得迫切。
全球振動感測器市場趨勢與洞察
預測性維護計劃在連續製程工業的普及
亞太地區的工廠營運商利用預測性維護技術,將計劃外停機成本降低了高達 50%。該技術依賴密集的感測器網路,將高頻數據傳輸到分析引擎。早期計劃,例如 Nordic Sugar 公司蒸氣乾燥機的維修,展示了 13 天的故障預測窗口,檢驗了該技術對大型化學和鋼鐵廠的投資回報。持續監測取代了定期檢查,嵌入節點的邊緣運算晶片將延遲降低到毫秒級。中國對工業 4.0 升級的獎勵策略保持了這一勢頭,每個工廠都整合了數千個設備。因此,振動感測器市場獲得了由維護預算而非資本支出週期驅動的長期重複性需求。
無線MEMS感測器在危險油氣田的興起
海上平台和煉油廠採用了經認證的無線節點,無需在ATEX區域鋪設昂貴的電纜。壓電能量採集器的電池壽命超過三年,進一步延長了維護週期。營運商評估了在不中斷生產的情況下改裝的能力,而中斷生產每小時的成本可能高達5萬美元。每個感測器內建的FFT處理功能可產生可操作的軸承磨損指標,從而減少了對現場振動分析師的需求。這些優勢擴大了目標客戶群,並重振了碳氫化合物經濟體的振動感測器市場,這些經濟體在數位化維護方面歷來進展緩慢。
極端溫度下壓電感測器的校準漂移
壓電元件在 110 度C以上會出現輸出偏差,在中加熱速率下誤差可達 1.06%。在熱循環頻繁的渦輪引擎和航太引擎中,頻繁的重新校準增加了生命週期成本。高溫單晶壓電元件雖然能在 600 °C 以上可靠運行,但價格昂貴。開發人員探索了補償電路和雙感測器配置,但複雜的設計限制了其在大眾市場的吸引力。由此產生的性能-價格權衡阻礙了它們在振動感測器市場高要求細分領域的擴張。
細分市場分析
加速計的營收累計在2024年成長54.4%,其三軸感測器在汽車、智慧型手機和工廠馬達等領域的廣泛應用將推動價值61億美元的振動感測器市場成長。無線速度感測器雖然價值較小,但到2030年將以9.1%的複合年成長率成長,因為煉油廠和管道工程師越來越意識到速度與軸承健康狀況之間的直接關聯。
小型化趨勢推動了新一代加速計的發展,例如博世Sensortec公司的BMA580,它在滿足穿戴式裝置靈敏度要求的同時,將封裝體積縮小了76%。這些晶片的邊緣濾波功能僅傳輸異常值,從而節省網狀網路的頻寬。能源採集的同步進步延長了節點壽命,使遠端設備的維護週期縮短至五年。這些改進將振動感測器市場拓展至穿戴式裝置和基於狀態的潤滑系統等領域,這些領域先前一直受到功率和尺寸的限制。
由於壓電元件具有低頻靈敏度,預計到2024年其市佔率將維持在46.3%;而隨著半導體晶圓廠實現晶圓級經濟效益,MEMS元件的出貨量將以10.3%的複合年成長率成長。振動感測器市場受益於單晶粒整合技術,該技術將分立式模擬前端整合到緊湊的系統晶片封裝中。
德克薩斯(TI) 的超音波鏡頭清潔演示突顯了 MEMS 技術的多功能性,該技術利用可編程振動來清除汽車攝影機上的污垢。鑄造技術的進步使得測量亞 G 級振動的多軸陣列成為可能,適用於結構健康監測;而壓阻式和電容式設計則實現了具有低佔空比的超低功耗穿戴式裝置。這種多元化的產品組合使 OEM 廠商能夠根據頻寬、成本和功耗選擇合適的架構,從而提高了振動感測器在市場上的普及率。
振動感測器市場按產品類型(加速計、速度感測器、位移感測器、其他)、技術(壓電、壓阻式、電容式、應變計、MEMS)、材料(石英、壓電陶瓷、摻雜矽、其他)、終端用戶產業(汽車、航太與國防、其他)和地區(北美、歐洲、亞太、南美、中東和非洲)進行細分。
區域分析
亞太地區將在2024年以34.2%的市場佔有率佔據榜首,這主要得益於中國風力發電機部署和印度半導體設計中心的發展推動了區域需求。該地區將維持領先地位至2030年,年複合成長率將達到8.3%,超過全球平均。日本精密機械製造商正在訂購用於機器人的高解析度感測器,這將進一步擴大該地區的振動感測器市場。
北美地區的需求主要源自於化工企業和航太專案對抗輻射設備的ISO合規性要求。美國國防部傾向空氣間隙邊緣處理單元,以降低網路安全風險。加拿大礦業公司在偏遠礦區安裝了強大的無線網狀網路,這些礦區由於有線連接不切實際,從而為振動感測器市場開闢了新的領域。
歐洲展現出高度成熟的技術水平,例如寶馬公司配備感測器的機器狗在引擎工廠巡邏。斯堪的納維亞的近海離岸風力發電電場為15兆瓦的風力渦輪機配備了高通道數系統,用於監測偏航和葉片諧波。嚴格的職業安全指令確保了技術的穩定升級,儘管面臨宏觀經濟逆風,振動感測器市場仍然保持韌性。
儘管南美洲和中東/非洲是新興經濟體,但其市場仍保持活力。巴西的礦業公司和農產品加工商開始採用狀態監控套件,這得益於微機電系統(MEMS)成本的下降。沿岸地區的國家石油公司(NOC)在其火炬塔和壓縮機上採用了經ATEX認證的無線感測器,迅速擴大了危險區域振動感測器的市場。
其他福利:
- Excel格式的市場預測(ME)表
- 3個月的分析師支持
目錄
第1章 引言
- 研究假設和市場定義
- 調查範圍
第2章調查方法
第3章執行摘要
第4章 市場情勢
- 市場概覽
- 市場促進因素
- 商業流程工業中預測性維護計畫的普及程度(亞太地區)
- 無線MEMS感測器在危險油氣場所(中東)的興起
- 邊緣人工智慧在汽車組裝中的診斷(歐洲)
- 歐盟和北美強制要求遵守 ISO 20816 標準
- 擴大風力發電機安裝規模(北歐和中國)
- 穿戴式裝置和可聽設備推動了對小型化的需求。
- 市場限制
- 極端溫度下壓電感測器的校準漂移
- 基於雲端基礎的分析的資料安全問題(國防)
- 特種壓電陶瓷材料短缺(中國出口配額)
- 價值鏈分析
- 技術展望
- 波特五力分析
- 新進入者的威脅
- 供應商的議價能力
- 買方的議價能力
- 替代品的威脅
- 競爭對手之間的競爭
- 投資分析
- 評估市場的宏觀經濟因素
第5章 市場規模與成長預測
- 依產品類型
- 加速計
- 速度感測器
- 位移感測器
- 陀螺儀(振動級)
- 透過技術
- 壓電
- 壓阻器
- 電容式
- 應變計
- MEMS
- 材料
- 石英
- 壓電陶瓷
- 摻雜矽
- 其他
- 按最終用途行業分類
- 車
- 航太/國防
- 石油和天然氣
- 工業生產
- 發電(包括風力發電)
- 衛生保健
- 消費性電子產品和穿戴式裝置
- 其他
- 按地區
- 北美洲
- 美國
- 加拿大
- 歐洲
- 德國
- 英國
- 法國
- 義大利
- 西班牙
- 其他歐洲地區
- 亞太地區
- 中國
- 台灣
- 日本
- 韓國
- 印度
- ASEAN
- 亞太其他地區
- 南美洲
- 墨西哥
- 巴西
- 阿根廷
- 其他南美洲
- 中東和非洲
- 中東
- 沙烏地阿拉伯
- 阿拉伯聯合大公國
- 土耳其
- 其他中東地區
- 非洲
- 南非
- 其他非洲地區
- 北美洲
第6章 競爭情勢
- 市場集中度
- 策略性舉措(併購、夥伴關係、資金籌措)
- 市佔率分析
- 公司簡介
- Emerson Electric Co.
- SKF AB
- Honeywell International Inc.
- Analog Devices Inc.
- TE Connectivity Ltd
- Bosch Sensortec GmbH
- Texas Instruments Inc.
- National Instruments Corp.
- Rockwell Automation Inc.
- NXP Semiconductors NV
- Parker Hannifin Corp.
- Baker Hughes(Bently Nevada)
- Wilcoxon Sensing Technologies
- PCB Piezotronics Inc.
- Meggitt PLC(Sensing Systems)
- IMI Sensors
- ifm electronic GmbH
- Siemens AG
- Omron Corporation
- Hansford Sensors Ltd
第7章 市場機會與未來展望
The vibration sensor market size is valued at USD 6.10 billion in 2025 and is forecast to reach USD 8.60 billion by 2030, reflecting a 7.10% CAGR during the period.
Continued investment in predictive maintenance programs, miniaturized MEMS designs, and stricter machinery-health regulations accelerated adoption across factories, wind farms, and vehicle plants. Asia-Pacific manufacturers, wind turbine owners, and automotive assemblers directed much of this spending, aided by falling sensor prices and local semiconductor capacity expansions. Wireless connectivity reduced installation costs, and edge-AI firmware cut data traffic, making sensors viable for remote or hazardous sites. Meanwhile, supply-chain diversification gained urgency after China's 2025 export controls on rare-earth inputs used in ceramic sensing elements.
Global Vibration Sensor Market Trends and Insights
Proliferation of Predictive Maintenance Programs in Continuous Process Industries
Asia-Pacific plant operators used predictive maintenance to reduce unplanned downtime costs by up to 50%, relying on dense sensor grids that stream high-frequency data to analytics engines. Early projects such as the Nordic Sugar steam-dryer retrofit demonstrated 13-day fault-prediction windows, validating payback for large chemical and steel sites. Continuous monitoring displaced periodic walk-by inspections, and edge-computing chips embedded in nodes lowered latency to millisecond levels. Chinese stimulus for Industry 4.0 upgrades-maintained momentum, embedding thousands of devices per facility. Consequently, the vibration sensor market gained long-run recurring demand from maintenance budgets rather than capital expenditure cycles.
Rise of Wireless MEMS Sensors for Hazardous Oil and Gas Sites
Offshore platforms and refineries adopted certified wireless nodes that eliminated costly cable runs through ATEX zones. Battery lives exceeded three years, and piezoelectric energy harvesters further prolonged service intervals. Operators valued retrofit capability without shutting down throughput that could otherwise cost USD 50,000 per hour. Embedded FFT processing in each sensor produced actionable bearing-wear metrics, reducing the need for on-site vibration analysts. These benefits widened the addressable base and lifted the vibration sensor market in hydrocarbon economies that historically lagged digital-maintenance adoption.
Calibration Drift of Piezoelectric Sensors at Extreme Temperatures
Piezoelectric elements experienced output deviations above 110 °C, with errors hitting 1.06% at moderate heating rates. Frequent recalibration raised lifecycle costs in turbines and aerospace engines where thermal cycling was routine. High-temperature single-crystal alternatives operated reliably beyond 600 °C but commanded premium pricing. Developers explored compensation circuits and dual-sensor configurations, yet complex designs limited mass-market appeal. The resulting performance-price trade-off slowed deployments in harsh-duty niches of the vibration sensor market.
Other drivers and restraints analyzed in the detailed report include:
- Edge-AI Enabled Diagnostics in Automotive Assembly
- Mandatory ISO 20816 Compliance in EU and North America
- Data-Security Concerns in Cloud-based Analytics (Defense)
For complete list of drivers and restraints, kindly check the Table Of Contents.
Segment Analysis
Accelerometers generated 54.4% revenue in 2024, underpinning the vibration sensor market size of USD 6.10 billion through their tri-axial versatility in vehicles, smartphones, and factory motors. Wireless velocity devices, though smaller in value, led growth at 9.1% CAGR to 2030 as refinery and pipeline engineers valued velocity's direct correlation with bearing health.
The miniaturization push spurred next-generation accelerometers such as Bosch Sensortec's BMA580, which reduced package volume by 76% while meeting sensitivity targets for hearables. Edge filtering in these chips cuts outbound data by transmitting only anomalies, conserving bandwidth in mesh networks. Parallel advances in energy harvesting prolonged node life, enabling five-year maintenance intervals on remote assets. Together, these enhancements allowed the vibration sensor market to broaden into wearables and condition-based lubrication systems previously constrained by power or size limits.
Piezoelectric elements retained a 46.3% share in 2024 thanks to low-frequency sensitivity, but MEMS shipments expanded at a 10.3% CAGR as semiconductor fabs delivered wafer-level economies. The vibration sensor market benefited from single-die integration that collapsed discrete analog front-ends into compact system-on-chip packages.
Texas Instruments' ultrasonic lens-cleaning demo highlighted MEMS versatility, using programmable vibrations to remove contaminants from automotive cameras. Foundry advances enabled multi-axis arrays measuring sub-g vibrations suitable for structural-health monitoring. Meanwhile, piezoresistive and capacitive designs served ultra-low-power wearables where duty cycles were sparse. This diversified portfolio allowed OEMs to choose architectures based on bandwidth, cost, and power, expanding overall penetration of the vibration sensor market.
Vibration Sensor Market is Segmented by Product Type (Accelerometers, Velocity Sensors, Displacement Sensors, and More), Technology (Piezoelectric, Piezoresistive, Capacitive, Strain-Gauge, and MEMS), Material (Quartz, Piezoelectric Ceramics, Doped Silicon, and Others), End-Use Industry (Automotive, Aerospace and Defense, and More), and Geography (North America, Europe, Asia-Pacific, South America, and Middle East and Africa).
Geography Analysis
Asia-Pacific led with a 34.2% share in 2024 as China's wind-turbine roll-outs and India's semiconductor design centers lifted local demand. The region's 8.3% CAGR also out-paced global averages, preserving its leadership through 2030. Japanese precision-machinery firms ordered high-resolution sensors for robotics, further enlarging the vibration sensor market in the bloc.
North America followed, driven by ISO compliance in chemical plants and aerospace programs requiring radiation-tolerant devices. US defense retrofits favored edge-processed units that remained air-gapped, mitigating cybersecurity exposure. Canadian miners installed ruggedized wireless mesh networks across remote pits where wired runs were impractical, adding niche demand to the vibration sensor market.
Europe exhibited advanced maturity, exemplified by BMW's sensor-equipped robo-dogs patrolling engine plants. Nordic offshore wind farms fitted high-channel-count systems on 15 MW turbines to monitor yaw and blade harmonics. Strict worker-safety directives assured steady upgrades, keeping the vibration sensor market resilient despite macroeconomic headwinds.
South America and the Middle East/Africa remained emerging but dynamic. Brazilian miners and agribusiness processors began installing condition-monitoring kits, aided by falling MEMS costs. Gulf-region NOCs embraced ATEX-rated wireless sensors for flare stacks and compressors, quickly expanding the vibration sensor market footprint in hazardous-area deployments.
- Emerson Electric Co.
- SKF AB
- Honeywell International Inc.
- Analog Devices Inc.
- TE Connectivity Ltd
- Bosch Sensortec GmbH
- Texas Instruments Inc.
- National Instruments Corp.
- Rockwell Automation Inc.
- NXP Semiconductors N.V.
- Parker Hannifin Corp.
- Baker Hughes (Bently Nevada)
- Wilcoxon Sensing Technologies
- PCB Piezotronics Inc.
- Meggitt PLC (Sensing Systems)
- IMI Sensors
- ifm electronic GmbH
- Siemens AG
- Omron Corporation
- Hansford Sensors Ltd
Additional Benefits:
- The market estimate (ME) sheet in Excel format
- 3 months of analyst support
TABLE OF CONTENTS
1 INTRODUCTION
- 1.1 Study Assumptions and Market Definition
- 1.2 Scope of the Study
2 RESEARCH METHODOLOGY
3 EXECUTIVE SUMMARY
4 MARKET LANDSCAPE
- 4.1 Market Overview
- 4.2 Market Drivers
- 4.2.1 Proliferation of Predictive Maintenance Programs in Continuous Process Industries (Asia Pacific)
- 4.2.2 Rise of Wireless MEMS Sensors for Hazardous Oil and Gas Sites (Middle East)
- 4.2.3 Edge-AI Enabled Diagnostics in Automotive Assembly (Europe)
- 4.2.4 Mandatory ISO 20816 Compliance in EU and North America
- 4.2.5 Expansion of Wind Turbine Installations (Nordics and China)
- 4.2.6 Miniaturization Demand from Wearables and Hearables
- 4.3 Market Restraints
- 4.3.1 Calibration Drift of Piezoelectric Sensors at Extreme Temperatures
- 4.3.2 Data-Security Concerns in Cloud-based Analytics (Defense)
- 4.3.3 Shortage of Specialty Piezo-ceramic Materials (China Export Quotas)
- 4.4 Value Chain Analysis
- 4.5 Technological Outlook
- 4.6 Porter's Five Forces Analysis
- 4.6.1 Threat of New Entrants
- 4.6.2 Bargaining Power of Suppliers
- 4.6.3 Bargaining Power of Buyers
- 4.6.4 Threat of Substitutes
- 4.6.5 Intensity of Competitive Rivalry
- 4.7 Investment Analysis
- 4.8 Assessment of Macroeconomic Factors on the Market
5 MARKET SIZE AND GROWTH FORECASTS (VALUE)
- 5.1 By Product Type
- 5.1.1 Accelerometers
- 5.1.2 Velocity Sensors
- 5.1.3 Displacement Sensors
- 5.1.4 Gyroscopes (Vibration-Grade)
- 5.2 By Technology
- 5.2.1 Piezoelectric
- 5.2.2 Piezoresistive
- 5.2.3 Capacitive
- 5.2.4 Strain-Gauge
- 5.2.5 MEMS
- 5.3 By Material
- 5.3.1 Quartz
- 5.3.2 Piezoelectric Ceramics
- 5.3.3 Doped Silicon
- 5.3.4 Others
- 5.4 By End-Use Industry
- 5.4.1 Automotive
- 5.4.2 Aerospace and Defense
- 5.4.3 Oil and Gas
- 5.4.4 Industrial Manufacturing
- 5.4.5 Power Generation (incl. Wind)
- 5.4.6 Healthcare
- 5.4.7 Consumer Electronics and Wearables
- 5.4.8 Others
- 5.5 By Geography
- 5.5.1 North America
- 5.5.1.1 United States
- 5.5.1.2 Canada
- 5.5.2 Europe
- 5.5.2.1 Germany
- 5.5.2.2 United Kingdom
- 5.5.2.3 France
- 5.5.2.4 Italy
- 5.5.2.5 Spain
- 5.5.2.6 Rest of Europe
- 5.5.3 Asia-Pacific
- 5.5.3.1 China
- 5.5.3.2 Taiwan
- 5.5.3.3 Japan
- 5.5.3.4 South Korea
- 5.5.3.5 India
- 5.5.3.6 ASEAN
- 5.5.3.7 Rest of Asia-Pacific
- 5.5.4 South America
- 5.5.4.1 Mexico
- 5.5.4.2 Brazil
- 5.5.4.3 Argentina
- 5.5.4.4 Rest of South America
- 5.5.5 Middle East and Africa
- 5.5.5.1 Middle East
- 5.5.5.1.1 Saudi Arabia
- 5.5.5.1.2 United Arab Emirates
- 5.5.5.1.3 Turkey
- 5.5.5.1.4 Rest of Middle East
- 5.5.5.2 Africa
- 5.5.5.2.1 South Africa
- 5.5.5.2.2 Rest of Africa
- 5.5.1 North America
6 COMPETITIVE LANDSCAPE
- 6.1 Market Concentration
- 6.2 Strategic Moves (M&A, Partnerships, Funding)
- 6.3 Market Share Analysis
- 6.4 Company Profiles (includes Global-level Overview, Market-level Overview, Core Segments, Financials, Strategic Information, Market Rank/Share, Products and Services, Recent Developments)
- 6.4.1 Emerson Electric Co.
- 6.4.2 SKF AB
- 6.4.3 Honeywell International Inc.
- 6.4.4 Analog Devices Inc.
- 6.4.5 TE Connectivity Ltd
- 6.4.6 Bosch Sensortec GmbH
- 6.4.7 Texas Instruments Inc.
- 6.4.8 National Instruments Corp.
- 6.4.9 Rockwell Automation Inc.
- 6.4.10 NXP Semiconductors N.V.
- 6.4.11 Parker Hannifin Corp.
- 6.4.12 Baker Hughes (Bently Nevada)
- 6.4.13 Wilcoxon Sensing Technologies
- 6.4.14 PCB Piezotronics Inc.
- 6.4.15 Meggitt PLC (Sensing Systems)
- 6.4.16 IMI Sensors
- 6.4.17 ifm electronic GmbH
- 6.4.18 Siemens AG
- 6.4.19 Omron Corporation
- 6.4.20 Hansford Sensors Ltd
7 MARKET OPPORTUNITIES AND FUTURE OUTLOOK
- 7.1 White-space and Unmet-Need Assessment
 振動感測器市場:按類型、頻率範圍、安裝配置、軸配置、輸出方式、應用和最終用戶產業分類-2026-2032年全球市場預測
 全球振動感測器市場規模、佔有率、趨勢和成長分析報告(2026-2034年)
 2026年全球振動感測器市場報告超音波振動感測器市場按技術、產品類型、頻率範圍、應用、最終用戶和銷售管道,全球預測(2026-2032年)
 2025-2033年振動感測器市場報告(按產品、技術、材料、最終用途產業和地區)
 美國振動感測器市場:市場佔有率分析、行業趨勢、統計數據和成長預測(2025-2030 年)
 2032 年振動感測器市場預測:按類型、監測流程、設備、材料、網路、技術、最終用戶和地區進行的全球分析2032 年無線振動感測器市場預測:按感測器類型、應用和地區進行的全球分析
 振動感測器市場規模、佔有率和成長分析(按類型、監測過程、訊號、設備、技術、材料、垂直產業和地區)- 2025-2032 年產業預測中東和非洲的振動感測器:市場佔有率分析、產業趨勢和成長預測(2025-2030)