


 |
市場調查報告書
商品編碼
1851333
石油和天然氣自動化:市場佔有率分析、行業趨勢、統計數據和成長預測(2025-2030 年)Oil & Gas Automation - Market Share Analysis, Industry Trends & Statistics, Growth Forecasts (2025 - 2030) |
||||||
※ 本網頁內容可能與最新版本有所差異。詳細情況請與我們聯繫。
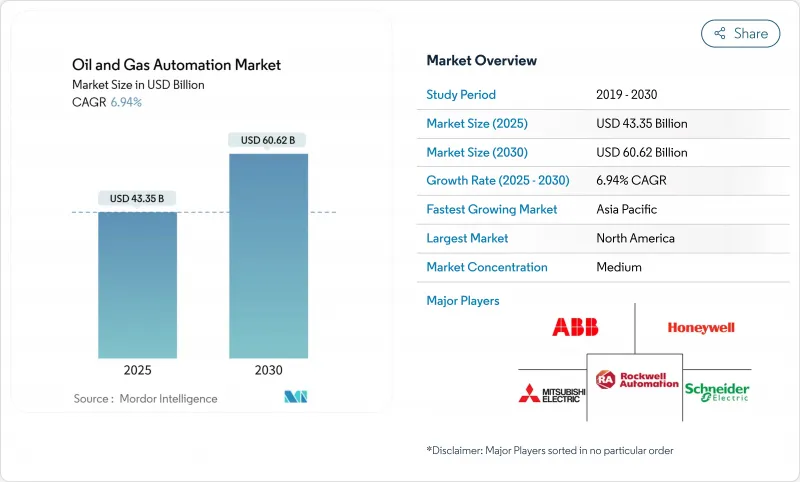
預計到 2025 年,石油和天然氣自動化市場規模將達到 433.5 億美元,到 2030 年將達到 606.2 億美元,預測期內複合年成長率為 6.9%。
在供應鏈日益緊張和能源轉型目標不斷推進的背景下,營運商正在部署智慧現場平台、邊緣人工智慧分析和自主檢測工具,以減少停機時間並提高生產效率。強制性安全法規,特別是符合IEC 61511和ISA-84標準的法規,正在加速採用能夠在毫秒內回應危險的安全儀器系統。亞太和非洲液化天然氣基礎設施的擴張,推動了對能夠在高壓和-160°C低溫環境下運作的低溫級控制系統的新需求。最後,隨著營運商加強操作技術(OT)環境以抵禦勒索軟體和國家級攻擊,網路安全預算也在增加,目前已佔自動化總支出的15-20%,並正在重塑計劃經濟格局。
全球油氣自動化市場趨勢與洞察
數位油田平台應用日益普及
即時數位平台將物聯網感測器、機器學習模型和雲端分析技術整合到整合式儀表板中,將決策週期從幾分鐘縮短到幾秒鐘。德文能源公司在實施人工智慧驅動的鑽井調整後,將油井壽命延長了25%。與即時運行資料同步的虛擬孿生模型使工程師能夠在不危及實體資產的情況下測試各種方案。這種方法在井下條件不斷變化的非常規儲存中尤其有效。
遠端監控和預測性維護的現代化資本支出
營運商正將資金轉向遠端監控工具,以減少現場巡檢次數和安全風險。 Enbridge 基於 Azure 的管線分析技術已將威脅偵測率提高了 30%。預測演算法透過分析振動和熱趨勢,提前數週發現故障,從而在提高可靠性的同時,將日常檢查成本降低高達 50%。
原油價格波動會影響營運支出和資本支出週期。
油價波動與支出變化之間存在六個月的滯後,這迫使小型生產商在現金流緊張時期推遲自動化升級。基於訂閱的自動化服務因其收費系統與產量掛鉤而日益受到青睞,因為它們可以降低領先風險,並在經濟低迷時期保持流動性。
細分市場分析
到2024年,軟體收入將佔石油和天然氣自動化市場總收入的66.7%,其分析引擎將為預測性維護和自主營運提供支援。以以金額為準,該部分在2024年將佔石油和天然氣自動化市場規模的289億美元。服務雖然規模較小,但預計也將以8.5%的複合年成長率成長,因為營運商會將人工智慧配置和網路安全增強等工作外包。
軟體成長將主要由邊緣人工智慧軟體包驅動,這些軟體包將使鑽井穿透率提高35%至45%。同時,包含24小時監控和基於結果的保固服務的服務合約將促使供應商從產品供應商轉變為性能合作夥伴。雖然硬體對於感測器網路和強大的邊緣設備仍然至關重要,但隨著虛擬化控制邏輯向軟體層轉移,其佔有率預計將逐漸下降。
在上游工程中,能夠校準頁岩油井數千個井下參數的自主鑽井和生產最佳化平台,預計到2024年將貢獻59.1%的製程收入,約佔油氣自動化市場256億美元的佔有率。中游業務雖然規模較小,但在全球LNG接收站建設和管道數位化的推動下,正以8.3%的複合年成長率成長。
上游企業如SLB在一條水平井段上展示了25次自動地質導向修正,標誌著鑽機正向全自動化轉型。中游企業正在使用雲端SCADA系統,實現跨越數千公里的即時洩漏偵測和遠端閥門操作,將事故回應時間從數小時縮短至數分鐘。下游企業正在試驗應用人工智慧驅動的蒸餾塔,以降低能耗並減少排放。
區域分析
北美將在2024年引領油氣自動化市場,佔據37.1%的營收佔有率,主要得益於頁岩油開發商率先採用人工智慧主導的鑽井和墊片最佳化技術。儘管鑽機數量有所波動,但該地區持續的學習和適應循環使其生產力保持在高位。此外,該地區的網路安全狀況也在日趨成熟,營運商正在採用聯邦指導方針要求的零信任營運技術(OT)框架。
預計到2030年,亞太地區的年複合成長率將達到7.5%。中國正在對其煉油廠進行現代化改造,以生產更清潔的燃料;印度正在加速推進其深水油田的上游數位化。東南亞的大型液化天然氣進口計劃正依賴人工智慧驅動的低溫控制系統來保障供應,並平衡電網與間歇性可再生能源之間的電力關係。各國政府正在支持數位雙胞胎,並推動技術應用,以減少排放並提高安全性。
在嚴格的安全和環保法規下,歐洲保持穩定的支出。德國和芬蘭新建的液化天然氣再氣化裝置正在整合符合SIL-3安全等級和NIS 2.0網路安全要求的分散式控制系統(DCS)平台。中東國家石油公司在主權財富基金的支持下,正在成熟的碳酸鹽岩儲存中推廣人工智慧主導的油井監測,例如阿布達比國家石油公司(ADNOC)投資9.2億美元的ENERGYai計畫。非洲和南美洲仍然是新興的應用地區,它們通常利用合資夥伴進行技術轉移和資金籌措。
其他福利:
- Excel格式的市場預測(ME)表
- 3個月的分析師支持
目錄
第1章 引言
- 研究假設和市場定義
- 調查範圍
第2章調查方法
第3章執行摘要
第4章 市場情勢
- 市場概覽
- 市場促進因素
- 數位油田平台應用日益普及
- 遠端監控和預測性維護的現代化資本支出
- 強制性安全系統法規
- 亞太和非洲的液化天然氣和中游建設
- 在危險工作場所部署邊緣人工智慧進行即時分析
- 用於海上資產的自主巡檢無人機和機器人
- 市場限制
- 原油價格波動對營運支出和資本支出週期的影響
- 網路風險日益加劇,OT 安全合規成本不斷攀升
- 自動化初期投資高,投資報酬率不確定性
- 舊有系統互通性
- 價值鏈分析
- 技術展望
- 監管環境
- 波特五力分析
- 供應商的議價能力
- 買方的議價能力
- 新進入者的威脅
- 替代品的威脅
- 競爭對手之間的競爭
- 投資分析
- 評估宏觀經濟趨勢對市場的影響
第5章 市場規模與成長預測
- 按組件
- 硬體
- 軟體
- 服務
- 透過流程
- 上游
- 中產階級
- 下游
- 透過技術
- 感測器和發射器
- 分散式控制系統(DCS)
- 可程式邏輯控制器(PLC)
- 監控與數據採集(SCADA)
- 安全儀器系統(SIS)
- 其他技術
- 透過使用
- 鑽井及完井
- 生產和油井最佳化
- 管道和運輸
- 煉油/石油化工
- LNG接收站及儲存設施
- 按地區
- 北美洲
- 美國
- 加拿大
- 墨西哥
- 歐洲
- 德國
- 英國
- 法國
- 義大利
- 西班牙
- 其他歐洲地區
- 亞太地區
- 中國
- 日本
- 印度
- 韓國
- 澳洲
- 亞太其他地區
- 南美洲
- 巴西
- 阿根廷
- 其他南美洲
- 中東和非洲
- 中東
- 沙烏地阿拉伯
- 阿拉伯聯合大公國
- 土耳其
- 其他中東地區
- 非洲
- 南非
- 埃及
- 奈及利亞
- 其他非洲地區
- 北美洲
第6章 競爭情勢
- 市場集中度
- 策略趨勢
- 市佔率分析
- 公司簡介
- ABB Ltd.
- Honeywell International Inc.
- Siemens AG
- Schneider Electric SE
- Emerson Electric Co.
- Rockwell Automation Inc.
- Mitsubishi Electric Corp.
- Yokogawa Electric Corp.
- Eaton Corp.
- Dassault Systemes SE
- Bosch Rexroth AG
- Texas Instruments Inc.
- Johnson Controls International plc
- Halliburton Co.
- Schlumberger NV
- Baker Hughes Co.
- Weatherford International plc
- AVEVA Group plc
- Aspen Technology Inc.
- Flowserve Corp.
第7章 市場機會與未來展望
The oil & gas automation market size reached a value of USD 43.35 billion in 2025 and is set to climb to USD 60.62 billion by 2030, registering a 6.9% CAGR during the forecast period.
Operators are embracing intelligent field platforms, edge-AI analytics, and autonomous inspection tools to curb downtime and lift productivity as supply chains tighten and energy transition goals intensify. Mandatory safety regulations, especially those aligned with IEC 61511 and ISA-84, are accelerating uptake of Safety Instrumented Systems that respond to hazards in milliseconds. LNG infrastructure expansion across Asia-Pacific and Africa is unlocking new demand for cryogenic-grade control systems that handle high-pressure, -160 °C environments. Finally, growing cybersecurity budgets-now 15-20% of total automation spend-are reshaping project economics as operators harden operational technology (OT) environments against ransomware and state-sponsored attacks.
Global Oil & Gas Automation Market Trends and Insights
Rising Adoption of Digital-Oilfield Platforms
Real-time digital platforms fuse IoT sensors, machine-learning models, and cloud analytics into unified dashboards that shorten decision cycles from minutes to seconds. Devon Energy lifted well longevity by 25% after deploying AI-guided drilling adjustments. Virtual twins synchronised with live operating data let engineers test scenarios without risking physical assets, an approach that is especially potent in unconventional reservoirs where downhole conditions vary by the hour.
Modernisation CAPEX for Remote Monitoring and Predictive Maintenance
Operators are redirecting capital toward remote surveillance tools that cut site visits and shrink safety exposure. Enbridge's Azure-based pipeline analytics improved threat detection by 30%. Predictive algorithms study vibration and thermal trends to spot failures weeks in advance, trimming routine inspection costs up to 50% while boosting reliability.
Crude-Oil Price Volatility Impacting OPEX and CAPEX Cycles
Six-month lags between crude swings and spending shifts force smaller producers to delay automation upgrades when cash flows tighten. Subscription-based automation services that align fees with production volumes are gaining favour because they lower upfront risk and preserve liquidity during downturns.
Other drivers and restraints analyzed in the detailed report include:
- Mandatory Safety-System Regulations
- LNG and Mid-Stream Build-Out in Asia-Pacific and Africa
- Escalating Cyber-Risk and OT-Security Compliance Costs
For complete list of drivers and restraints, kindly check the Table Of Contents.
Segment Analysis
Software captured 66.7% of 2024 revenue, anchoring the oil & gas automation market through analytics engines that power predictive maintenance and autonomous operations. In value terms, the component accounted for USD 28.9 billion of the oil & gas automation market size in 2024. Services, although smaller, are projected for an 8.5% CAGR as operators outsource AI configuration and cybersecurity hardening.
Software growth is reinforced by edge-AI packages that lift drilling rates of penetration by 35-45%. Meanwhile, service contracts that bundle 24-hour monitoring and outcome-based guarantees move providers from product suppliers to performance partners. Hardware remains essential for sensor grids and ruggedised edge devices; however, its share is expected to decline gradually as virtualised control logic migrates to software layers.
Upstream activities generated 59.1% of 2024 process revenue as autonomous drilling and production optimisation platforms calibrated thousands of downhole parameters at shale wells. This translated to roughly USD 25.6 billion of the oil & gas automation market size. Midstream operations, while holding a smaller base, are growing at 8.3% CAGR due to global LNG terminal build-outs and pipeline digitisation.
Upstream players like SLB demonstrated 25 automatic geosteering corrections on a single lateral, signalling a shift toward fully autonomous rigs. For midstream firms, cloud-linked SCADA systems enable real-time leak detection and remote valve actuation across thousands of kilometres, reducing incident response time from hours to minutes. Downstream sites are piloting AI-directed distillation columns that cut energy use and trim emissions.
The Oil & Gas Automation Market Report is Segmented by Component (Hardware, Software, and Services), Process (Upstream, Midstream, and Downstream), Technology (Sensors and Transmitters, Distributed Control Systems (DCS), and More), Application (Drilling and Completion, Production and Well Optimization, and More), and Geography. The Market Forecasts are Provided in Terms of Value (USD).
Geography Analysis
North America led the oil & gas automation market with 37.1% revenue share in 2024, buoyed by shale developers that pioneered AI-steered drilling and pad optimisation. Persistent learn-and-apply cycles keep regional productivity high even when rig counts fluctuate. The region's cybersecurity posture is also mature, with operators adopting zero-trust OT frameworks mandated by federal guidelines.
Asia-Pacific is poised for a 7.5% CAGR through 2030. China is modernising refineries to produce cleaner fuels, while India accelerates upstream digitisation across deep-water blocks. Massive LNG import projects in Southeast Asia rely on AI-enabled cryogenic controls to secure supply and balance power grids with intermittent renewables. Governments support digital twins to curb emissions and enhance safety, propelling technology adoption.
Europe maintains steady spending under stringent safety and environmental regulations. New LNG regasification units in Germany and Finland integrate DCS platforms that meet SIL-3 safety layers and NIS 2.0 cybersecurity mandates. Middle Eastern national oil companies, supported by sovereign funds, scale AI-driven well monitoring across mature carbonate reservoirs, exemplified by ADNOC's USD 920 million ENERGYai program. Africa and South America remain emerging adopters, often leveraging joint-venture partners for technology transfer and financing.
- ABB Ltd.
- Honeywell International Inc.
- Siemens AG
- Schneider Electric SE
- Emerson Electric Co.
- Rockwell Automation Inc.
- Mitsubishi Electric Corp.
- Yokogawa Electric Corp.
- Eaton Corp.
- Dassault Systemes SE
- Bosch Rexroth AG
- Texas Instruments Inc.
- Johnson Controls International plc
- Halliburton Co.
- Schlumberger NV
- Baker Hughes Co.
- Weatherford International plc
- AVEVA Group plc
- Aspen Technology Inc.
- Flowserve Corp.
Additional Benefits:
- The market estimate (ME) sheet in Excel format
- 3 months of analyst support
TABLE OF CONTENTS
1 INTRODUCTION
- 1.1 Study Assumptions and Market Definition
- 1.2 Scope of the Study
2 RESEARCH METHODOLOGY
3 EXECUTIVE SUMMARY
4 MARKET LANDSCAPE
- 4.1 Market Overview
- 4.2 Market Drivers
- 4.2.1 Rising adoption of digital-oilfield platforms
- 4.2.2 Modernization CAPEX for remote monitoring and predictive maintenance
- 4.2.3 Mandatory safety-system regulations
- 4.2.4 LNG and mid-stream build-out in APAC and Africa
- 4.2.5 Edge-AI deployment for real-time analytics at hazardous sites
- 4.2.6 Autonomous inspection drones and robotics for offshore assets
- 4.3 Market Restraints
- 4.3.1 Crude-oil price volatility impacting OPEX and CAPEX cycles
- 4.3.2 Escalating cyber-risk and OT-security compliance costs
- 4.3.3 High upfront automation expenditure and ROI uncertainty
- 4.3.4 Legacy-system interoperability
- 4.4 Value Chain Analysis
- 4.5 Technological Outlook
- 4.6 Regulatory Landscape
- 4.7 Porter's Five Forces Analysis
- 4.7.1 Bargaining Power of Suppliers
- 4.7.2 Bargaining Power of Buyers
- 4.7.3 Threat of New Entrants
- 4.7.4 Threat of Substitute Products
- 4.7.5 Intensity of Competitive Rivalry
- 4.8 Investment Analysis
- 4.9 Assessment of the Impact of Macroeconomic Trends on the Market
5 MARKET SIZE AND GROWTH FORECASTS (VALUE)
- 5.1 By Component
- 5.1.1 Hardware
- 5.1.2 Software
- 5.1.3 Services
- 5.2 By Process
- 5.2.1 Upstream
- 5.2.2 Midstream
- 5.2.3 Downstream
- 5.3 By Technology
- 5.3.1 Sensors and Transmitters
- 5.3.2 Distributed Control Systems (DCS)
- 5.3.3 Programmable Logic Controllers (PLC)
- 5.3.4 Supervisory Control and Data Acquisition (SCADA)
- 5.3.5 Safety Instrumented Systems (SIS)
- 5.3.6 Other Technologies
- 5.4 By Application
- 5.4.1 Drilling and Completion
- 5.4.2 Production and Well Optimization
- 5.4.3 Pipeline and Transportation
- 5.4.4 Refining and Petrochemicals
- 5.4.5 LNG Terminals and Storage
- 5.5 By Geography
- 5.5.1 North America
- 5.5.1.1 United States
- 5.5.1.2 Canada
- 5.5.1.3 Mexico
- 5.5.2 Europe
- 5.5.2.1 Germany
- 5.5.2.2 United Kingdom
- 5.5.2.3 France
- 5.5.2.4 Italy
- 5.5.2.5 Spain
- 5.5.2.6 Rest of Europe
- 5.5.3 Asia-Pacific
- 5.5.3.1 China
- 5.5.3.2 Japan
- 5.5.3.3 India
- 5.5.3.4 South Korea
- 5.5.3.5 Australia
- 5.5.3.6 Rest of Asia-Pacific
- 5.5.4 South America
- 5.5.4.1 Brazil
- 5.5.4.2 Argentina
- 5.5.4.3 Rest of South America
- 5.5.5 Middle East and Africa
- 5.5.5.1 Middle East
- 5.5.5.1.1 Saudi Arabia
- 5.5.5.1.2 United Arab Emirates
- 5.5.5.1.3 Turkey
- 5.5.5.1.4 Rest of Middle East
- 5.5.5.2 Africa
- 5.5.5.2.1 South Africa
- 5.5.5.2.2 Egypt
- 5.5.5.2.3 Nigeria
- 5.5.5.2.4 Rest of Africa
- 5.5.1 North America
6 COMPETITIVE LANDSCAPE
- 6.1 Market Concentration
- 6.2 Strategic Moves
- 6.3 Market Share Analysis
- 6.4 Company Profiles (includes Global level Overview, Market level overview, Core Segments, Financials as available, Strategic Information, Market Rank/Share for key companies, Products and Services, and Recent Developments)
- 6.4.1 ABB Ltd.
- 6.4.2 Honeywell International Inc.
- 6.4.3 Siemens AG
- 6.4.4 Schneider Electric SE
- 6.4.5 Emerson Electric Co.
- 6.4.6 Rockwell Automation Inc.
- 6.4.7 Mitsubishi Electric Corp.
- 6.4.8 Yokogawa Electric Corp.
- 6.4.9 Eaton Corp.
- 6.4.10 Dassault Systemes SE
- 6.4.11 Bosch Rexroth AG
- 6.4.12 Texas Instruments Inc.
- 6.4.13 Johnson Controls International plc
- 6.4.14 Halliburton Co.
- 6.4.15 Schlumberger NV
- 6.4.16 Baker Hughes Co.
- 6.4.17 Weatherford International plc
- 6.4.18 AVEVA Group plc
- 6.4.19 Aspen Technology Inc.
- 6.4.20 Flowserve Corp.
7 MARKET OPPORTUNITIES AND FUTURE OUTLOOK
- 7.1 White-space and Unmet-need Assessment
 油氣自動化市場規模、佔有率和成長分析:按組件、操作、技術、應用、最終用戶和地區分類 - 2026-2033 年產業預測
 2026年全球油氣自動化市場報告
 全球油氣自動化市場預測(至2032年):按組件、製程、技術、應用和地區分類
 Frost Radar:石油和天然氣自動化,2025全球石油與天然氣(O&G)自動化市場,2024-2030年
 亞太地區石油和天然氣自動化:市場佔有率分析、產業趨勢、統計和成長預測(2025-2030)2025 年石油數位化與自動化十大成長機會
 石油和天然氣自動化市場報告:2030 年趨勢、預測和競爭分析