


 |
市場調查報告書
商品編碼
1851302
印尼可再生能源:市場佔有率分析、行業趨勢、統計數據和成長預測(2025-2030 年)Indonesia Renewable Energy - Market Share Analysis, Industry Trends & Statistics, Growth Forecasts (2025 - 2030) |
||||||
※ 本網頁內容可能與最新版本有所差異。詳細情況請與我們聯繫。
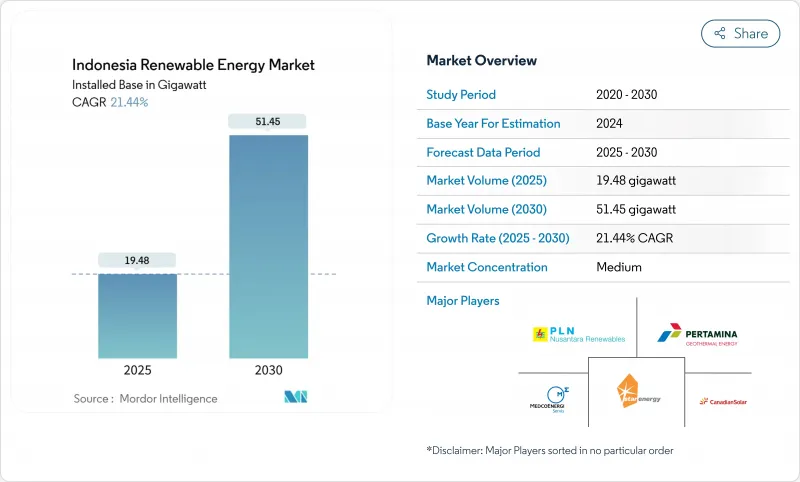
預計印尼可再生能源市場裝置容量將從 2025 年的 19.48 吉瓦成長到 2030 年的 51.45 吉瓦,預測期(2025-2030 年)複合年成長率為 21.44%。
強勁的政策利好、技術成本下降和不斷成長的商業需求正在推動這一發展勢頭,同時政府也在努力平衡應對氣候變遷的目標與經濟成長。 2025年1月,普拉博沃·蘇比安托總統為總價值72兆印尼盾(約44億美元)的37個電力計劃舉行了落成典禮,凸顯了政府大力推動電網升級和新增發電能力的決心。儘管水力發電仍是發電結構中的主導力量,但隨著計劃經濟效益的提升以及獨立發電企業擺脫對傳統資產的依賴,太陽能印尼幣正以最快的速度成長。包括200億美元的「公正能源轉型夥伴關係」在內的氣候融資湧入,正在緩解資金緊張的局面,但煤炭產能過剩和印尼國家電力公司(PLN)的單一買家模式仍然阻礙著私人投資。
印尼可再生能源市場趨勢與洞察
降低太陽能和風能的平準化度電成本
預計到2024年,全球太陽能光電發電的平均成本將降至0.044美元/度,而陸上風電成本將降至0.033美元/千瓦時,低於煤炭發電的基準成本0.065美元/千瓦時。印尼將於2024年8月放寬國內木材進口限制,這將允許業者在維持陸上組裝的同時進口價格更低的組件,從而加快計劃進度。有鑑於此,印尼國家電力公司(PLN)致力於控制發電成本,尤其是在燃料成本規避和碳價格風險的雙重作用下,新建設的經濟效益正向再生能源傾斜。因此,印尼的可再生能源市場正穩步轉向太陽能光伏和風能,以擴大新建裝置容量。正在進行的資金籌措改革透過降低開發商過去面臨的待開發區,進一步擴大了成本差距。
RUPTL 53GW新增可再生能源裝置容量(2025-2034年)
印尼電力供應計畫預計到2034年將新增69.5吉瓦發電裝置容量,其中76%將來自可再生或電池儲能,需要投資2,967兆印尼幣(約1,825億美元)。該計畫73%的資金將來自夥伴關係,印尼可再生能源市場預計將朝著更深層的技術多元化方向發展。藍圖還包括17.1吉瓦的太陽能光電發電、7.2吉瓦的風能發電和5.2吉瓦的地熱發電,將使電網擺脫以往以水力發電為主的局面,變得更加靈活。計畫興建的兩座250兆瓦核能發電廠凸顯了印尼對低碳基本負載電力供應的長期追求,而2040年可再生能源佔比達到41%的目標則為投資者提供了更清晰的前景。
煤炭過剩產能與營運義務購電協議
傳統煤炭購電協議要求印尼國家電力公司(PLN)即使在電廠暫停狀態的情況下也必須支付容量費,每年對PLN造成超過80億美元的損失。這些強制運作條款阻礙了更廉價再生能源的採購,並限制了短期擴張,儘管其經濟效益良好。煤炭的結構性鎖定問題本應透過能源轉型機制下的加速折舊方案獲得資金並重新談判合約來緩解,但時間表仍不明朗,並持續限制印尼可再生能源市場的成長。
細分市場分析
預計到2024年,水力發電將維持印尼可再生能源市場50.56%的佔有率,主要得益於豐富的河流資源和成熟的水壩網路。 510兆瓦的巴塘托魯水力發電廠計劃和其他老舊水壩將維持較高的基準發電量,並保障電網可靠性。同時,145兆瓦的西拉塔浮體式光電站展示了開發商如何利用水庫資源建造大規模光電站,而無需徵用新的土地。
太陽能光電發電無疑是成長引擎,隨著組件價格下降和屋頂安裝政策的推廣,預計到2030年將成長24%。浮體式和地面式光伏計劃為實現2025-2034年再生能源發展規劃(RUPTL)中17.1吉瓦的目標鋪平了道路。地熱發電雖然仍屬於小眾但韌性十足的領域,這主要得益於Star Energy在薩拉克(Salak)和瓦揚溫杜(Wayang Windu)投資3.46億美元建設的102.6吉瓦擴建項目。蘇拉威西島和東努沙登加拉沿海地區的風電前景正在改善,但土地徵用糾紛影響了計畫進度。總而言之,這些變化顯示印尼可再生能源市場規模正處於快速成長期,並逐漸擺脫對水力發電的過度依賴。
印尼可再生能源市場報告按發電來源(太陽能、風力發電、水力發電、地熱能、生質能源)、終端用戶(公用事業規模、商業/工業、住宅)和安裝類型(併網、離網/微電網、帶儲能的混合可再生能源)進行細分。市場規模和預測以裝置容量(吉瓦)為單位。
其他福利:
- Excel格式的市場預測(ME)表
- 3個月的分析師支持
目錄
第1章 引言
- 研究假設和市場定義
- 調查範圍
第2章調查方法
第3章執行摘要
第4章 市場情勢
- 市場概覽
- 可再生能源組合
- 市場促進因素
- 降低太陽能和風能的平準化度電成本
- RUPTL 2025-34 年專案規劃新增 53 吉瓦再生能源
- JETP和多邊氣候資金流入
- 推廣強制性B40/B50生質燃料摻混
- 資料中心和企業購電協議 (PPA) 蓬勃發展
- 用於最後一公里電氣化的離網微電網
- 市場限制
- 煤炭產能過剩和必須執行的購電協議
- 與東協同業相比,資本成本更高
- PLN的壟斷地位限制了競爭。
- 風力發電廠和水力發電廠的土地徵用糾紛
- 供應鏈分析
- 監管環境
- 技術展望
- 波特五力模型
- 供應商的議價能力
- 買方的議價能力
- 新進入者的威脅
- 替代品的威脅
- 競爭對手之間的競爭
- PESTEL 分析
第5章 市場規模與成長預測
- 按來源
- 太陽的
- 風力
- 水力
- 地熱
- 生質能源
- 最終用戶
- 實用規模
- 商業和工業
- 住宅
- 按安裝類型
- 併網集中式
- 離網微電網
- 混合再生能源和儲能
第6章 競爭情勢
- 市場集中度
- 策略性舉措(併購、夥伴關係、購電協議)
- 市場佔有率分析(主要企業的市場排名/佔有率)
- 公司簡介
- PLN Renewables(PT Pembangkitan Jawa-Bali, PT Indonesia Power)
- Pertamina Geothermal Energy
- Star Energy Geothermal
- Medco Power Indonesia
- Canadian Solar Inc.
- Trina Solar Ltd
- PT Sumber Energi Sukses Makmur
- PT Barito Renewables Energy Tbk
- SEG Solar
- PT ATW Solar Indonesia
- Fourth Partner Energy Pvt Ltd
- Xurya Daya Indonesia
- TotalEnergies ENEOS
- ACWA Power
- Masdar
- Northstar PLTS
- Bright PLN Batam
- PT Supreme Energy
- PT Geo Dipa Energi
- PT Sarulla Operations
第7章 市場機會與未來展望
The Indonesia Renewable Energy Market size in terms of installed base is expected to grow from 19.48 gigawatt in 2025 to 51.45 gigawatt by 2030, at a CAGR of 21.44% during the forecast period (2025-2030).
Strong policy tailwinds, falling technology costs, and rising corporate demand drive this momentum while the government balances climate goals with economic growth. President Prabowo Subianto's January 2025 inauguration of 37 electricity projects worth IDR 72 trillion (USD 4.4 billion) underscored state backing for grid upgrades and new capacity . Hydropower still leads the generation mix, yet solar PV registers the fastest growth as project economics improve, and independent power producers diversify beyond legacy assets. Climate-finance inflows, including the USD 20 billion Just Energy Transition Partnership, are easing capital constraints, though coal over-capacity and PLN's single-buyer model continue to slow private investment.
Indonesia Renewable Energy Market Trends and Insights
Falling solar & wind LCOE
Global average solar costs fell to USD 0.044/kWh in 2024 and onshore wind to USD 0.033/kWh, undercutting coal's USD 0.065/kWh benchmark . Indonesia's August 2024 relaxation of local-content rules lets developers import cheaper modules while keeping assembly onshore, accelerating project pipelines. These economics sharpen PLN's focus on curbing generation costs, especially as avoided fuel outlays and carbon-pricing risks tilt new-build economics toward renewables. The result is a steady pivot in the Indonesian renewable energy market toward solar and wind for green-field capacity additions. Ongoing financing reforms further magnify this cost parity by narrowing the premium that developers once faced.
RUPTL 2025-34 Pipeline of 53 GW New Renewable Capacity
Indonesia's power-supply plan calls for 69.5 GW of new capacity by 2034, 76% of which is renewable or storage, requiring IDR 2,967 trillion (USD 182.5 billion) in investment . Private partnerships are expected to fund 73% of this pipeline, shifting the Indonesian renewable energy market toward deeper technology diversification. The roadmap earmarks 17.1 GW solar, 7.2 GW wind, and 5.2 GW geothermal, moving beyond hydropower's historic dominance and enabling a more flexible grid. Two planned 250 MW nuclear units underscore a longer-term quest for baseload low-carbon supply, while the 41% renewable target for 2040 offers clearer visibility for investors.
Coal Over-Capacity & Must-Run PPAs
Legacy coal PPAs obligate PLN to pay capacity charges even when plants are idle, costing the utility more than USD 8 billion annually . These must-run clauses crowd out procurement of cheaper renewables, limiting short-term additions despite favorable economics. Coal's structural lock-in is set to ease only as early-retirement schemes under the Energy Transition Mechanism secure funding and renegotiate contracts, but the timetable remains uncertain and continues to temper growth in the Indonesian renewable energy market.
Other drivers and restraints analyzed in the detailed report include:
- JETP & Multilateral Climate-Finance Inflows
- Mandatory B40/B50 Biofuel Blending Push
- High Cost of Capital versus ASEAN Peers
For complete list of drivers and restraints, kindly check the Table Of Contents.
Segment Analysis
Hydropower retained 50.56% of the Indonesian renewable energy market share in 2024 on the back of extensive riverine assets and mature dam networks. The 510 MW Batang Toru project and other legacy dams keep baseline output high, anchoring grid reliability. In parallel, the Cirata 145 MWac floating-solar plant illustrates how developers use reservoirs to install PV at scale without new land footprints.
Solar PV is the undisputed growth engine, compounding 24% through 2030 as module prices fall and rooftop policies gain traction. Floating and ground-mount projects pave the way toward the 17.1 GW target in RUPTL 2025-34. Geothermal retains a niche yet resilient path, buoyed by Star Energy's USD 346 million expansion that will add 102.6 MW across Salak and Wayang Windu. Wind prospects improve along coastal Sulawesi and East Nusa Tenggara, although land-acquisition disputes weigh on timelines. Collectively, these shifts keep the Indonesian renewable energy market size on its rapid trajectory while broadening the mix away from hydropower concentration.
The Indonesia Renewable Energy Market Report is Segmented by Source (Solar, Wind, Hydro, Geothermal, and Bioenergy), End User (Utility-Scale, Commercial and Industrial, and Residential), and Installation Type (Grid-Connected Centralised, Off-Grid Microgrid, and Hybrid RE and Storage). The Market Size and Forecasts are Provided in Terms of Installed Capacity (GW).
List of Companies Covered in this Report:
- PLN Renewables (PT Pembangkitan Jawa-Bali, PT Indonesia Power)
- Pertamina Geothermal Energy
- Star Energy Geothermal
- Medco Power Indonesia
- Canadian Solar Inc.
- Trina Solar Ltd
- PT Sumber Energi Sukses Makmur
- PT Barito Renewables Energy Tbk
- SEG Solar
- PT ATW Solar Indonesia
- Fourth Partner Energy Pvt Ltd
- Xurya Daya Indonesia
- TotalEnergies ENEOS
- ACWA Power
- Masdar
- Northstar PLTS
- Bright PLN Batam
- PT Supreme Energy
- PT Geo Dipa Energi
- PT Sarulla Operations
Additional Benefits:
- The market estimate (ME) sheet in Excel format
- 3 months of analyst support
TABLE OF CONTENTS
1 Introduction
- 1.1 Study Assumptions & Market Definition
- 1.2 Scope of the Study
2 Research Methodology
3 Executive Summary
4 Market Landscape
- 4.1 Market Overview
- 4.2 Renewable Energy Mix
- 4.3 Market Drivers
- 4.3.1 Falling solar & wind LCOE
- 4.3.2 RUPTL 2025-34 pipeline of 53 GW new RE
- 4.3.3 JETP & multilateral climate-finance inflows
- 4.3.4 Mandatory B40/B50 biofuel blending push
- 4.3.5 Data-centre & corporate PPA boom
- 4.3.6 Off-grid microgrids for last-mile electrification
- 4.4 Market Restraints
- 4.4.1 Coal over-capacity & must-run PPAs
- 4.4.2 High cost of capital vs ASEAN peers
- 4.4.3 PLN single-buyer monopoly limits competition
- 4.4.4 Land-acquisition conflicts in wind/hydro sites
- 4.5 Supply-Chain Analysis
- 4.6 Regulatory Landscape
- 4.7 Technological Outlook
- 4.8 Porter's Five Forces
- 4.8.1 Bargaining Power of Suppliers
- 4.8.2 Bargaining Power of Buyers
- 4.8.3 Threat of New Entrants
- 4.8.4 Threat of Substitutes
- 4.8.5 Competitive Rivalry
- 4.9 PESTLE Analysis
5 Market Size & Growth Forecasts
- 5.1 By Source
- 5.1.1 Solar
- 5.1.2 Wind
- 5.1.3 Hydro
- 5.1.4 Geothermal
- 5.1.5 Bioenergy
- 5.2 By End User
- 5.2.1 Utility-Scale
- 5.2.2 Commercial and Industrial
- 5.2.3 Residential
- 5.3 By Installation Type
- 5.3.1 Grid-Connected Centralised
- 5.3.2 Off-Grid Microgrid
- 5.3.3 Hybrid RE and Storage
6 Competitive Landscape
- 6.1 Market Concentration
- 6.2 Strategic Moves (M&A, Partnerships, PPAs)
- 6.3 Market Share Analysis (Market Rank/Share for key companies)
- 6.4 Company Profiles (includes Global level Overview, Market level overview, Core Segments, Financials as available, Strategic Information, Products & Services, and Recent Developments)
- 6.4.1 PLN Renewables (PT Pembangkitan Jawa-Bali, PT Indonesia Power)
- 6.4.2 Pertamina Geothermal Energy
- 6.4.3 Star Energy Geothermal
- 6.4.4 Medco Power Indonesia
- 6.4.5 Canadian Solar Inc.
- 6.4.6 Trina Solar Ltd
- 6.4.7 PT Sumber Energi Sukses Makmur
- 6.4.8 PT Barito Renewables Energy Tbk
- 6.4.9 SEG Solar
- 6.4.10 PT ATW Solar Indonesia
- 6.4.11 Fourth Partner Energy Pvt Ltd
- 6.4.12 Xurya Daya Indonesia
- 6.4.13 TotalEnergies ENEOS
- 6.4.14 ACWA Power
- 6.4.15 Masdar
- 6.4.16 Northstar PLTS
- 6.4.17 Bright PLN Batam
- 6.4.18 PT Supreme Energy
- 6.4.19 PT Geo Dipa Energi
- 6.4.20 PT Sarulla Operations
7 Market Opportunities & Future Outlook
- 7.1 White-space & Unmet-Need Assessment
 可再生能源證書/信用額度(REC)市場-全球及區域分析:按應用、產品和地區分類-分析與預測(2025-2035)
 再生能源保險市場機會、成長促進因素、產業趨勢分析及預測(2025-2034年)
 可再生能源證書市場預測至2032年:按類型、能源來源、發電工程容量、最終用戶和地區分類的全球分析
 商業再生能源市場規模、佔有率、成長及全球產業分析:依類型、應用和地區劃分的洞察與預測(2024-2032 年)2032 年可再生能源創新市場預測:按組件、技術、應用、最終用戶和地區進行的全球分析綠色/可再生能源市場預測至2032年:按能源來源、技術、應用、最終用戶和地區分類的全球分析
 全球綠色電力市場(按技術、產量、安裝類型和最終用戶分類)預測 2025-2032
 2025年全球節能設備市場報告2032年替代能源市場預測:按能源來源、最終用戶和地區分類的全球分析2025年全球能源諮詢市場報告