


 |
市場調查報告書
商品編碼
1851273
貨櫃型資料中心:市場佔有率分析、產業趨勢、統計資料和成長預測(2025-2030 年)Containerized Data Center - Market Share Analysis, Industry Trends & Statistics, Growth Forecasts (2025 - 2030) |
||||||
※ 本網頁內容可能與最新版本有所差異。詳細情況請與我們聯繫。
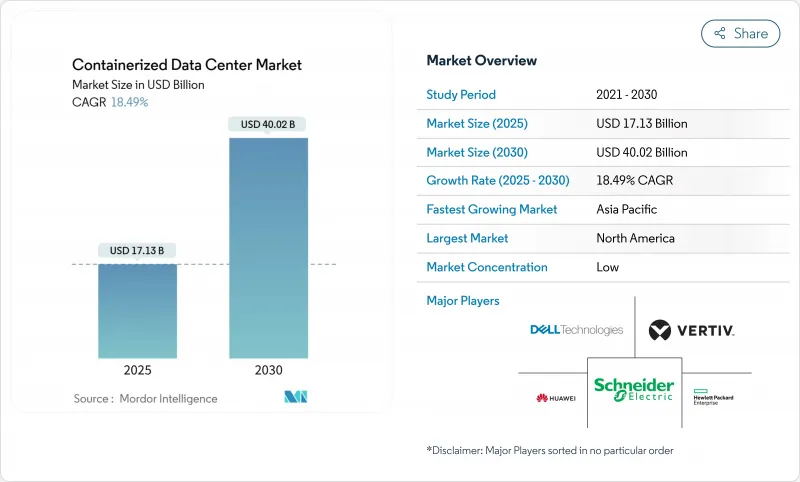
預計到 2025 年,貨櫃型資料中心市場規模將達到 171.3 億美元,到 2030 年將達到 400.2 億美元,年複合成長率為 18.49%。
5G部署、邊緣運算以及更嚴格的永續性要求正在推動對快速部署容量的強勁需求,並持續擴大訂單規模。超大規模業者正在利用貨櫃模組來彌補長達數年的建設延誤,企業也在部署貨櫃模組以滿足資料主權法規的要求。預製組件的高效性正在縮小電源使用效率 (PUE) 的差距,降低整體擁有成本,並使行動性成為競爭優勢。供應商正在結合液冷、熱回收以及核能或氫能微電網來捕獲多餘的電力,使貨櫃型資料中心市場有望實現兩位數的持續成長。
全球貨櫃型資料中心市場趨勢與洞察
邊緣/5G部署加速了微型站點的發展
通訊正在部署數千個微邊緣節點以支援超低延遲服務,他們選擇模組化單元,這些單元只需幾週即可訂購並「啟用」。 2024 年 5 月對 ANSI/TIA-942-C 標準的更新將創建 A 型和 B 型微邊緣評級,為營運商提供統一的合規路徑並加快採購週期。貨櫃式外形設計使供應商能夠隨著覆蓋範圍的演變重新部署容量,從而增強貨櫃型資料中心在人口密集的城市中心和偏遠農村地區的市場地位。需求涵蓋自動駕駛汽車、工業IoT和擴增實境/虛擬實境 (AR/VR) 等領域,所有這些領域都需要在網路邊緣實現持續低於 10 毫秒的延遲。供應商現在將 5G 無線電、MEC 伺服器和電池儲存捆綁到單吊裝單元中,從而縮短部署時間並降低資本風險。隨著 5G 密集化預計將在 2026 年達到峰值,第二波專用網路計劃可能會活性化微站點的發展。
一級樞紐運力短缺
北維吉尼亞、矽谷和倫敦的土地、電力和授權瓶頸導致新的超大規模貨櫃型資料中心計劃推遲到2028年性能驗證使用,迫使營運商租賃可在8到12週內運作的臨時模組化容量。因此,貨櫃式資料中心市場正從臨時性容量溢出轉向策略性佈局,使雲端公司能夠在電網受限的情況下維持客戶服務水準協定(SLA)。維吉尼亞州的房地產投資者報告稱,位於變電站升級改造附近的模組化園區可獲得超過20%的入住溢價。企業將模組化資料中心視為應對核准延遲和電網中斷的保障,許多企業計劃在永久性資料中心投入使用後重新部署其模組化單元。
有限的機架密度和超大規模需求
雖然標準的 40 英尺貨櫃通常每個機架支援 10-15 千瓦的功率,每個模組的 IT 功耗上限為 60-180 千瓦,但專用超大規模機房的密度可達 20-40 千瓦,在類似的占地面積內可達 300-500 千瓦。因此,每個機架需要數百個 GPU 的 AI 和 HPC 叢集需要多個貨櫃和專門的液冷維修,從而推高了每兆瓦的資本成本。在東京和法蘭克福等平方公尺的房地產市場,密度差距甚至更大。供應商正在透過浸沒式冷板設計來應對,但部署驗證案例仍然有限。在密度達到平衡之前,一些超大規模架構師可能會將貨櫃式系統保留用於周邊設備和瞬態負載。
細分市場分析
2024年,在銀行、金融服務和保險(BFSI)以及政府資產管理法規的推動下,購買模式將佔據貨櫃型資料中心市場佔有率的78.2%。然而,租賃/「空白空間即服務」(White-Space-as-a-Service)的複合年成長率(CAGR)高達20.1%。早期採用者指出,捆綁式監控和更新服務能夠減輕員工負擔,並降低技術過時的風險。惠普企業(Hewlett Packard Enterprise)的設施即服務(Facility-as-a-Service)提供多年效能保障服務等級協定(SLA),這表明現有供應商正在積極擁抱訂閱模式。
租賃模式使中型企業也能輕鬆獲得高規格的資料中心容量,並擴大了貨櫃型資料中心在城域網路和邊緣應用場景中的市場佔有率。新興企業可以避免前期投資,大型企業則可以降低殘值風險。租賃期滿後,企業可以靈活地退還、重新部署或更換模組,這同樣契合了人工智慧動態工作負載的特性。然而,在安全級別和客製化工程比租賃更重要的領域,購買模式可能會繼續存在。
到2024年,符合ISO 40英尺標準的貨櫃將佔貨櫃型資料中心市場規模的54.6%,這得益於全球貨運標準和機架成本的降低。客製化/一體化撬裝式資料中心以19.7%的複合年成長率成長,可提供更高的機架數量、晶片級直接冷卻和整合式板載UPS,對人工智慧和分析叢集極具吸引力。 UL 2755認證確保其安全性與固定式資料中心相當,從而降低了企業的採購門檻。
對客製化熱外殼的需求正促使供應商將30kW以上的機架和熱回收迴路設計成非標準尺寸,這提高了平均售價,同時與待開發區機房相比,也加快了部署速度。隨著機架功率在2026年後持續成長,許多超大規模熱感正在考慮採用客製化撬裝方案,將其作為在可再生能源輸送點附近安裝GPU的唯一可行途徑。雖然ISO 20英尺機箱的應用範圍有限,但對於電信邊緣機房和空間受限的都市區屋頂來說,它仍然是可行的選擇。
貨櫃型資料中心市場按所有權類型(購買、租賃/「空間即服務」)、貨櫃類型(ISO 20 英尺、ISO 40 英尺、客製化/一體化撬裝)、部署位置(核心/園區、邊緣/微型、遠端/惡劣環境)、最終用戶產業(IT 和通訊、銀行、金融服務和保險等)以及地區進行細分。市場預測以美元計價。
區域分析
北美地區將佔2024年總收入的29.3%,這主要得益於德克薩斯州、喬治亞和亞伯達等地將加密貨幣挖礦大規模轉型為人工智慧園區。美國正積極採用模組化設計,以避免新電網互聯計畫出現多年積壓;加拿大則採用加強型貨櫃用於瀝青砂監測和北極寬頻閘道器。墨西哥近岸外包業務的復興正促使墨西哥加工出口區(maquiladora)的工廠主部署邊緣貨櫃,將即時品質資料與美國物流中心同步。這些趨勢鞏固了貨櫃型資料中心市場作為跨洲策略佈局的地位。
亞太地區是成長最快的區域,年複合成長率達18.5%。中國、印度和東協正在大力推動5G宏網路建設和智慧城市試點計畫。一些國家提前批准了貨櫃叢集的建設。印度的資料在地化政策將使雲端服務供應商能夠將公民資料集中儲存在更靠近消費區域的地方,從而提振對微區域資料中心的需求。日本和澳洲則重視鋼骨模組固有的抗震抗旋風性能。這些多元化的因素正在鞏固該地區的訂單儲備。
其他福利:
- Excel格式的市場預測(ME)表
- 3個月的分析師支持
目錄
第1章 引言
- 研究假設和市場定義
- 調查範圍
第2章調查方法
第3章執行摘要
第4章 市場情勢
- 市場概覽
- 市場促進因素
- 便攜性和快速部署
- 邊緣/5G部署加速微型站點建設
- 一級樞紐資料中心容量不足
- 節能型預製構件可降低總擁有成本
- 基於SMR的微電網可實現離網直流供電
- 加密貨幣向人工智慧網站的轉型釋放了被擱置的能量
- 市場限制
- 有限的機架和計算密度與超大規模需求不符
- 與傳統資料中心整合的複雜性
- ISO貨櫃供應鏈瓶頸
- 液冷改裝會增加資本支出
- 供應鏈分析
- 監管環境
- 技術展望
- 波特五力模型
- 供應商的議價能力
- 買方的議價能力
- 新進入者的威脅
- 替代品的威脅
- 競爭的激烈程度
- 評估市場的宏觀經濟因素
第5章 市場規模與成長預測
- 依所有權類型
- 購買
- 租賃/閒置頻段即服務
- 按容器類型
- ISO 20-ft
- ISO 40-ft
- 客製化/一體式滑橇
- 按地區
- 核心/校園
- 邊緣/微
- 偏遠/惡劣環境
- 按最終用戶行業分類
- 資訊科技/通訊
- BFSI
- 政府和國防部
- 衛生保健
- 教育
- 其他
- 按地區
- 北美洲
- 美國
- 加拿大
- 墨西哥
- 南美洲
- 巴西
- 阿根廷
- 其他南美洲
- 歐洲
- 德國
- 英國
- 法國
- 荷蘭
- 其他歐洲地區
- 亞太地區
- 中國
- 日本
- 印度
- 韓國
- 澳洲和紐西蘭
- 亞太其他地區
- 中東和非洲
- 中東
- 阿拉伯聯合大公國
- 沙烏地阿拉伯
- 土耳其
- 其他中東地區
- 非洲
- 南非
- 埃及
- 奈及利亞
- 其他非洲地區
- 北美洲
第6章 競爭情勢
- 市場集中度
- 策略趨勢
- 市佔率分析
- 公司簡介
- Vertiv
- Schneider Electric
- Huawei Technologies
- Dell Technologies
- Hewlett Packard Enterprise
- IBM Corporation
- Cisco Systems
- Rittal GmbH and Co. KG
- Delta Electronics
- Eaton Corporation
- Johnson Controls
- PCX Corporation
- BMarko Structures
- Baselayer Technology
- Flexenclosure(Xerxes)
- Cirrascale Cloud Services
- ZTE Corporation
- AST Modular(subs. of Schneider)
- Cannon Technologies
- EdgeMicro/EDJX
- Compass Datacenters
- EdgeConneX
- Vertiv(Emerson Network Power legacy)
- Stulz GmbH
第7章 市場機會與未來展望
The containerized data center market stood at USD 17.13 billion in 2025 and is forecast to reach USD 40.02 billion by 2030, advancing at an 18.49% CAGR.
Surging demand for rapid-deployment capacity, driven by 5G rollouts, edge computing, and stricter sustainability mandates, continues to lengthen order books. Hyperscale operators use container modules to bridge multi-year construction lags, while enterprises deploy them to meet data-sovereignty rules. Prefabricated efficiencies are tightening power usage effectiveness (PUE) margins and lowering total cost of ownership, making mobility a competitive differentiator. Vendors combine liquid cooling, heat-recovery, and nuclear or hydrogen micro-grids to unlock stranded power, positioning the containerized data center market for sustained double-digit expansion.
Global Containerized Data Center Market Trends and Insights
Edge/5G build-outs accelerate micro-sites
Telecom carriers are rolling out thousands of micro edge nodes to support ultra-low-latency services, choosing modular units that move from purchase order to "lights on" in weeks. The May 2024 ANSI/TIA-942-C update created Type A and Type B micro-edge ratings, giving operators a uniform compliance path and accelerating procurement cycles. Container form factors let providers relocate capacity as coverage maps evolve, strengthening the containerized data center market presence in dense urban cores and rural gaps alike. Demand spans autonomous vehicles, industrial IoT, and AR/VR, all of which require consistent sub-10 ms latency at the network edge. Vendors now bundle 5G radios, MEC servers, and battery storage into single-lift units, compressing deployment timelines and capital risk. As 5G densification peaks in 2026, a second wave of private-network projects will keep micro-site pipelines active.
Capacity shortages in Tier-1 hubs
Land, power, and permitting bottlenecks in Northern Virginia, Silicon Valley, and London have pushed new hyperscale projects into 2028 commissioning windows, forcing operators to lease interim modular capacity that can be live in 8-12 weeks. The containerized data center market thus shifts from temporary overflow to strategic footprint, enabling cloud firms to preserve customer SLAs despite grid constraints. Real-estate investors in Virginia report occupancy premiums topping 20% for modular campuses positioned near substation upgrades. Enterprises view the modules as insurance against entitlement delays and grid curtailments, and many plan to redeploy units once permanent halls come online.
Limited rack density vs hyperscale needs
ISO 40-foot boxes typically support 10-15 kW per rack, capping a single module at 60-180 kW IT power, whereas purpose-built hyperscale suites reach 20-40 kW densities and 300-500 kW in comparable floor area. AI and HPC clusters demanding hundreds of GPUs per rack therefore require multiple containers or specialized liquid-cooling retrofits, inflating capital cost per MW. The density gap is magnified in high-real-estate markets like Tokyo and Frankfurt, where every square meter carries a premium. Vendors answer with immersed cold-plate designs, yet deployment proof points remain limited. Until density parity closes, some hyperscale architects will reserve containerized systems for peripheral or transitional loads.
Other drivers and restraints analyzed in the detailed report include:
- Energy-efficient prefabrication lowers TCO
- SMR-powered micro-grids enable off-grid DCs
- Legacy estate integration complexity
For complete list of drivers and restraints, kindly check the Table Of Contents.
Segment Analysis
The Purchase option held 78.2% of containerized data center market share in 2024, fueled by BFSI and government mandates for asset control. However, Lease/"White-Space-as-a-Service" is growing at 20.1% CAGR as CFOs pivot to OpEx models that track utilization. Early adopters note that bundled monitoring and refresh services reduce staffing burdens and de-risk technology obsolescence. Hewlett Packard Enterprise's Facility-as-a-Service offering guarantees performance SLAs over multi-year terms, signaling that incumbent vendors embrace subscription economics.
Leasing democratizes high-spec capacity for mid-tier firms, swelling the containerized data center market footprint across secondary metros and edge use cases. Start-ups avoid upfront capital outlays, while large enterprises offload residual-value risk. The flexibility to return, relocate, or swap modules after the term also fits volatile AI workload profiles. Purchase models will persist where security classification or custom engineering outweigh leasing's convenience, yet the service curve is poised to steepen through 2030.
ISO 40-foot shells retained 54.6% of containerized data center market size in 2024, benefiting from global freight standards and lower per-rack cost. Customized/All-in-One Skids, advancing at 19.7% CAGR, integrate higher rack counts, direct-to-chip liquid cooling, and on-board UPS, appealing to AI and analytics clusters. UL 2755 certification assures safety parity with fixed facilities, easing enterprise procurement hurdles.
Demand for bespoke thermal envelopes pushes vendors to engineer 30 kW-plus racks and heat-reuse loops inside nonstandard footprints, lifting average selling price yet compressing deployment times compared with greenfield halls. As rack power escalates post-2026, many hyperscale architects view custom skids as the only pragmatic route to situate GPUs near renewable feed-in points. ISO 20-foot boxes, while niche, remain relevant for telecom edge shelters and space-constrained urban rooftops.
Containerized Data Center Market is Segmented by Ownership Type ( Purchase, Lease / "White-Space-As-A-Service"), Container Type (ISO 20-Ft, ISO 40-Ft, Customized/All-in-One Skids), Deployment Location ( Core / Campus, Edge / Micro, Remote / Harsh-Environment), End User Industry (IT and Telecommunications, BFSI and More), and by Geography. The Market Forecasts are Provided in Terms of Value (USD).
Geography Analysis
North America held 29.3% of 2024 revenue, anchored by hyperscale conversions of crypto mines into AI campuses across Texas, Georgia, and Alberta. The United States absorbs modules to circumvent multi-year queue backlogs for new grid interconnects, while Canada employs ruggedized pods for tar-sand monitoring and Arctic broadband gateways. Mexico's near-shoring renaissance drives maquiladora plant owners to install edge pods that sync real-time quality data with US logistics hubs. Together these trends reinforce the containerized data center market as a strategic overlay across the continent.
Asia-Pacific, the fastest-growing region at 18.5% CAGR, scales 5G macro builds and smart-city pilots across China, India, and ASEAN. Provinces grant accelerated permits for container clusters that can later shift sites as urban plans evolve. India's data-localization rulebook boosts demand for micro-regional pods, allowing cloud providers to ring-fence citizen data near consumption zones. Japan and Australia value seismic and cyclone resilience inherent in steel-framed modules. Collectively, diversified drivers keep the region's order pipeline robust.
- Vertiv
- Schneider Electric
- Huawei Technologies
- Dell Technologies
- Hewlett Packard Enterprise
- IBM Corporation
- Cisco Systems
- Rittal GmbH and Co. KG
- Delta Electronics
- Eaton Corporation
- Johnson Controls
- PCX Corporation
- BMarko Structures
- Baselayer Technology
- Flexenclosure (Xerxes)
- Cirrascale Cloud Services
- ZTE Corporation
- AST Modular (subs. of Schneider)
- Cannon Technologies
- EdgeMicro / EDJX
- Compass Datacenters
- EdgeConneX
- Vertiv (Emerson Network Power legacy)
- Stulz GmbH
Additional Benefits:
- The market estimate (ME) sheet in Excel format
- 3 months of analyst support
TABLE OF CONTENTS
1 INTRODUCTION
- 1.1 Study Assumptions and Market Definition
- 1.2 Scope of the Study
2 RESEARCH METHODOLOGY
3 EXECUTIVE SUMMARY
4 MARKET LANDSCAPE
- 4.1 Market Overview
- 4.2 Market Drivers
- 4.2.1 Portability and rapid deployment
- 4.2.2 Edge/5G build-outs accelerate micro-sites
- 4.2.3 Data-center capacity shortages in Tier-1 hubs
- 4.2.4 Energy-efficient prefabrication lowers TCO
- 4.2.5 SMR-powered micro-grids enable off-grid DCs
- 4.2.6 Crypto-to-AI site conversions unlock stranded power
- 4.3 Market Restraints
- 4.3.1 Limited rack and compute density vs hyperscale needs
- 4.3.2 Integration complexity with legacy DC estates
- 4.3.3 ISO-container supply-chain bottlenecks
- 4.3.4 Liquid-cooling retrofits raise CAPEX
- 4.4 Supply-Chain Analysis
- 4.5 Regulatory Landscape
- 4.6 Technological Outlook
- 4.7 Porter's Five Forces
- 4.7.1 Bargaining Power of Suppliers
- 4.7.2 Bargaining Power of Buyers
- 4.7.3 Threat of New Entrants
- 4.7.4 Threat of Substitutes
- 4.7.5 Intensity of Rivalry
- 4.8 Assesment of Macroeconomic Factors on the Market
5 MARKET SIZE AND GROWTH FORECASTS (VALUE)
- 5.1 By Ownership Type
- 5.1.1 Purchase
- 5.1.2 Lease / White-Space-as-a-Service
- 5.2 By Container Type
- 5.2.1 ISO 20-ft
- 5.2.2 ISO 40-ft
- 5.2.3 Customized/All-in-One Skids
- 5.3 By Deployment Location
- 5.3.1 Core / Campus
- 5.3.2 Edge / Micro
- 5.3.3 Remote / Harsh-Environment
- 5.4 By End-User Industry
- 5.4.1 IT and Telecommunications
- 5.4.2 BFSI
- 5.4.3 Government and Defense
- 5.4.4 Healthcare
- 5.4.5 Education
- 5.4.6 Others
- 5.5 By Geography
- 5.5.1 North America
- 5.5.1.1 United States
- 5.5.1.2 Canada
- 5.5.1.3 Mexico
- 5.5.2 South America
- 5.5.2.1 Brazil
- 5.5.2.2 Argentina
- 5.5.2.3 Rest of South America
- 5.5.3 Europe
- 5.5.3.1 Germany
- 5.5.3.2 United Kingdom
- 5.5.3.3 France
- 5.5.3.4 Netherlands
- 5.5.3.5 Rest of Europe
- 5.5.4 Asia-Pacific
- 5.5.4.1 China
- 5.5.4.2 Japan
- 5.5.4.3 India
- 5.5.4.4 South Korea
- 5.5.4.5 Australia and New Zealand
- 5.5.4.6 Rest of Asia-Pacific
- 5.5.5 Middle East and Africa
- 5.5.5.1 Middle East
- 5.5.5.1.1 United Arab Emirates
- 5.5.5.1.2 Saudi Arabia
- 5.5.5.1.3 Turkey
- 5.5.5.1.4 Rest of Middle East
- 5.5.5.2 Africa
- 5.5.5.2.1 South Africa
- 5.5.5.2.2 Egypt
- 5.5.5.2.3 Nigeria
- 5.5.5.2.4 Rest of Africa
- 5.5.1 North America
6 COMPETITIVE LANDSCAPE
- 6.1 Market Concentration
- 6.2 Strategic Moves
- 6.3 Market Share Analysis
- 6.4 Company Profiles (includes Global level Overview, Market level overview, Core Segments, Financials as available, Strategic Information, Market Rank/Share for key companies, Products and Services, and Recent Developments)
- 6.4.1 Vertiv
- 6.4.2 Schneider Electric
- 6.4.3 Huawei Technologies
- 6.4.4 Dell Technologies
- 6.4.5 Hewlett Packard Enterprise
- 6.4.6 IBM Corporation
- 6.4.7 Cisco Systems
- 6.4.8 Rittal GmbH and Co. KG
- 6.4.9 Delta Electronics
- 6.4.10 Eaton Corporation
- 6.4.11 Johnson Controls
- 6.4.12 PCX Corporation
- 6.4.13 BMarko Structures
- 6.4.14 Baselayer Technology
- 6.4.15 Flexenclosure (Xerxes)
- 6.4.16 Cirrascale Cloud Services
- 6.4.17 ZTE Corporation
- 6.4.18 AST Modular (subs. of Schneider)
- 6.4.19 Cannon Technologies
- 6.4.20 EdgeMicro / EDJX
- 6.4.21 Compass Datacenters
- 6.4.22 EdgeConneX
- 6.4.23 Vertiv (Emerson Network Power legacy)
- 6.4.24 Stulz GmbH
7 MARKET OPPORTUNITIES AND FUTURE OUTLOOK
- 7.1 White-space and Unmet-Need Assessment
 2025年全球人工智慧資料中心市場報告
 容器化資料中心市場-全球產業規模、佔有率、趨勢、機會和預測(按容器類型、企業類型、產業、地區和競爭格局分類,2020-2030 年預測)
 貨櫃型資料中心市場:按解決方案組件、貨櫃類型、冷卻技術、機架數量、企業規模和最終用戶分類 - 全球預測(2025-2032 年)2025年全球貨櫃型資料中心市場報告
 2025 年至 2033 年貨櫃資料中心市場報告(按貨櫃類型、組織規模、應用、最終用途產業和地區分類)全球貨櫃型資料中心市場:2034 年的機會與策略
 貨櫃型資料中心市場分析及2034年預測:類型、產品、服務、技術、組件、應用、結構、部署、最終用戶、模組
 貨櫃型資料中心市場規模、佔有率、成長分析(按貨櫃類型、部署規模、應用、最終用途和地區)- 產業預測(2025 年至 2032 年)
 全球貨櫃資料中心市場研究報告 - 產業分析、規模、佔有率、成長、趨勢及 2025 年至 2033 年預測
 北美貨櫃型資料中心:市場佔有率分析、產業趨勢和成長預測(2025-2030 年)