


 |
市場調查報告書
商品編碼
1851105
超大規模資料中心:市場佔有率分析、產業趨勢、統計數據和成長預測(2025-2030 年)Hyperscale Datacenter - Market Share Analysis, Industry Trends & Statistics, Growth Forecasts (2025 - 2030) |
||||||
※ 本網頁內容可能與最新版本有所差異。詳細情況請與我們聯繫。
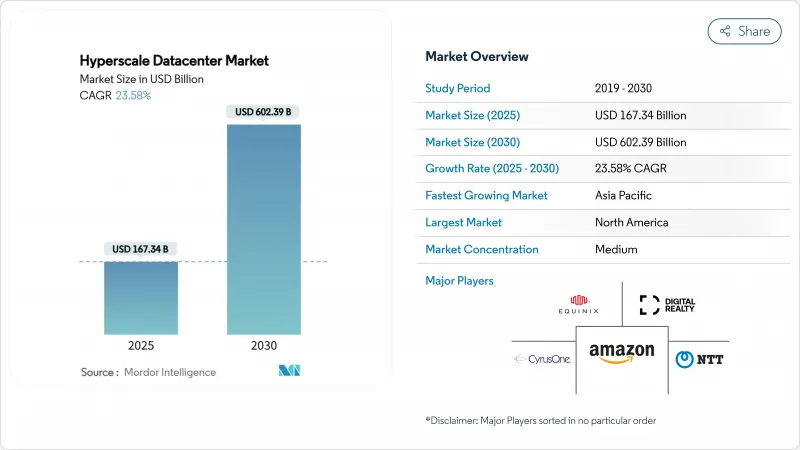
預計到 2025 年,超大規模資料中心市場規模將達到 1,673.4 億美元,到 2030 年將達到 6,023.9 億美元,年複合成長率為 23.58%。
規模經濟、人工智慧驅動的硬體需求以及主權雲端監管正在重塑資料中心的設計,GPU機架的功率密度通常超過50kW。歐洲和亞太地區,加上主要金融科技中心即時支付的強制性要求,每年新增產能超過3GW。業者正從風冷轉向晶片級液冷,荷蘭和新加坡已引入監管性熱稅,促使企業更加重視碳排放的位置。在矽晶圓短缺和公用設施前置作業時間延長的情況下,戰略性土地儲備和多年期GPU供應合約正成為至關重要的競爭優勢。
全球超大規模資料中心市場趨勢與洞察
在美國和中國,需要50kW以上機架的以GPU為中心的AI/ML工作負載正在爆炸性成長。
人工智慧訓練叢集正在重塑資料中心的佈局,Google已經部署了功率高達 1 兆瓦、電壓高達 ±400 伏特直流的機架。 xAI 在孟菲斯的 20 萬 GPU 園區凸顯了這項變革的規模,迫使資料中心團隊重新設計機架周圍的配電、網路架構和液冷迴路,這些機架的能耗比傳統伺服器消費量160%。得益於完善的人工智慧資金籌措生態系統和靈活的權限管理框架,美國和中國在部署方面佔據主導地位。
歐洲超大規模雲端供應商的自主雲端部署
隨著歐洲資料居住法強制要求「僅限歐盟」的營運控制,AWS計劃到2040年向德國主權雲投資78億歐元(約85億美元)。德國電信的「8ra」計畫旨在部署1萬個邊緣節點,顯示德國本土企業希望減少對美國雲端平台的依賴。除了合規性之外,主權雲端模式還將促進本土人工智慧研發,並刺激本地硬體供應鏈的發展。法國Orange和凱捷的Bleu平台已經展現出這種模式的良好勢頭,預示著中東和亞太部分地區也將出現類似的需求。
美國西部和西班牙的蒸發冷卻用水限制
加州監管機構目前強制要求使用冷媒系統以減少用水量,將使資本支出增加高達20%。在亞利桑那州,據報道一座1兆瓦的設施每年耗水量達675萬加侖,資料中心與農業和住宅建築一樣,都受到了嚴格的審查。西班牙的乾旱也引發了類似的監管措施,促使開發人員轉向沿海地塊(配備海水淡化管道)或內陸園區(採用閉迴路液冷系統)。
細分市場分析
在亞馬遜等資本密集型項目(例如其1,500億美元的多年發展藍圖)的推動下,到2024年,自建業者將佔據超大規模資料中心市場70.2%的佔有率。對設計的掌控使得他們能夠客製化動力傳動系統和專為人工智慧叢集量身打造的獨特網路架構。然而,超大規模託管預計將以25.6%的複合年成長率成長,隨著市場速度在新興地區超越資產管理,所有權差距將會縮小。
託管服務供應商透過預先鎖定土地和電力,並提供前置作業時間12個月交付的模組化機房,加快了雲端參與企業的運轉率。 Vantage公司92億美元的融資支持了這一擴張,顯示私募股權對與長期超大規模合約掛鉤的經常性收入有著濃厚的興趣。隨著越來越多的自主雲端交易指定本地合作夥伴,託管在新興市場變得越來越重要。
到2024年,以IT基礎設施採購量計算,該細分市場將佔超大規模資料中心市場規模的48%,其中GPU、DDR5記憶體和NVMe儲存將推動市場佔有率的成長。諸如30MW鋰離子電池組之類的電力備援系統現已納入標準材料清單。軟體和服務正以27.1%的複合年成長率成長,反映出市場對人工智慧主導的資源編配的需求,這種編排方式能夠提供更高的電力和機架密度。
隨著多租戶人工智慧工作負載風險的增加,零信任框架和整合安全堆疊將超越基準監控工具。透過最大限度地利用現有資源,工作負載自動化部署將在預測期內延緩 8-10 GW 的新專案。
區域分析
到2024年,北美將佔據超大規模資料中心市場43.3%的佔有率,成為收入最高的地區。光是維吉尼亞的「資料中心陣列」去年就滿足了2吉瓦的新增變電站需求,但目前電網擁塞正將部分需求導向俄亥俄州、賓州和北卡羅來納州,亞馬遜正在這些州投資300億美元建設多個人工智慧園區。公用事業互聯的建設週期可能長達七年,促使各地區採取區域多元化策略,並簽訂可再生能源購電協議以對沖碳排放風險。
亞太地區是明顯的成長引擎,預計複合年成長率將達到29.1%。日本是投資中心,這主要得益於亞馬遜雲端服務(AWS)2.26兆日圓(約151億美元)的擴張,同時Oracle和NTT也在增加產能,以支援日本的人工智慧和遊戲工作負載。在印度,稅收優惠和數位公共產品框架正在推動一條從孟買到海得拉巴的全國性超大規模資料中心走廊的建設。儘管新加坡曾一度暫停核准,但目前已根據其永續發展評分卡恢復核准,從而確保了一條新的四級資料中心通道,以服務於東協的金融科技資金流動。
在主權指令和北歐可再生能源的推動下,歐洲正享受穩定的資本流入。布魯克菲爾德在瑞典投資100億美元的園區和谷歌在挪威投資6億歐元(約6.5億美元)的設施表明,涼爽的氣候和綠色電網如何將PUE值控制在1.15以下。荷蘭的熱稅和都柏林周邊地區的電力上限正在規範電力供應,並促使營運商將業務轉移到歐洲的二線城市。未來的成長將取決於如何在「數位十年」的雲端運算普及目標與環境限制之間取得平衡。
其他福利:
- Excel格式的市場預測(ME)表
- 3個月的分析師支持
目錄
第1章 引言
- 研究假設和市場定義
- 調查範圍
第2章調查方法
第3章執行摘要
第4章 市場情勢
- 市場概覽
- 市場促進因素
- 美國和中國需要50kW以上機架的以GPU為中心的AI/ML工作負載的爆炸性成長正在推動市場發展。
- 超大規模雲端供應商的「主權雲端」部署推動歐洲市場發展
- 金融科技即時支付指令加速新加坡和印度的四級市場需求,推動市場發展
- 5G邊緣核心整合推動北歐和大洋洲區域樞紐需求
- 市場限制
- 美國西部和西班牙蒸發冷卻用水法規
- GPU供應鏈瓶頸阻礙了機架級密度的提升。
- 荷蘭、新加坡和德國不斷上漲的熱碳排放稅阻礙了市場發展。
- 價值鏈分析
- 監理與合規環境
- 技術視角(液冷、晶片級直接散熱、模組化設計)
- 評估市場宏觀經濟趨勢
- 波特五力分析
- 供應商的議價能力
- 買方的議價能力
- 新進入者的威脅
- 替代品的威脅
- 競爭對手之間的競爭
第5章 市場規模與成長預測數據
- 依資料中心類型
- 企業/超大規模自建
- 超大規模託管
- 按組件
- IT基礎設施
- 電力基礎設施
- 機械和冷卻基礎設施
- 軟體和服務
- 按等級標準
- 三級
- 四級
- 按最終用戶行業分類
- 雲端服務供應商
- BFSI
- 社群媒體和數位內容
- 醫療保健和生命科學
- 政府/公共部門
- 其他終端用戶產業
- 按地區
- 北美洲
- 美國
- 加拿大
- 墨西哥
- 歐洲
- 英國
- 德國
- 荷蘭
- 法國
- 愛爾蘭
- 其他歐洲地區
- 亞太地區
- 中國
- 印度
- 新加坡
- 日本
- 澳洲
- 印尼
- 亞太其他地區
- 南美洲
- 巴西
- 智利
- 其他南美洲
- 中東
- 阿拉伯聯合大公國
- 沙烏地阿拉伯
- 土耳其
- 其他中東地區
- 非洲
- 南非
- 奈及利亞
- 其他非洲地區
- 北美洲
第6章 競爭情勢
- 市場集中度
- 策略趨勢
- 市佔率分析
- 公司簡介
- Digital Realty Trust, Inc.
- Equinix, Inc.
- CyrusOne Inc.
- NTT Ltd.
- Quality Technology Services(QTS)
- Vantage Data Centers LLC
- Amazon Web Services, Inc.
- Microsoft Corporation
- Alphabet Inc.(Google)
- Meta Platforms Inc.
- Alibaba Group Holding Ltd.
- Tencent Holdings Ltd.
- Baidu, Inc.
- Oracle Corporation
- International Business Machines Corp.
- Switch, Inc.
- STACK Infrastructure
- Flexential Corp.
- Iron Mountain Data Centers
- OVHcloud
第7章 市場機會與未來展望
The hyperscale data center market is valued at USD 167.34 billion in 2025 and is forecast to reach USD 602.39 billion by 2030, reflecting a robust 23.58% CAGR.
Scale economics, AI-centric hardware demand, and sovereign-cloud regulations are re-shaping facility design, with GPU racks routinely exceeding 50 kW power density. Accelerated regional build-outs in Europe and Asia-Pacific, combined with real-time payment mandates in key fintech hubs, sustain a construction pipeline that exceeds 3 GW of new capacity annually. Operators are pivoting from air to direct-to-chip liquid cooling, while regulatory heat taxes in the Netherlands and Singapore heighten focus on carbon-aware site selection. Strategic land banking and multi-year GPU supply agreements have become decisive competitive levers as silicon shortages and long utility lead times converge.
Global Hyperscale Datacenter Market Trends and Insights
Exploding GPU-centric AI/ML workloads requiring more than 50 kW racks in the U.S. & China
AI training clusters are re-engineering facility layouts, with Google already fielding 1 MW racks that draw +/- 400 VDC power. Silicon scarcity has prompted operators to lock in multi-year GPU contracts, elevating build-times and capital intensity. xAI's 200,000-GPU campus in Memphis highlights the scale of transformation, compelling data center teams to redesign power distribution, network fabrics, and liquid cooling loops around racks that consume 160% more energy than legacy servers. The United States and China dominate deployments thanks to supportive AI funding ecosystems and agile permitting frameworks.
Hyperscale cloud providers' sovereign-cloud roll-outs in Europe
European data-residency laws require "EU-only" operational control, leading AWS to invest EUR 7.8 billion (USD 8.5 billion) in a German sovereign cloud by 2040. Deutsche Telekom's 8ra initiative-targeting 10,000 edge nodes-signals local incumbents' intent to narrow dependency on U.S. cloud stacks. Sovereign models extend beyond compliance, fostering indigenous AI R&D and catalyzing regional hardware supply chains. Momentum is already visible in France through Orange and Capgemini's Bleu platform, foreshadowing similar requirements in the Middle East and parts of APAC.
Water-usage restrictions for evaporative cooling in Western U.S. & Spain
California's regulators now mandate refrigerant-based systems that cut water draw, inflating capex by up to 20%. Arizona reports a 1 MW facility can consume 6.75 million gallons annually, placing data centers under scrutiny alongside agriculture and housing. Spanish droughts trigger similar curbs, steering developers toward coastal plots with desalination pipelines or inland campuses using closed-loop liquid cooling.
Other drivers and restraints analyzed in the detailed report include:
- FinTech real-time payment mandates accelerating Tier IV demand in Singapore & India
- 5G edge-core consolidation creating regional hub requirements in Nordics & Oceania
- GPU supply-chain bottlenecks limiting rack-level density expansion
For complete list of drivers and restraints, kindly check the Table Of Contents.
Segment Analysis
Self-build operators accounted for 70.2% of hyperscale data center market share in 2024, riding capital-intensive programs such as Amazon's USD 150 billion multiyear roadmap. Control over design enables bespoke power trains and proprietary network fabrics tuned for AI clusters. Yet hyperscale colocation is forecast to deliver a 25.6% CAGR, narrowing the ownership gap as speed-to-market trumps asset control in new regions.
Colocation providers secure land and power in advance to offer modular suites on 12-month lead-times, compressing occupancy ramp-up for cloud entrants. Vantage's USD 9.2 billion equity raise underpins this expansion, indicating private-equity appetite for recurring revenue tied to long-term hyperscale contracts. As more sovereign-cloud deals stipulate local partners, colocation gains strategic relevance across emerging markets.
The segment generated 48% of the hyperscale data center market size from IT Infrastructure purchases in 2024, with GPUs, DDR5 memory, and NVMe storage driving wallet share. Electrical back-up systems such as 30 MW lithium-ion farms now feature in standard bill-of-materials. Software & Services is rising at 27.1% CAGR, reflecting demand for AI-driven resource orchestration that yields power and rack-density gains.
Security stacks integrated with zero-trust frameworks outpace baseline monitoring tools as multi-tenant AI workloads elevate risk profiles. Over the forecast period, automated workload placement is projected to defer 8-10 GW of new build by maximizing existing utilization-underscoring a shift from brute-force expansion to intelligent capacity management.
The Hyperscale Data Center Market is Segmented by Data Center Type (Enterprise / Hyperscale Self-Build, Hyperscale Colocation), Component (IT Infrastructure, Electrical Infrastructure, and More), Tier Standard (Tier III, Tier IV), End-User Industry (Cloud Service Providers, BFSI, Social Media and Digital Content, and More), and Geography. The Market Forecasts are Provided in Terms of Value (USD).
Geography Analysis
North America generated the largest regional revenue, accounting for 43.3% of the hyperscale data center market in 2024. Virginia's "Data Center Alley" alone cleared 2 GW of new substation requests last year, yet grid congestion now steers demand to Ohio, Pennsylvania, and North Carolina where Amazon is injecting USD 30 billion across multiple AI-ready campuses. Utility interconnection timelines stretching up to seven years are prompting inter-regional diversity strategies and renewable power purchase agreements that hedge carbon exposure.
Asia-Pacific is the clear growth engine with a projected 29.1% CAGR. Japan anchors investment on the back of AWS's JPY 2.26 trillion (USD 15.1 billion) expansion, while Oracle and NTT add capacity to meet domestic AI and gaming workloads. India's tax incentives and digital-public-goods framework propel nationwide hyperscale corridors from Mumbai to Hyderabad. Singapore, despite a temporary moratorium, re-opened its approvals under a sustainability scorecard, unlocking fresh Tier IV pipeline to service ASEAN fintech flows.
Europe enjoys steady inflows, bolstered by sovereignty mandates and Nordic renewables. Brookfield's USD 10 billion Swedish campus and Google's EUR 600 million (USD 650 million) Norwegian build illustrate how cool climates and green grids cut operational PUE below 1.15. Heat taxes in the Netherlands and power caps around Dublin create supply discipline, nudging operators toward continental tier-two cities. Future growth hinges on harmonizing environmental constraints with the Digital Decade's cloud adoption targets.
- Digital Realty Trust, Inc.
- Equinix, Inc.
- CyrusOne Inc.
- NTT Ltd.
- Quality Technology Services (QTS)
- Vantage Data Centers LLC
- Amazon Web Services, Inc.
- Microsoft Corporation
- Alphabet Inc. (Google)
- Meta Platforms Inc.
- Alibaba Group Holding Ltd.
- Tencent Holdings Ltd.
- Baidu, Inc.
- Oracle Corporation
- International Business Machines Corp.
- Switch, Inc.
- STACK Infrastructure
- Flexential Corp.
- Iron Mountain Data Centers
- OVHcloud
Additional Benefits:
- The market estimate (ME) sheet in Excel format
- 3 months of analyst support
TABLE OF CONTENTS
1 INTRODUCTION
- 1.1 Study Assumptions and Market Definition
- 1.2 Scope of the Study
2 RESEARCH METHODOLOGY
3 EXECUTIVE SUMMARY
4 MARKET LANDSCAPE
- 4.1 Market Overview
- 4.2 Market Drivers
- 4.2.1 Exploding GPU-centric AI/ML Workloads Requiring more than 50 kW Racks in the U.S. and China drives the market
- 4.2.2 Hyperscale Cloud Providers' 'Sovereign Cloud' Roll-outs in Europe Drives the Market
- 4.2.3 FinTech Real-Time Payment Mandates Accelerating Tier IV Demand in Singapore and India Drives the Market
- 4.2.4 5G Edge-Core Consolidation Creating Regional Hub Requirements in Nordics and Oceania Drives the Market
- 4.3 Market Restraints
- 4.3.1 Water-Usage Restrictions for Evaporative Cooling in Western U.S. and Spain
- 4.3.2 GPU Supply Chain Bottlenecks Limiting Rack-Level Density Expansion
- 4.3.3 Rising Heat-Tax and Carbon Levies in Netherlands, Singapore and Germany Hinders the Market
- 4.4 Value-Chain Analysis
- 4.5 Regulatory and Compliance Outlook
- 4.6 Technological Outlook (Liquid Cooling, Direct-to-Chip, Modular Builds)
- 4.7 Assessment of Macro Economic Trends on the Market
- 4.8 Porter's Five Forces Analysis
- 4.8.1 Bargaining Power of Suppliers
- 4.8.2 Bargaining Power of Buyers
- 4.8.3 Threat of New Entrants
- 4.8.4 Threat of Substitutes
- 4.8.5 Competitive Rivalry
5 MARKET SIZE AND GROWTH FORECASTS (VALUES)
- 5.1 By Data Center Type
- 5.1.1 Enterprise / Hyperscale Self-build
- 5.1.2 Hyperscale Colocation
- 5.2 By Component
- 5.2.1 IT Infrastructure
- 5.2.2 Electrical Infrastructure
- 5.2.3 Mechanical and Cooling Infrastructure
- 5.2.4 Software and Services
- 5.3 By Tier Standard
- 5.3.1 Tier III
- 5.3.2 Tier IV
- 5.4 By End-user Industry
- 5.4.1 Cloud Service Providers
- 5.4.2 BFSI
- 5.4.3 Social Media and Digital Content
- 5.4.4 Healthcare and Life Sciences
- 5.4.5 Government and Public Sector
- 5.4.6 Other End-user Industries
- 5.5 By Geography
- 5.5.1 North America
- 5.5.1.1 United States
- 5.5.1.2 Canada
- 5.5.1.3 Mexico
- 5.5.2 Europe
- 5.5.2.1 United Kingdom
- 5.5.2.2 Germany
- 5.5.2.3 Netherlands
- 5.5.2.4 France
- 5.5.2.5 Ireland
- 5.5.2.6 Rest of Europe
- 5.5.3 Asia-Pacific
- 5.5.3.1 China
- 5.5.3.2 India
- 5.5.3.3 Singapore
- 5.5.3.4 Japan
- 5.5.3.5 Australia
- 5.5.3.6 Indonesia
- 5.5.3.7 Rest of Asia-Pacific
- 5.5.4 South America
- 5.5.4.1 Brazil
- 5.5.4.2 Chile
- 5.5.4.3 Rest of South America
- 5.5.5 Middle East
- 5.5.5.1 United Arab Emirates
- 5.5.5.2 Saudi Arabia
- 5.5.5.3 Turkey
- 5.5.5.4 Rest of Middle East
- 5.5.6 Africa
- 5.5.6.1 South Africa
- 5.5.6.2 Nigeria
- 5.5.6.3 Rest of Africa
- 5.5.1 North America
6 COMPETITIVE LANDSCAPE
- 6.1 Market Concentration
- 6.2 Strategic Moves
- 6.3 Market Share Analysis
- 6.4 Company Profiles {(includes Global level Overview, Market level overview, Core Segments, Financials as available, Strategic Information, Market Rank/Share for key companies, Products and Services, and Recent Developments)}
- 6.4.1 Digital Realty Trust, Inc.
- 6.4.2 Equinix, Inc.
- 6.4.3 CyrusOne Inc.
- 6.4.4 NTT Ltd.
- 6.4.5 Quality Technology Services (QTS)
- 6.4.6 Vantage Data Centers LLC
- 6.4.7 Amazon Web Services, Inc.
- 6.4.8 Microsoft Corporation
- 6.4.9 Alphabet Inc. (Google)
- 6.4.10 Meta Platforms Inc.
- 6.4.11 Alibaba Group Holding Ltd.
- 6.4.12 Tencent Holdings Ltd.
- 6.4.13 Baidu, Inc.
- 6.4.14 Oracle Corporation
- 6.4.15 International Business Machines Corp.
- 6.4.16 Switch, Inc.
- 6.4.17 STACK Infrastructure
- 6.4.18 Flexential Corp.
- 6.4.19 Iron Mountain Data Centers
- 6.4.20 OVHcloud
7 MARKET OPPORTUNITIES AND FUTURE OUTLOOK
- 7.1 White-space and Unmet-Need Assessment
 超級資料中心市場分析與預測(至2035年):依類型、產品、服務、技術、元件、應用、部署方式、最終使用者、功能及安裝方式分類
 超大規模資料中心業者資料中心超大規模資料中心業者資料中心:市場資料概覽(2026 年第二季)
 超大規模資料中心市場:按組件、電力容量、冷卻解決方案、所有權、部署模式、應用領域和最終用戶產業分類-2026-2032年全球市場預測超大規模資料中心市場分析及預測(至2035年):按類型、產品類型、服務、技術、元件、應用、部署模式、最終用戶和解決方案分類
 2026年全球超大規模資料中心市場報告超級資料中心市場:按組件、電力容量、冷卻技術、能源來源、最終用戶和部署模式分類-2026-2032年全球預測
 超級資料中心市場規模、佔有率和成長分析:按資料中心類型、服務類型、部署模式、技術和地區分類-2026-2033年產業預測
 2026-2030年全球超大規模資料中心市場
 超大規模資料中心市場規模、佔有率、成長及全球產業分析:依類型、應用和地區劃分的洞察與預測(2026-2034 年)