


 |
市場調查報告書
商品編碼
1850969
光纖電纜:市場佔有率分析、行業趨勢、統計數據和成長預測(2025-2030 年)Fiber Optic Cable - Market Share Analysis, Industry Trends & Statistics, Growth Forecasts (2025 - 2030) |
||||||
※ 本網頁內容可能與最新版本有所差異。詳細情況請與我們聯繫。
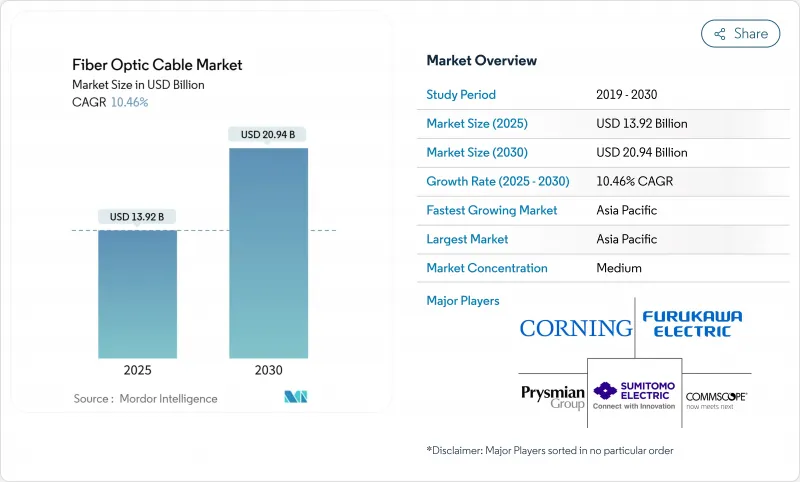
預計到 2025 年,光纖電纜市場規模將達到 139.2 億美元,到 2030 年將達到 209.4 億美元,在預測期(2025-2030 年)內,複合年成長率將達到 10.46%。
隨著人工智慧工作負載對超低延遲的需求不斷成長,5G網路密集化推動了光纖深度覆蓋架構的發展,以及超大規模資料中心營運商獲取前所未有的光纜容量以繞過傳統營運商,光纖市場成長速度將加快。地緣政治緊張局勢也促使科技巨頭拓展海底線路,即使在成熟經濟體中,光纖市場規模也不斷擴大。在供應方面,垂直整合、區域製造指令以及對多芯和中空芯技術的投資正在重塑競爭動態,並將光纖定位為陸地和海底連接的關鍵骨幹。日益嚴格的永續性目標進一步推動了從銅纜到低碳玻璃的轉變,預示著光纖市場將持續擴張。
全球光纖電纜市場趨勢與洞察
高速網路的普及和全球數據流量的快速成長
頻寬需求正迅速成長,營運商如今將光纖視為唯一能夠滿足 8K 視訊、雲端遊戲和即時協作等餘量的基礎設施。全球 IP 流量正以每年 22% 的速度成長,其中串流媒體和雲端服務佔用了 82% 的流量。日本研究人員已證明,使用 1505 個波長,標準光纖即可實現 402 Tb/s 的傳輸速度,這證明如今的電纜投資足以支撐未來數十年的逐步升級,而無需進行大規模更換。此類突破使通訊業者更有信心將資金投入高密度光纖走廊建設,而不是用於零散的銅纜升級。因此,隨著已開發地區和新興地區都朝著Gigabit級接取目標邁進,光纖電纜市場正經歷更快的訂單週期、更長的合約期限和更廣泛的地理部署。
加速5G部署和光纖到府(FTTx)部署
每個 5G小型基地台都需要專用光纖回程傳輸,所需的線纜數量是傳統 4G 基地台的三到五倍。 AT&T 將其到 2030 年部署 6,000 萬個光纖站點的目標規模擴大到 2,380 萬個站點,這表明無線接入密度的增加正在重振光纖電纜市場。邊緣雲端架構透過要求基地台和微型資料中心之間建立低延遲鏈路,進一步推動了這一趨勢,並將光纖延伸到更遠的郊區網路。通訊業者報告稱,當對稱光纖為其服務提供支援時,5G 用戶的每用戶收入提高了 15% 至 25%,這促使營運商在未來幾年內持續採購高密度帶狀光纜和鎧裝光纜。隨著通訊業者競相鋪設新線路,競爭日益激烈,這也印證了光纖作為超低延遲行動服務關鍵基礎的作用。
高昂的土木工程成本和複雜的土地權利
在主要城市,建築勞動力短缺和監管瓶頸導致地下電纜安裝成本飆升至每英尺24美元,令資本預算捉襟見肘,部署速度也隨之放緩。場地核准可能需要6到18個月,這不僅會延遲服務開通,還會增加過渡期資金籌措成本。據估計,每年約有31,500名熟練技術人員短缺,推高了薪資水準;而環境評估則會使計劃總成本增加5萬至20萬美元。這些摩擦迫使營運商優先考慮高密度走廊而非普遍建設,從而減緩了光纖電纜市場中對成本敏感區域的潛在成長。
細分市場分析
2024年,鎧裝光纖電纜產品佔光纖電纜市場38.0%的佔有率,顯示營運商在電纜穿越崎嶇地形或公共道路時更傾向於機械強度高的設計。然而,帶狀光纖電纜預計將以11.4%的複合年成長率佔據主導地位,這主要得益於大規模熔接技術的普及,該技術可將現場施工時間縮短高達80%。帶狀光纖電纜的無凝膠版本還能減少清理工作,進而加快超大規模資料中心的建置速度。預計到2030年,帶狀光纖電纜的市場規模將成長一倍以上。
供應商不斷改進採用波紋鋼板和防水膠帶的鎧裝結構,主要針對海底導體和易受挖掘損壞的都市區導體。相反,在安全園區環境中,非鎧裝或分支光纜則更受歡迎,因為在這些環境中,靈活性和小彎曲半徑比抗壓性更為重要。由於安裝人工成本佔計劃成本的一半以上,網路規劃人員正轉向高密度帶狀光纜或微導管解決方案,以減少熔接次數,從而進一步提升帶狀光纜在光纖電纜市場的佔有率。
到2024年,單模裸線將佔據光纖電纜市場63.2%的佔有率,是城域網路、遠距和海底光纜等數百公里鏈路的關鍵組成部分。然而,到2030年,多模光纖的複合年成長率將達到13.2%,這主要得益於機架頂部資料中心連接(傳輸距離以100-150公尺為主)以及具成本效益的VCSEL收發器。中空光纖原型可望延遲降低30%,吸引演算法交易平台和需要飛秒同步的科學研究站點。
隨著雲端營運商園區拓樸結構的扁平化,OM5級光纖搭配400G-SR8收發器可實現機架間800Gbps的傳輸速度,進而兼顧成本與效能目標。同時,單模光纖的創新正朝著超低損耗和多芯格式發展,無需中繼器即可跨越海洋盆地,擴大了高階海底光纜市場的佔有率。因此,模數選擇取決於傳輸距離和頻寬的經濟性。單模光纖繼續主導骨幹網路路由,而多模光纖則在傳輸距離有限的超大規模機房中佔據了一定的市場佔有率。
光纖電纜市場報告按電纜類型(鎧裝電纜、非鎧裝電纜、帶狀電纜、其他)、光纖模式(單模光纖、多模光纖、塑膠光纖)、安裝類型(架空/架空、地下/埋設、其他)、最終用戶產業(電信、電力光纖)、安裝類型(架空/架空、地下/埋設、其他)、最終用戶產業(通訊、電力公用事業和智慧電網、國防公用事業和航太、工業自動化和其他航空區域進行自動化。
區域分析
到2030年,亞太地區將佔全球收入的58.7%,並維持12.6%的最高複合年成長率。這反映了中國「一帶一路」計劃下政府支持的計劃,以及印度有利於國內登陸站的新規。日本實驗室不斷刷新光傳輸量紀錄,增強了研發實力,鞏固了該地區的領先地位。韓國和日本的高密度5G網路將增加每平方公里的光纖數量,東南亞財團正在擴展海底叢集,使新加坡成為事實上的區域樞紐。然而,南海的政治緊張局勢增加了光纜被切斷的風險,並促使企業採取冗餘路由策略,從而推動了光纖電纜市場資本支出的成長。
北美作為全球第二大區域,正從待開發區轉型為現代化改造。耗資424.5億美元的BEAD計畫正在推動區域網路建設,而AT&T將消費者光纖資產出售給Lumen等併購案例正在再形成競爭格局。國內內容強制性要求將推動北卡羅來納州和南卡羅來納州的容量擴張,使網路供應與人工智慧驅動的頻寬需求成長相匹配。歐洲將在波羅的海事件後加強海底網路韌性,並投資建造多登陸點架構以保護數位主權。
中東、非洲和南美洲正在崛起,成為下一波熱點地區。海灣地區的通訊業者正利用其地理優勢,建造跨洲光纜,其中「2Africa環線」將新增4.5萬公里的容量,從而降低非洲各地的延遲和批發價格。地中海地區的企業,例如Medusa,正在將其業務拓展至北非,而巴西則在拉丁美洲引領光纖部署,並推出了其雲端區域。儘管資金籌措、監管透明度和技術純熟勞工供應仍然是挑戰,但行動數據普及率的不斷提高為光纖電纜市場帶來了令人矚目的長期發展前景。
其他福利:
- Excel格式的市場預測(ME)表
- 3個月的分析師支持
目錄
第1章 引言
- 研究假設和市場定義
- 調查範圍
第2章調查方法
第3章執行摘要
第4章 市場情勢
- 市場概覽
- 市場促進因素
- 高速網路的普及和全球數據流量的快速成長
- 加速 5G 部署和光纖到府 (FTTx) 部署
- 對超大規模資料中心互連的需求日益成長
- 政府支持的農村寬頻和數位包容計劃
- 海底航線多元化助力地緣政治韌性
- 永續性措施以低碳玻璃纖維取代銅
- 市場限制
- 高昂的土木工程成本和複雜的道路用地
- 原物料價格波動和氦氣供應限制
- 海底航線環境許可審核延誤
- 在飽和的大都會市場,電信業者的資本支出停滯不前。
- 價值鏈/供應鏈分析
- 監管環境
- 技術展望
- 多芯和中空芯光纖藍圖
- 整合光電和矽光電收發器
- 定價分析
- 波特五力分析
- 新進入者的威脅
- 買方的議價能力
- 供應商的議價能力
- 替代品的威脅
- 競爭對手之間的競爭
- 投資分析
- 新冠疫情影響及恢復分析
第5章 市場規模與成長預測
- 按電纜類型
- 鎧裝電纜
- 非鎧裝電纜
- 扁平電纜
- 其他
- 透過光纖模式
- 單模光纖
- 多模光纖
- 塑膠光纖
- 按安裝類型
- 空中/頭頂
- 地下/埋藏
- 潛水艇/水下
- 室內/入口電纜
- 按最終用戶行業分類
- 通訊
- 資料中心和雲端服務供應商
- 電力公司和智慧電網
- 國防/航太
- 工業自動化與控制
- 醫療保健和醫學
- 石油、天然氣和海上作業
- 其他
- 按地區
- 北美洲
- 美國
- 加拿大
- 墨西哥
- 南美洲
- 巴西
- 阿根廷
- 其他南美洲
- 歐洲
- 德國
- 英國
- 法國
- 義大利
- 西班牙
- 其他歐洲地區
- 亞太地區
- 中國
- 日本
- 印度
- 韓國
- 亞太其他地區
- 中東
- 沙烏地阿拉伯
- 阿拉伯聯合大公國
- 土耳其
- 其他中東地區
- 非洲
- 南非
- 奈及利亞
- 埃及
- 其他非洲地區
- 北美洲
第6章 競爭情勢
- 市場集中度
- 策略趨勢
- 市佔率分析
- 公司簡介
- Prysmian Group
- Corning Inc.
- Sumitomo Electric Industries Ltd.
- Furukawa Electric Co., Ltd.
- CommScope Holding Company Inc.
- Fujikura Ltd.
- Nexans SA
- LS Cable and System Ltd.
- OFS Fitel LLC
- Sterlite Technologies Ltd.
- Hengtong Optic-Electric Co. Ltd.
- Yangtze Optical Fiber and Cable(JOFC)
- ZTT Group
- Proterial Ltd.
- Finolex Cables Ltd.
- Belden Inc.
- General Cable Corp.
- Hexatronic Group AB
- HMN Tech Co., Ltd.
- Taihan Fiberoptics Co., Ltd.
第7章 市場機會與未來展望
The Fiber Optic Cable Market size is estimated at USD 13.92 billion in 2025, and is expected to reach USD 20.94 billion by 2030, at a CAGR of 10.46% during the forecast period (2025-2030).
Growth accelerates as artificial-intelligence workloads demand ultra-low latency, 5G densification pushes fiber-deep architectures, and hyperscale data-center operators reserve unprecedented cable capacity to bypass legacy carriers. Government-funded digital-inclusion programs mandate future-proof infrastructure, while geopolitical tensions prompt tech giants to diversify submarine routes, therefore widening the addressable fiber optic cable market even in mature economies. On the supply side, vertical integration, regional manufacturing mandates, and investments in multi-core and hollow-core technologies reshape competitive dynamics, positioning fiber as the definitive backbone for both terrestrial and subsea connectivity. Intensifying sustainability goals further reinforce the shift from copper to low-carbon glass, signalling a durable expansion trajectory for the fiber optic cable market.
Global Fiber Optic Cable Market Trends and Insights
Increasing Penetration of High-Speed Internet and Global Data-Traffic Surge
Bandwidth demand is rising so quickly that operators now treat fiber as the only infrastructure with adequate headroom for 8K video, cloud gaming, and real-time collaboration. Global IP traffic is expanding at 22% per year, with streaming and cloud services absorbing 82% of the load, a scenario that underscores why the fiber optic cable market continues to accelerate. Researchers in Japan have demonstrated 402 Tb/s transmission across standard fiber using 1,505 wavelengths, proving that today's cable investments will sustain decades of incremental upgrades without wholesale replacement. Such breakthroughs give carriers confidence to allocate capital toward dense fiber corridors rather than incremental copper fixes. Consequently, the fiber optic cable market registers faster order cycles, longer contract horizons, and broader geographic rollout plans as both developed and emerging regions converge on gigabit-class access targets.
Accelerated 5G Roll-Outs and Fiber-Deep FTTx Deployments
Every 5G small-cell demands dedicated fiber backhaul, multiplying cable counts by three to five times relative to legacy 4G sites. AT&T's expansion to 23.8 million fiber locations, with an ambition of 60 million by 2030, illustrates how radio-access densification fuels the fiber optic cable market. Edge-cloud architectures amplify this pull by requiring low-latency links between towers and micro-data centers, thus extending fiber deeper into suburban grids. Operators report 15-25% higher 5G revenue per user when symmetrical fiber underpins the service, a financial lift that catalyzes multi-year procurement of high-density ribbon and armored cables. Competitive intensity escalates as carriers race to light new corridors, confirming fiber's role as the indispensable substrate for ultra-low-latency mobile services.
High Civil-Works Cost and Right-of-Way Complexities
Construction labor shortages and regulatory bottlenecks elevate underground installation expenses to USD 24 per foot in major cities, squeezing capital budgets and tempering rollout speeds. Right-of-way approvals can stretch 6-18 months, delaying service launches and raising interim financing costs. Skilled-technician gaps are estimated at 31,500 annually inflate wages, while environmental surveys add USD 50,000-200,000 to project totals. These frictions compel operators to prioritize high-density corridors over universal builds, thereby slowing addressable growth in cost-sensitive pockets of the fiber optic cable market.
Other drivers and restraints analyzed in the detailed report include:
- Expanding Hyperscale Data-Center Interconnect Demand
- Government-Backed Rural Broadband and Digital-Inclusion Programs
- Price Volatility in Raw Materials and Helium Supply Constraints
For complete list of drivers and restraints, kindly check the Table Of Contents.
Segment Analysis
Armored products represented 38.0% of the fiber optic cable market in 2024, evidencing operator preference for mechanically robust designs whenever cables traverse harsh terrain or public rights-of-way. Ribbon formats, however, are on course to outpace all others with an 11.4% CAGR, owing to mass-fusion splicing that trims field time by as much as 80%. Ribbon's gel-free variants also cut cleanup, enhancing velocity in hyperscale data-center builds. The fiber optic cable market size for ribbon architectures is projected to more than double by 2030 as labor savings outweigh higher per-meter costs.
Suppliers continue refining armored constructions with corrugated steel and water-blocking tapes, targeting submarine lead-ins and urban conduits vulnerable to excavation damage. Conversely, non-armored and breakout cables stay popular inside secured campuses where flexibility and tight bend radii matter more than crush resistance. Because installation labor can account for over half the project bill, network planners lean toward high-count ribbon or micro-duct solutions that slash splice events, further reinforcing ribbon's fast-rising share within the fiber optic cable market.
Single-mode strands held 63.2% of the fiber optic cable market share during 2024, remaining indispensable for metropolitan, long-haul, and submarine links that span hundreds of kilometers. Yet multi-mode is poised for a 13.2% CAGR through 2030, a resurgence propelled by data-center top-of-rack connections where 100-150 m reach and cost-efficient VCSEL transceivers prevail. Hollow-core prototypes promise latency reductions of 30%, attracting algorithmic trading platforms and scientific sites requiring femtosecond-level synchronization.
As cloud operators flatten their campus topologies, OM5-grade fiber coupled with 400G-SR8 transceivers delivers 800 Gbps rack-to-rack, aligning cost and performance targets. Meanwhile, single-mode innovation pivots toward ultra-low-loss and multi-core formats capable of crossing ocean basins without repeaters, expanding the premium subsea slice of the fiber optic cable market size. The modal mix, therefore, hinges on distance-bandwidth economics: single-mode continues its reign in backbone routes, while multi-mode secures a volume foothold inside hyperscale halls where reach envelopes remain modest.
The Fiber Optic Cable Market Report is Segmented by Cable Type (Armored Cable, Non-Armored Cable, Ribbon Cable, and Other), Fiber Mode (Single-Mode Fiber, Multi-Mode Fiber, and Plastic Optical Fiber), Installation Type (Aerial/Overhead, Underground/Buried, and More), End-User Industry (Telecommunication, Power Utilities and Smart Grid, Defense and Aerospace, Industrial Automation and Control, and More), and Geography.
Geography Analysis
Asia Pacific dominates with a 58.7% revenue chunk and the highest 12.6% CAGR through 2030, a reflection of state-backed megaprojects under China's Belt and Road umbrella and India's new rules favouring domestic landing stations. Japanese laboratories continue to set optical-throughput records, an R&D edge that cements regional leadership. South Korea and Japan's dense 5G grids escalate fiber counts per square kilometre, while Southeast Asian consortia enlarge submarine clusters that turn Singapore into a de facto regional hub. Political frictions in the South China Sea, however, raise cable-cut risks, prompting redundant routing strategies that sustain elevated capex in the fiber optic cable market.
North America, the second-largest territory, pivots from greenfield to modernization cycles. The USD 42.45 billion BEAD program keeps rural builds active, whereas mergers such as AT&T's sale of consumer fiber assets to Lumen reshape the competitive canvas. Domestic-content mandates foster capacity expansions in North Carolina and South Carolina, aligning supply with escalating AI-driven bandwidth demand. Europe reinforces subsea resilience following Baltic incidents, investing in multi-landing architectures that safeguard digital sovereignty; projects such as IOEMA illustrate the continent's resolve to diversify pathways.
The Middle East, Africa, and South America emerge as next-wave hotspots. Gulf carriers leverage geographic crossroads to host multi-continent cables, while the 2Africa ring brings 45,000 km of new capacity that slashes latency and wholesale prices across Africa. Mediterranean ventures like Medusa extend reach into North Africa, whereas Brazil leads Latin American fiber rollouts tied to cloud-region launches. Financing, regulatory clarity, and skilled-labor availability remain challenges, but higher mobile-data adoption rates anchor a compelling long-term narrative for the fiber optic cable market.
- Prysmian Group
- Corning Inc.
- Sumitomo Electric Industries Ltd.
- Furukawa Electric Co., Ltd.
- CommScope Holding Company Inc.
- Fujikura Ltd.
- Nexans S.A.
- LS Cable and System Ltd.
- OFS Fitel LLC
- Sterlite Technologies Ltd.
- Hengtong Optic-Electric Co. Ltd.
- Yangtze Optical Fiber and Cable (JOFC)
- ZTT Group
- Proterial Ltd.
- Finolex Cables Ltd.
- Belden Inc.
- General Cable Corp.
- Hexatronic Group AB
- HMN Tech Co., Ltd.
- Taihan Fiberoptics Co., Ltd.
Additional Benefits:
- The market estimate (ME) sheet in Excel format
- 3 months of analyst support
TABLE OF CONTENTS
1 INTRODUCTION
- 1.1 Study Assumptions and Market Definition
- 1.2 Scope of the Study
2 RESEARCH METHODOLOGY
3 EXECUTIVE SUMMARY
4 MARKET LANDSCAPE
- 4.1 Market Overview
- 4.2 Market Drivers
- 4.2.1 Increasing penetration of high-speed internet and global data-traffic surge
- 4.2.2 Accelerated 5G roll-outs and fiber-deep FTTx deployments
- 4.2.3 Expanding hyperscale data-center interconnect demand
- 4.2.4 Government-backed rural broadband and digital-inclusion programs
- 4.2.5 Sub-sea route diversification for geopolitical resiliency
- 4.2.6 Sustainability push replacing copper with low-carbon glass fiber
- 4.3 Market Restraints
- 4.3.1 High civil-works cost and right-of-way complexities
- 4.3.2 Price volatility in raw materials and helium supply constraints
- 4.3.3 Delays in environmental permitting for submarine routes
- 4.3.4 Plateauing telco CAPEX in saturated metro markets
- 4.4 Value/Supply-Chain Analysis
- 4.5 Regulatory Landscape
- 4.6 Technological Outlook
- 4.6.1 Multi-core and hollow-core fiber roadmap
- 4.6.2 Integrated photonics and silicon-photonics transceiver integration
- 4.7 Pricing Analysis
- 4.8 Porter's Five Forces Analysis
- 4.8.1 Threat of New Entrants
- 4.8.2 Bargaining Power of Buyers
- 4.8.3 Bargaining Power of Suppliers
- 4.8.4 Threat of Substitute Products
- 4.8.5 Intensity of Competitive Rivalry
- 4.9 Investment Analysis
- 4.10 COVID-19 Impact and Recovery Analysis
5 MARKET SIZE AND GROWTH FORECASTS (VALUE)
- 5.1 By Cable Type
- 5.1.1 Armored Cable
- 5.1.2 Non-Armored Cable
- 5.1.3 Ribbon Cable
- 5.1.4 Others
- 5.2 By Fiber Mode
- 5.2.1 Single-Mode Fiber
- 5.2.2 Multi-Mode Fiber
- 5.2.3 Plastic Optical Fiber
- 5.3 By Installation Type
- 5.3.1 Aerial/Overhead
- 5.3.2 Underground/Buried
- 5.3.3 Submarine/Under-water
- 5.3.4 Indoor/Drop Cables
- 5.4 By End-user Industry
- 5.4.1 Telecommunications
- 5.4.2 Data Centers and Cloud Providers
- 5.4.3 Power Utilities and Smart Grid
- 5.4.4 Defense and Aerospace
- 5.4.5 Industrial Automation and Control
- 5.4.6 Healthcare and Medical
- 5.4.7 Oil and Gas and Offshore
- 5.4.8 Others
- 5.5 By Geography
- 5.5.1 North America
- 5.5.1.1 United States
- 5.5.1.2 Canada
- 5.5.1.3 Mexico
- 5.5.2 South America
- 5.5.2.1 Brazil
- 5.5.2.2 Argentina
- 5.5.2.3 Rest of South America
- 5.5.3 Europe
- 5.5.3.1 Germany
- 5.5.3.2 United Kingdom
- 5.5.3.3 France
- 5.5.3.4 Italy
- 5.5.3.5 Spain
- 5.5.3.6 Rest of Europe
- 5.5.4 Asia-Pacific
- 5.5.4.1 China
- 5.5.4.2 Japan
- 5.5.4.3 India
- 5.5.4.4 South Korea
- 5.5.4.5 Rest of Asia-Pacific
- 5.5.5 Middle East
- 5.5.5.1 Saudi Arabia
- 5.5.5.2 United Arab Emirates
- 5.5.5.3 Turkey
- 5.5.5.4 Rest of Middle East
- 5.5.6 Africa
- 5.5.6.1 South Africa
- 5.5.6.2 Nigeria
- 5.5.6.3 Egypt
- 5.5.6.4 Rest of Africa
- 5.5.1 North America
6 COMPETITIVE LANDSCAPE
- 6.1 Market Concentration
- 6.2 Strategic Moves
- 6.3 Market Share Analysis
- 6.4 Company Profiles (includes Global level Overview, Market level overview, Core Segments, Financials as available, Strategic Information, Market Rank/Share for key companies, Products and Services, and Recent Developments)
- 6.4.1 Prysmian Group
- 6.4.2 Corning Inc.
- 6.4.3 Sumitomo Electric Industries Ltd.
- 6.4.4 Furukawa Electric Co., Ltd.
- 6.4.5 CommScope Holding Company Inc.
- 6.4.6 Fujikura Ltd.
- 6.4.7 Nexans S.A.
- 6.4.8 LS Cable and System Ltd.
- 6.4.9 OFS Fitel LLC
- 6.4.10 Sterlite Technologies Ltd.
- 6.4.11 Hengtong Optic-Electric Co. Ltd.
- 6.4.12 Yangtze Optical Fiber and Cable (JOFC)
- 6.4.13 ZTT Group
- 6.4.14 Proterial Ltd.
- 6.4.15 Finolex Cables Ltd.
- 6.4.16 Belden Inc.
- 6.4.17 General Cable Corp.
- 6.4.18 Hexatronic Group AB
- 6.4.19 HMN Tech Co., Ltd.
- 6.4.20 Taihan Fiberoptics Co., Ltd.
7 MARKET OPPORTUNITIES AND FUTURE OUTLOOK
- 7.1 White-space and Unmet-Need Assessment
 光纖電纜市場-2026-2032年全球市場預測
 鐵路和地鐵基礎設施用光纖電纜:市場佔有率分析、行業趨勢和統計數據以及成長預測(2026-2031 年)
 2026-2030年全球軍用級光纖電纜市場
 光纖電纜市場商機、成長要素、產業趨勢分析及2026-2035年預測
 光纖電纜市場預測至2034年—按光纖類型、電纜類型、安裝類型、應用、最終用戶和地區分類的全球分析
 海底光纜市場-全球產業規模、佔有率、趨勢、機會、預測:按光纖類型、電纜設計、終端用戶產業、絕緣類型、應用、地區和競爭格局分類,2021-2031年
 全球光纖電纜市場規模、佔有率、趨勢和成長分析報告(2026-2034)
 光纖電纜市場分析及預測(至2035年):類型、產品類型、技術、應用、材料類型、部署模式、最終用戶、安裝模式、傳輸模式
 2026年全球超低損耗光纖市場報告光纖電纜市場:按光纖類型、電纜類型、組件、纖芯數量、應用和最終用戶分類,全球預測,2026-2032年